Publicado
Assessment of physical and physicochemical quality of main chocolates traded in Peru
DOI:
https://doi.org/10.15446/acag.v66n2.53779Palabras clave:
Ash, color, chocolate, fat, moisture, particle size, texture, water activity. (es)
Descargas
The quality of main chocolates traded in Peru was measurement in different aspects. Physical: color (C*, H*, WI), hardness and particle size; and physico-chemical: water activity (wa), moisture, fat and ash, according to the information in labeling. The thirty-experimental unit of chocolate (imported, local market, dark and milk chocolate) by experimental methods, were randomly purchased out from different stores holding business. Because of the milk content the different in color and hardness by origin, darkness had low values in color components (8.75 ± 0.94 C*, 7.60 ± 4.71 H* and 28.46 ± 0.86 WI) than milky ones (15.04 ± 2.78 C*, 34.59 ± 7.46 H*, 34.55 ± 2.87 WI) and the hardness reached a major value (914 ± 176 g at 20 ± 2 ºC) than the milky ones (788 ± 220 g at 20 ± 2 ºC). The particle size values, had no significance in the differences (p < 0.05) between selected imported (19.1 ± 3.5 microns) and local ones (20.2 ± 1.5 microns). The 37% of the evaluated chocolate had a major water activity (wa), more than 0.50 (high risk) and had no significance in the differences (p < 0.05) between imported (0.44 ± 0.10) and local ones (0.47 ± 0.07). Had higher moisture content, however fat and ash content are according to the Peruvian Cocoa and Chocolate Standards, the darky ones had major content of fat (36.12 ± 4.84 %) and also more content of ash (1.87 ± 0.41 %) than the others. The continue quality control in each step of chocolate process and stores are important for the customer.
Recibido: 24 de octubre de 2015; Aceptado: 13 de mayo de 2016
Abstract:
The quality of the main chocolates marketed in Peru was determined. The physical aspect: color (C *, H *, IB), hardness and particle size, as well as physicochemical: water activity (aw), moisture, fat and ash, correlating with the declaration of ingredients presented in the packaging. We evaluated 30 experimental units of chocolates (imported, domestic, dark chocolate and milk) by experimental methods, randomly acquired from different establishments. The difference between color and hardness by origin was attributed to the dairy component. Dark chocolate had lower values of color components (8.75 ± 0.94 C *, 7.60 ± 4.71 H * and 28.46 ± 0.86 IB) than milk constituents (15.04 ± 2.78 C, 34.59 ± 7.46 H * and 34.55 ± 2.87 IB) and in hardness values higher in imported (914 ± 176 g to 20 ± 2 ° C) than in domestic chocolate (788 ± 220 g to 20 ± 2 ° C). The particle size values did not present significant difference (p <0.05) between imported (19.1 ± 3.5 µ) and national (20.2 ± 1.5 µ). 37% of them had values of aw greater than 0.50 and a significant difference (p <0.05) was found between the imported (0.44 ± 0.10) and the national (0.47 ± 0.07). The moisture values were high, the fat content and ash, are within the specified by the normalization. It is necessary to control the quality of these products throughout the process line up to the final point of sale for consumer welfare.
Key words:
Ash, color, fat, moisture, particle size, texture, water activity.Resumen:
Se determinó la calidad de los principales chocolates comercializados en el Perú. El aspecto físico: color (C*, H*, IB), dureza y tamaño de partícula, así como fisicoquímico: actividad de agua (aw), humedad, grasa y ceniza, correlacionando con la declaración de ingredientes que presenta el empaque. Fueron evaluadas 30 unidades experimentales de chocolates (importados, nacionales, chocolate oscuro y de leche) por métodos experimentales, adquiridas aleatoriamente de diferentes establecimientos. Se atribuye al componente lácteo la diferencia entre color y dureza por procedencia, los chocolates oscuros tuvieron valores menores de componentes del color (8.75 ± 0.94 C*, 7.60 ± 4.71 H* y 28.46 ± 0.86 IB) que los de leche (15.04 ± 2.78 C*, 34.59 ± 7.46 H* y 34.55 ± 2.87 IB) y en dureza valores mayores en los importados (914 ± 176 g a 20 ± 2°C) que en los chocolate nacionales (788 ± 220 g a 20 ± 2°C). Los valores de tamaño de partícula no presentaron diferencia significativa (p < 0.05) entre importados (19.1 ± 3.5 µ) y nacionales (20.2 ± 1.5 µ). El 37% de ellos tuvieron valores de aw mayores a 0.50 y se encontró diferencia significativa (p < 0.05) entre los importados (0.44 ± 0.10) y los nacionales (0.47 ± 0.07). Los valores de humedad estuvieron elevados, el contenido de grasa y ceniza, se encuentran dentro de lo especificado por la normalización. Es necesario controlar la calidad de estos productos en toda la línea de procesos hasta el punto de venta final para el bienestar del consumidor.
Palabras clave: Actividad de agua, ceniza, color, grasa, humedad, tamaño de partícula, textura.Introduction
Chocolate is the generic name of homogeneous products obtained by an adequate manufacturing process from cocoa materials which may be combined with dairy products, sugars and/or sweeteners and other additives permitted under INDECOPI (2007). The addition of vegetable fats, different from cocoa butter, should not exceed 5% of finished product. Chocolate shall contain, on a dry matter basis, not less than 35% total cocoa solids, of which 18% at least, will be cocoa butter and 14% at least, solids-not fat cocoa (INDECOPI, 2007). Mella, Borguenson & Masson (1987), studied the chemical composition of chocolates, physical and chemical characteristics of fat, which suggest regulate essentially control analysis of moisture, fat and crude fiber. Chocolates processing factories in Peru, usually performed analysis of basic process control (particle size, viscosity) and quality (moisture, fat and ash). Instrumental techniques (color, texture and water activity) help enhance the overall quality of chocolate, they are therefore extremely important to regulate these controls by government agencies, coinciding with the proposed by Mella et al., (1987).
This research evaluated the quality of the main pure chocolates sold in the country to highlight the differences between the origin, the type of chocolate and formulation. Were evaluated 30 experimental units between dark chocolate (bitter and semisweet) and chocolate milk, acquired in major supermarkets of Peru. It was determined: color, hardness (as rheological parameter), particle size, water activity, moisture, fat and ash, as well as related to the declaration of ingredients on packages of chocolates under evaluation.
Material and methods
Samples
Dark and milk chocolate (Figure 1) unfilled or aggregates acquired in major supermarkets of Lima, Arequipa and Cusco.

Figure 1: Chocolates: (a) imported milk chocolate, (b) national milk chocolate, (c) imported dark chocolate, (d) national dark chocolate.
Chocolate were chosen major selling in supermarkets. Chocolate samples were keep in cooling rooms to avoid alteration; for milk chocolate from 18 to 22°C and for dark from 18 to 26°C (Timms, 2002). The information printed on the packaging of each product such as: type and ingredients used in the formulation, considering the ingredient is present in greater quantity is written first, descending in value until the last recorded. Coding to identify samples was number corresponding codes from 01 to 12 for imported milk chocolates, from 13 to 16 for national milk chocolates, from 17 to 27 for imported dark chocolates and from 28 to 30 for national dark chocolates.
Color
It was expressed as C*, H* and whiteness Index (WI obtained from the L* a* b* coordinates) according to Lohman & Hartel (1994). Whiteness index is determined considering the "halo" on the product surface. The Minolta CR-400(r) colorimeter was first operated with white calibration screen in the same temperature conditions in which the measurement was made. Color images of the surfaces of chocolate were converted to CIELAB system: L* lightness range from 0 (black) to 100 (white), a* defines the red-green component and b* defines the yellow-blue component, ranging from -120 to 120. The average of L* a* b* values obtained of five samples at four different positions with 90° angle and its standard deviation. With the data obtained the whiteness index (WI) was calculated according Lohman & Hartel (1994). (Equation 1).

Hardness
It was measured using the texture-meter QTS Texture Analyser(r) with TA9 (needle probe, 1.5 mm diameter; 46 mm long and 10º max taper). The chocolates were conditioned to 20 ± 2°C by 14 days before the analysis (Afoakwa, 2008).
The maximum penetration force through different chocolates was determined in eight samples of each product to the following conditions: total number of cycles one, initial point 5 g, test speed 2 mm.s-1, penetration 5 mm to 20ºC and test duration from one to two minutes (Afoakwa, 2008), converting average values of penetration force with a load of 25 kg hardness (g) using the software Texturepro(r) v. 2.1.
Particle size
It was determined by micrometer method MITUTOYO(r), which only measures big particle size (Beckett, 2008). The flat surfaces of the jaws micrometer cleared and set to zero. Therefore, was mixed in a container with 50 parts of sunflower oil with 50 parts of melted chocolate, a drop of the chocolate emulsion was placed in one of the jaws of the micrometer, the jaws are easily curled until the product particles were measured and the reading was taken in microns. The jaws were opened and cleaned for the next sample. Finally, three samples were evaluated by product.
Determination of water activity
It was performed with water activity-meter AQUALAB(r) model 3TE at 25ºC, it is employing the technique dewpoint, and it was calibrated with supersaturated solutions of: lithium chloride 8.57M and sodium chloride 6M according to AOAC, (2005). Ground sample was prepared with approximately 300 micron diameter, it was placed in plastic circular capsule. In addition, was introduced in the chamber and carefully closed. After reading the equipment beeped indicating the process had concluded. Three samples were evaluated by product.
Determination of moisture, fat and total ash content
For moisture content was applied by drying loss in an oven, method AOAC 931.04 (2005) for three samples. For fat content (using dry sample) was applied by extracting fat with petroleum ether, Soxhlet method AOAC 963.15 (2005), for two samples. For total ash content (using dry sample) was calcined and using a muffle by AOAC, (2005) for three samples.
Statistical data processing
The random complete block design was applied (RCBD) to determine differences p<0.05 among chocolate samples according to: origin (imported and national), type of chocolate (milk and dark) and formulation (group 1, group 2 and group 3), selecting by increased demand. Selected samples from imported milk chocolates with codes 06, 10 and 11; for imported dark chocolates with codes 19, 20 and 24. Samples from national milk chocolates with codes 13, 15 and 16; for national dark chocolates codes 28, 29 and 30. In addition, group 1 were: 6, 19, 13 and 28, group 2 were: 10, 20, 15 and 29 and group 3 were: 11, 24, 16 and 30. The Statisgraphics 5.0 Plus(r) software was used for statistical analysis.
Results and discussion
Declared formulation of chocolates
Table 1, shows assigned codes to the ingredients, which are made of imported milk and dark chocolates, respectively. It is observed the imported milk chocolate ingredient performed in greater quantity, sugar (in Table 1, is assigned a value of 1), following whole milk powder as well as cocoa butter (in Table 1, is assigned a value of 3) and the cocoa mass/skim milk powder (value of 4), with an average of 29% of cocoa, less than 35% of cocoa (INDECOPI, 2007). For dark chocolate, first ingredient is cocoa mass, followed by sugar, cocoa butter, cocoa powder, emulsifiers (soy lecithin) and flavoring, with an average content of cocoa of 62%.
Table 1: Coding of the ingredients for Tables 2, 3, 4 and 5.
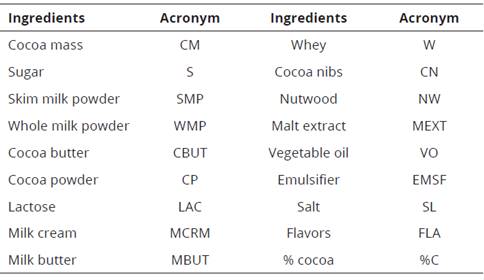
Table 2: Assigned value to the ingredients accordingly to declared position in imported milk chocolates (code 1-12)

Table 3: Assigned value to the ingredients accordingly to declared position in imported dark chocolates (code 17-27)

Tables 2 and 3, shows ingredients of national milk and dark chocolates, it can see that the first ingredient of national milk chocolate is also sugar (value 1), followed by cocoa mass and cocoa butter (value 3) and in the evaluated samples only one chocolate was reported cocoa content on the label although currently some companies are already reporting without reaching 35% of cocoa both cases out of national standards (INDECOPI, 2007).
In national dark chocolate, the first ingredient due to the amount, is sugar (value 1), followed by cocoa mass (value 2) and third ingredient is cocoa butter (value 3) with an average of 54% of cocoa. (Tables 4 and 5).
Table 4: Assigned value to the ingredients accordingly to declared position in the national milk chocolates (code 13-16).

Table 5: Assigned value to the ingredients accordingly to declared position in the national dark chocolates (code 28-30).

Color chocolates
Table 6, shows values of color in two type of coordinates, first as cylindrical coordinates (L*) luminance or lightness, Chroma or saturation (C*) and tonality (H*) and second as rectangular coordinates L*, a* and b* (Jiménez, 2001), all values for chocolates, L* value is the major in milk chocolate than dark chocolates due to dairy component in the formulation.
The whiteness index (WI) is major in milk chocolates (WI 34.55) than in dark chocolates (WI 28.46), also being the highest standard deviation in the first through the different formulations on this type of product. Usually the formulation of milk chocolate is added whole milk powder, skim milk powder, whey powder and others dairy components (lactose, cream and butter) to lighten the color of the final product.
Table 6: Values of color components of imported and national chocolates, both milk and dark.

The color of dark chocolate is also observed, at higher cocoa content the WI is decreasing: chocolate with 40 and 72% of cocoa WI is 29.13 and 27.24 respectively (Pastor et al., 2007), a high cocoa content in the product becomes more stable color during storage. Dark chocolate has less standard deviation (variability) because of the ingredients in the formulation, less different ingredients, in this case only three ingredients: cocoa mass, cocoa butter and white sugar (Tables 3, 5 and 6). Accordingly to Figures 3a and 3b, there are significantly differences (p < 0.05) among average whiteness index of imported and national chocolate selected, as well as milk and dark type of chocolate. However, there are not significantly differences (p < 0.05) among three formulations selected of the three groups considering milk and dark chocolate (Figure 3c).
Table 6, shows values range of chrome and tonality, of the components C* (7.50 to 10.42) and H* (1.91 to 14.97) for dark chocolate are lower than for milk chocolate C* (10.43 to 18.73) and H* (20.08 to 46.87). Some major differences are shown in L* and b*, first at average values of L* in milk chocolate is higher (32.28) than dark chocolate (29.72) by the presence of light-colored ingredients (sugar, milk powder, whey powder) and dairy products that has a direct impact with whiteness index (Figure 4b) and then an average values b*, in dark chocolate is lower (1.22) than in milk chocolate (8.69) for greater amount of cocoa butter and milk fat (yellow color, positive values of b*).

Figure
2
: Comparison among whiteness indexes as: (a) origin, (b) type of chocolate and (c) formulation.

Figure 3: Comparison among the hardness values of chocolates by: (a) origin, (b) type of chocolate and (c) formulation.
Hardness chocolates
The chocolate hardness is expressed in grams (Afoakwa, 2009), thirty experimental units were evaluated at a temperature of 20 ± 2°C. Results are shown in Table 7, where dark chocolate performed a higher average hardness value (891 g) than milk (656 g), first with values between 481 g (national) and 1204 g (imported), second with values between 111 g (imported) and 985 g (national). For these reasons, imported dark chocolates on average are harder (918 g) than all other chocolate evaluated, and milk chocolates imported on average are softer (636 g), because five of them contain butter milk, one with milk cream and the other one vegetable oil as the ingredient statement.
The findings of the evaluations carried out can be supported in the hardness of chocolate possibly more dependent on the composition of fatty acids and fatty solids content containing the product that comes from the ingredients declared. In the case of milk chocolate, the total fat consists of a mixture of cocoa butter and milk fat (milk butter and milk cream), which gives lesser hardness by the above mentioned compared to dark chocolate and greater ease of melting in the mouth by the lower melting point at body temperature.
Table 7: Hardness of milk and dark chocolates, imported and national.

The experimental units assessed the highest standard deviation was presented to the group of national dark chocolates (277 g) being only three evaluated (codes 28, 29 and 30) which showed great differences in their hardness values. Comparing these values with Table 5, only for national dark chocolates, hardness reflected inversely to the amount of cocoa; product with 1014 g of hardness indicated 45% cocoa and product with 481 g of hardness is 65% cocoa. For products with higher hardness in their formulation cocoa mass is indicated as a second ingredient and for those soft ones cocoa mass is first ingredient. The national dark chocolate with higher hardness also may be related to what was said by Minifie (1999), the chocolate-flavored (less than 35% cocoa) they are harder than chocolates, theoretically hardness help to define the true chocolate, sugar particle is harder than particle cocoa mass. Besides cocoa butter substitute have another composition, they are not completely melted at 37°C (Wennemark et al., 2012), and cocoa butter does melts at body temperature (De Bruijne, 2001). On the other hand consider the cocoa butter of South America (Brazil) is softer than the cocoa butters from others origins, West Africa (Minifie, 1999) and Malaysia (Beckett, 2008).
Statistical average results shows in Figure 4b no significant differences (p < 0. 05) among type of milk and dark chocolates. However, in Figure 4c, significantly differences were observed (p < 0.05) between the three formulations selected chocolates, as comparing formulation 1 (codes: 6, 19, 13 and 28) performed value harder than formulation 2 (codes 10, 20, 15 and 29) and formulation 3 (code: 11, 24, 16 and 30) although cocoa mass is the first ingredient in formulation 1, this is not the cause and other ingredients or other causes are responsible for the greater hardness.

Figure 4: Comparison among the values of particle size by: (a) origin, (b) type of chocolate and (c) formulation.
Particle size chocolates
We evaluated the particle size of the chocolates with use of the micrometer (detects large particles). In Table 8, imported chocolates performed a slightly smaller particle size (19.1 microns) than national chocolates (20.2 microns). The assessed imported milk chocolates (41.7%) have a particle size less than 18.5 microns and for dark chocolate (imported and national) those products reported particle sizes less than 18.5 microns were those who had a high hardness which is according to Afoakwa (2009),low particle size, the number of particles increases in parallel with contact points between particles, resulting in a high firmness. In the statistical part, there is no significantly differences (p < 0.05) according to the chocolate origin (imported or national) (Figure 5a), the type of chocolate (milk or dark) (Figure 5b) and formulation (groups 1, 2 and 3) (Figure 5c), which means the product worked under the minimum values and therefore, performed high quality. The fine particle size is the result of working with the cocoa mass using the mill machine, then chocolate mass with pre-refiner, refiner and conching machine in the chocolate line.
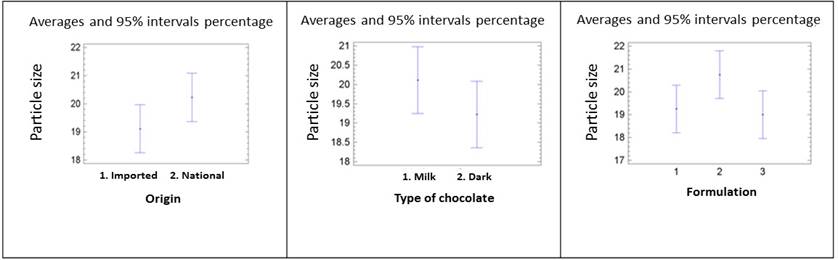
Figure 5: Comparison among the values of particle size by: (a) origin, (b) type of chocolate and (c) formulation.
Table 8: Particle size values of imported and national chocolates, milk and dark.

Water activity chocolates
In Table 9, with the results of the experimental units, we can afirm the 37% of chocolates evaluated beyond the upper limit (greater than 0.50) (Burndred, 2009; Cakebread, 1971, and Hilker, 1976, mentioned by ICMSF, 1985) and it is expected to reach 0.60 water activity (wa) values for being stored in an unsuitable environment (high relative humidity) as manifested by Minifie (1999), dark chocolates begin to absorb moisture when the environment have 85% RH and in the case of milk chocolate will be 78% RH, because not all centers sale of chocolates in Peru has controlled relative humidity, it considering also told by Minifie (1999), it may deteriorate before their lifetime, so the care must be taken to control the relative humidity of the stores where these products are inside.
Figures 6b shows no significantly differences (p <0.05) in the values of water activity by type of chocolate. However, Figure 6a shows there is significantly differences (p <0.05) for imported origin of those selected with national, where the latter performed a higher water activity (0.47) and, therefore, increased risk of deterioration and less time shelf life, as deterioration reaction by the presence of lipase acting values above 0.20 water activity (Minifie, 1999). Figure 6c shows there are significantly differences among groups of formula 1 (6, 19, 13 and 28) with formula 2 (10, 20, 15 and 29) and formula 3 (11, 24, 16 and 30), also groups of formula 2 and 3 show no significant differences between them with values lower than 0.5 of water activity.

Figure 6: Comparison among the values of water activity by: (a) origin, (b) type of chocolate and (c) formulation.
Analyzing we can infer in the group of formula 1 values are greater water activity 0.49 and these are two national and two imported chocolates both milk and dark, having in common for all these chocolates areas of the storage for center sale, possibly with greater than 65% relative humidity.
Physicochemical characteristics of chocolates
The average moisture of all products was 1.17 ± 0.47%, with national milk chocolates which had higher values (1.36 ± 0.37%); acceptable value for Kirk (2008), reported among 0.8 to 2.3% and for INDECOPI (2007, that not detailed limit values for humidity but not for Minifie (1999), and Beckett (2009), reporting values less than 1% moisture, the results are shown in Table 10. The average ash content was 1.78 ± 0.35%, with dark chocolates imported those who performed higher values (1.92 ± 0.43%) (Table 11). Values are regulated within the range of 1.00 to 2.35% (Kirk, 2008). The average fat content was 34.28 ± 4.81%, being imported dark chocolates which performed higher (37.08 ± 5.05%), found within the range reported by Kirk (2008), 30 to 40% fat content. The 13.3% of all chocolates evaluated (4 of 30) are less than 30% fat content. Minifie (1999), mentions the existence of good quality chocolates containing less than 28% fat, which can be applied to what was found for one of 30 chocolates (3.3% of the tested products).
Table 10: Physiochemical values of imported and national milk chocolates

Finally, it was observed 76.6% of the tested products are imported (23 of 30 chocolates), this encourages to national chocolate companies continue to develop new brands to position themselves in the local market. Furthermore, 53.5% of the evaluated (16 of 30 chocolates) are milk chocolates shown in Table 10, which could be an indicator of the Peruvian consumer preference for the dairy flavor and sweet, that is, by formulations with lower cocoa content. Note that imported dark chocolates have higher cocoa content 62 ± 12% than national dark ones (54 ± 10%), what could sue, in order to improve the nutritional and sensory quality, a reformulation of them.
Table 11: Physiochemical values of imported and national dark chocolates.

Conclusion
Accordingly to origin, imported dark chocolate have first ingredient cocoa mass (62 ± 12% of cacao) and national dark chocolates have first ingredient sugar (cacao content = 54 ± 10%). In terms of chocolate, declared formulation, labeling ingredients, milk chocolates performed as major ingredients, the sugar and milk, chocolate can reach 35% of cacao (label), all of dark chocolates declared with 60 ± 12% of cacao. In addition, in the formulation stage, were found significantly differences in hardness due to sorted sugar and cocoa mass content, as significantly differences in water activity (0,55 ± 0,03) due to relative humidity in storage as major as 65% RH. The moisture, ash and fat content, was performed in standard chocolates.
Acknowledgements
The Industry Faculty (FIAL - UNALM, Peru) for allowed us to use the Physicochemical analysis and Research laboratories
References
Referencias
Afoakwa, E., Paterson, A., Fowler, M., & Vieira, J. (2008). Particle size distribution and compositional effects on textural properties and appearance of dark chocolates. J Food Eng, 87(2), 181-190. http://dx.doi.org/10.1016/j.jfoodeng.2007.11.025
Afoakwa, E., Paterson, A. Fowler, M., & Vieira, J. (2009). Microstructure and mechanical properties related to particle size distribution and composition in dark chocolate. Int J Food Sci Tech, 44, 111-119. http://dx.doi.org/10.1111/j.1365-2621.2007.01677.x
AOAC. (2005). Official Methods of Analysis of AOAC International.18th Edition, Volume II. William Horwitz and George W. Latimer, Jr. (Eds.) Maryland, USA. p487.
Beckett, St. (2008). The Science of Chocolate. The Royal Society of Chemistry (Eds.). Cambridge, England. p242. http://dx.doi.org/10.1039/9781847558053
Beckett, St. (2009). Industrial Chocolate Manufacture and Use. 4th edition. Wiley-Blackwell (Eds.) New York, United Kingdom. p720. http://dx.doi.org/10.1002/9781444301588
Burndred, F. (2009). Food Safety in Chocolate Manufacture and Processing. In Beckett, S (Eds). Industrial Chocolate Manufacture and Use. (pp. 530-550). New York, United Kingdom. http://dx.doi.org/10.1002/9781444301588.ch23
De Bruijne, D.W., & Bot, A. (2001). Alimentos elaborados basados en grasa. En: Rosenthal A. (Ed). Textura de los alimentos, medida y percepción. (pp. 189-208). Acribia, S.A. (Eds.). Zaragoza, España.
ICMSF. (1985). International commission microbiological specifications for food. Ecología microbiana de los alimentos. Volumen II. Productos alimenticios. Acribia, S.A. (Eds.). Zaragoza, España. p345.
INDECOPI. (2007).NTP 208.002 Chocolate - Requisitos. 3era Edición. Lima, Perú. p164.
Jiménez, A., & Gutiérrez, G. (2001). Color. En: Alvarado J. and Aguilera J. (Ed), Métodos para medir Propiedades Físicas en Industrias de Alimentos. (pp. 325-346). Acribia, S.A. (Eds.). Zaragoza, España. p426.
Kirk, R., Sawyer, R., & Egan, H. (2008). Composición y análisis de alimentos de Pearson. Novena reimpresión. Grupo Editorial Patria (Eds.).
México D.F., México. p773.
Lohman, M. & Hartel, R. (1994). Effect of milk fat fractions on fat in dark chocolate. J Amer Oil Ch Soc, 71(3), 267-275. http://dx.doi.org/10.1007/BF02638052
Mella, M., Borguenson, R., & Masson, L. (1987). Composición química y valor calórico de los chocolates. Características físicas y químicas de la materia grasa. Alimentos, 12 (4), 7-14.
Minifie, B. (1999). Chocolate, cocoa and confectionery. Science and Technology. Third Edition. Aspen Publishers, Inc. (Eds.). Maryland, Unite States. p826. http://dx.doi.org/10.1007/978-94-011-7924-9
Aastor, C., Santamaria, J., Chiralt, A., & Aguilera, J. M. (2007). Gloss and colour of dark chocolate during storage. Food Sci Technol Int, 13 (1), 27-34. http://dx.doi.org/10.1177/1082013207075664
Timms, R. (2002). Oil and fat interaction. Proc 56th PMCA Production Conference. April 8 – 10 (pp 43-57). Hershey, PA, Unite States.
Wennermark, B., Granroth, B., Kruse, B., Tudesjo, C., Atkinson, G., Bergqvist, G., Malmros, H., Alander, J., Karlsson, J., Thieme, J., Johnston, K., Bjornsholt, K., Ingvarsson, L., Hakansson, M., Pedersen, M., Persson, M., Wennermark, M., Johansson, M., Hjorth, M., Persson, P., Shaw, P., Miller, R. L., Eriksson, S. & Fyke, T. (2012). Chocolate and Confectionery. In: Nielsen K (Ed). Handbook vegetable oils and fats. Sweden. AAK Academy. p819.
Cómo citar
APA
ACM
ACS
ABNT
Chicago
Harvard
IEEE
MLA
Turabian
Vancouver
Descargar cita
CrossRef Cited-by
1. E S Harahap, S Addina, E Julianti, M M Lubis. (2023). The effect addition of palm oil and coconut oil on the proximate value of pendawa chocolate, North Sumatra. IOP Conference Series: Earth and Environmental Science, 1230(1), p.012164. https://doi.org/10.1088/1755-1315/1230/1/012164.
2. İnci Cerit, Könül Mehdizade, Ayşe Avcı, Omca Demirkol. (2024). Production of low‐protein cocoa powder with enzyme‐assisted hydrolysis. Food Science & Nutrition, https://doi.org/10.1002/fsn3.3997.
3. Carmen Adela Orihuela-Rivera, Gabriela Cristina Chire, María Rosario Calixto-Cotos. (2018). Antioxidants properties of chocolates sold in Peru. Acta Agronómica, 67(4), p.479. https://doi.org/10.15446/acag.v67n4.71357.
Dimensions
PlumX
Visitas a la página del resumen del artículo
Descargas
Licencia
Derechos de autor 2017 Acta Agronómica

Esta obra está bajo una licencia internacional Creative Commons Atribución-NoComercial-SinDerivadas 4.0.
Política sobre Derechos de autor:Los autores que publican en la revista se acogen al código de licencia creative commons 4.0 de atribución, no comercial, sin derivados.

Es decir, que aún siendo la Revista Acta Agronómica de acceso libre, los usuarios pueden descargar la información contenida en ella, pero deben darle atribución o reconocimiento de propiedad intelectual, deben usarlo tal como está, sin derivación alguna y no debe ser usado con fines comerciales.