


Publicado
PARAMETER STABILITY IN FREIGHT GENERATION AND DISTRIBUTION DEMAND MODELS IN COLOMBIA
Palabras clave:
Parameter stability, freight generation models, freight distribution models (es)PARAMETER STABILITY IN FREIGHT GENERATION AND DISTRIBUTION DEMAND MODELS IN COLOMBIA
ESTABILIDAD DE PARAMETROS EN MODELOS DE GENERACION Y DISTRIBUCION DE CARGA EN COLOMBIA
JOSE HOLGUÍN-VERAS
Professor Department of Civil and Environmental Engineering - Rensselaer Polytechnic Institute - USA, jhv@rpi.edu
IVÁN SARMIENTO
Professor Department of Civil Engineering - Universidad Nacional de Colombia Sede Medellín, irsarmie@unal.edu.co
CARLOS A. GONZÁLEZ-CALDERÓN
Professor Department of Civil and Environmental Engineering - Universidad de Antioquia, gonzalez@udea.edu.co
Received for review August 17th, 2009, accepted August 4th, 2010, final version September, 6th, 2010
ABSTRACT: This paper conducts an empirical investigation on the temporal stability of parameters of freight demand models in the short-medium term. The analyses are based on seven national freight origin-destination samples conducted by the Colombian government during the years 1999 to 2005. The paper studies the stability of the parameters of freight generation and freight distribution. Typical formulations of these models were calibrated using the cross-sectional data corresponding to each year. Then, to identify time-dependent effects, the resulting parameters were regressed as a function of a time index. The results indicate the presence of statistically significant time-dependent effects on all freight generation models (production and attraction), as well as on the freight distribution model estimated with loaded vehicle trips. In contrast, the parameters of the freight distribution models based on commodity flows were found to be stable overtime.
KEYWORDS: Parameter stability, freight generation models, freight distribution models
RESUMEN: Este artículo presenta una investigación empírica sobre la estabilidad de parámetros en los modelos de demanda de transporte de carga en periodos cortos de tiempo. El análisis es realizado con base en 7 encuestas origen-destino a vehículos de carga efectuadas por el Ministerio de Transporte durante los años 1999 al 2005. El artículo estudia la estabilidad en el tiempo de los parámetros en los modelos de generación y distribución de carga, calibrándolos con secciones transversales de datos correspondientes a cada año y haciendo regresiones a los parámetros resultantes como función del tiempo para identificar el efecto de la dependencia del mismo en los modelos. Los resultados indican que todos los modelos de generación de carga son dependientes del tiempo así como los modelos de distribución de carga basados en camiones cargados. En contraste, se encontró que los parámetros de los modelos de distribución de carga basados en toneladas transportadas son estables en el tiempo.
PALABRAS CLAVE: Estabilidad de parámetros, modelos de generación de carga, modelos de distribución de carga
1. INTRODUCTION
Analytical transportation planning relies on the use of demand and supply (network) models to predict future conditions and the impact of different projects and programs on the transportation system. In most cases, the models used in these activities are calibrated using cross-sectional data from a calibration (base) year. Once the models have been successfully calibrated, their independent variables are forecasted for different scenarios, and used as an input to freight demand models to obtain estimates of future demand. Parameter stability is important because evidence of it provides a direct indication of the validity of a model [1], as a model that is not stable over time is likely to produce inaccurate predictions [2].
In the overwhelming majority of cases, temporal parameter stability is implicitly invoked by assuming that the models’ parameters do not change over time. The practical reasons are obvious as, more often than not, there are no data to study how the parameters evolve over time. This is not to say that there are no concerns about assuming parameter stability, as there are many indications that this assumption is problematic. First, since in most cases cross sectional data are used for model development and calibration, should the economic conditions be such that they impact the freight flows captured in the data, the parameters of the models will be affected as well. Once economic conditions change, the freight flows and the parameters of the corresponding models are bound to change as well. Second, the ever changing nature of the world economy means that the economic linkages between different economic sectors are constantly being created, transformed, and sometimes eliminated. In this context, emerging economic sectors are likely to lead to freight flows not necessarily captured—and in some cases not even dreamed of—by the data collection efforts used for calibration purposes. For instance, the globalization of the world economy has led to major increases in the volumes and the distances at which freight is transported. As a result, it is unlikely that freight models calibrated with data collected in the 1980s could have captured, and much less predicted, the freight flow patterns produced by globalization. Third, there is the role played by political and social drives. Events such as the collapse of the Soviet Union produced major changes in the patterns of commerce in Europe. Societal trends, such as the increasing level of awareness of environmental concerns, are inducing companies to change their distribution and delivery patterns, out of a desire to be perceived as a responsible corporate citizen that cares for the environment. In many instances, companies have implemented changes in their distribution patterns that, although are more sustainable in the long term, are more costly. As in the previous case, the net effect is to change the geographical patterns of freight flows and their relation to transportation costs, which impact the parameters of freight demand models that capture the sensitivity to transportation costs.
The key implication of all of this is that the assumption of temporal parameter stability—which is at the heart of transportation demand modeling research and practice—is not likely to hold. Surprisingly enough, not much research has been reported in the literature concerning the subject of parameter stability, and even less in the area of freight demand. As a reflection of this, the literature review only produced a handful of papers.
For the most part, the papers found have focused on transferability issues ([1], [3], [4]). However, during the 1980s a body of literature emerged with empirical evidence about the stability (or in most cases, lack of it) of parameters of disaggregate travel demand models, across space, cultures, and time [2]. In reference [4] the author used a multinomial Logit mode choice model to examine the validity of model specification, and the temporal stability of its parameters. The author found that the specific variables remain stable over the short run period, and that the parameters used are appropriate for immediate and short term forecasting. Other papers have made indirect mention of parameter stability issues [5].
The main objective of this paper is to contribute to the study of parameter stability of freight demand models via a systematic study of seven national freight origin-destination (OD) matrices collected by the Republic of Colombia’s Ministry of Transportation during the 1999 to 2005 time period. Since efforts were made to obtain older OD data but were not successful, the emphasis of the paper is on short-medium term changes as this is what is permitted by the data available. In the future, once additional data sets come in line, it will be entirely possible to re-examine the analyses made here with the perspective that provides the long term.
The main focus is on the various aspects concerning freight demand at the aggregate level. This includes generation and distribution. The OD data are used to estimate basic cross-sectional demand models for each of the various years for which data are available. The parameters from the cross-sectional models were regressed as a function of a time index to determine the statistical significance of the time dependent effect.
This paper has five sections in addition to this introduction. Section 2 provides the reader with a brief description of the data used in the paper. Sections 3, 4, and 5 offer discussions on the results of parameter stability analyses of freight generation and distribution respectively. Finally, Section 6 is a summary of the key findings from the research.
2. DESCRIPTIONS OF THE DATA
The Freight Origin–Destination Survey (FODS) is a data collection program initiated by Colombia’s Ministry of Transportation about 20 years ago. Initially, the FODS was conducted by the National Institute of Transport (Instituto del Transporte, INTRA) and, more recently, by the National Roads Institute (Instituto Nacional de Vias, INVIAS). The FODS is conducted at about 70 survey stations where interviews are made to collect data about origins and destinations, commodity type, vehicles used for such activity, and type of container used, among others.
The FODS provides a comprehensive picture of national freight flows in Colombia, and is the only available source of data for the highway modes that carry about 70% of the tonnage of freight transported, which is about the same mode split reported by the Commodity Flow Survey (CFS) in the United States. However, while the CFS is a shipper-based survey, the FODS is roadside survey that targets the carriers. The FODS is a sizable data collection program with more than 130,000 surveys every year. It provides useful information for freight transportation planning, though it has not been fully exploited for research purposes.
The data are collected for five consecutive days in a representative week of the year, between 6:00 AM and 6:00 PM. The target population includes all trucks with a capacity larger or equal to two metric tons, which pass the screenlines survey within the survey time. To avoid double counting, a ticket is given to drivers who have been interviewed so that they are not subsequently interviewed at another station along the trip. It is assumed that the maximum error is one that is typical of field measurement: by the omission of any vehicle that is not counted (less than 1%), or by the influence of flow at night (less than 5%) that was not respondent in the variation of the overall results. However, the authors do not have enough information to estimate the error.
At the finest level of geographic detail, the survey data are geocoded at the municipal level, which leads to OD matrices with 1,100 x 1,100 cells. The analyses in this paper are based on an aggregation of 36 zones because in this format the coverage is more complete (electronic versions of the original files at a finer level of detail have only been found for four years). The zoning system used includes 32 internal zones (departments) and 4 external zones (Ecuador, Venezuela, Peru, and Panama). The total highway length used in the model is 27,469 Km. The zoning system and the corresponding highway network are shown in Figure 1 [7].
Figure 1. Zoning System and Highway Network (Colombia)
3. FREIGHT GENERATION
Freight generation is concerned with the estimation of the amount of freight produced and attracted by either individual establishments or zones. As in almost all other components of freight demand models, the amount of publications discussing freight generation is small. It suffices to say that only four out of the 1,500 pages of the ITE’s Trip Generation Manual deal with freight [6]. The generation of freight is a complex topic. Part of its complexity stems from the fact that it is determined by the internal practices and operational procedures of the establishment that produces/attracts the freight. A restaurant with limited storage capacity, for instance, is bound to attract more delivery trips than a restaurant with a larger storage space in equality of conditions, simply because of the more frequent deliveries required by the constrained storage space. Adding to the complexity, freight could be measured in multiple ways (e.g., weight, vehicle-trips, deliveries); and studied at the zonal or the establishment level. Regarding the level of aggregation, there seems to be consensus that establishment-level models have a better chance of capturing the underlying dynamics of the process, though the data are costlier to collect. The paper focuses on zone-level models, which is typical of national freight demand modeling projects.
This chapter focuses on the temporal stability of parameters related to freight generation (i.e., production and attraction). The analyses use department-level estimates of Gross Domestic Product (GDP) and population as the independent variables that explain production and attraction of freight. Although other independent variables could be used, focusing on these two is important because they are frequently used to explain freight demand. The GDP and population were obtained from Colombia’s Department of National Statistics [8].
3.1 Freight production
The data used to study the relationship between freight production and GDP spans seven years (1999-2005). There are good reasons to use GDP, or any other indicator of economic output, as the freight flows are nothing more than the physical representation of the trade patterns captured in these indicators. Two different sets of econometric models are estimated. The first one consists of models with GDP as the only independent variable, while the second set of models considers the effect of local ports.
To start, it is convenient to take a look at the relationship between the total tons produced by different zones and their GDP.
Figure 2 shows the results for 1999 and 2005. The figure shows that in general, both GPD and freight production track each other fairly well, and that over time more cargo is being transported for the same level of GDP.

Figure 2. Tons Produced vs. GDP (1999 and 2005)
Figure 2 also shows a number of spikes in freight production that correspond to ports. Jurisdictions in which a port is located have been marked with an asterisk.
Using econometric modeling could help gain insight into the nature of the relationship between total freight and GDP. The first model estimated follows equation (1):
 (1)
(1)
Where: FP, is the production function in tons; and GDP is the Gross Domestic Product of each department in millions of Colombian pesos (about US$1,600).
The second model is a power function (equation 2), which has the advantage that the exponent is the elasticity of production with respect to GDP. The model was originally estimated with an intercept, which was later removed because it was not significant. The results for the different cross sections are shown in Table 1.
 (2)
(2)
Table 1. Parameters of Freight Production Models

Table 1 shows that the parameter  in the linear model varies between 0.81 and 1.26, indicating that on average one million of Colombian Pesos of GDP (about US$1,600) are needed to produce a ton of freight. The results also show that the parameter
  in the linear model increases overtime, and, in 2005 is 1.4
times the parameter in 1999. The power function is apparently more stable in the parameter (elasticity) though the reader should keep in mind that a change in the parameter of 4% can represent a change in the estimates of more than 50%. As shown in the table, the parameters were found to be statistically significant and time-dependent.
An alternative model takes into account the additional freight produced by a port. This was accomplished with the introduction of a binary variable (Port) into the model. The zones with ports dedicated to oil or coal exports were not included in the analyses because they typically use either pipelines or rail to transport the cargo, and do not produce general cargo. The formulations are shown in equation (3) for the linear model, and in equations (4) and (5) for the power model, and the results can be seen in Table 2.
 (3)
(3)
The power model is:
 (4)
(4)
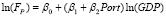 (5)
(5)
Table 2. Parameters of Freight Production Models Including Ports

It is important to note that in the linear model the parameter  in 2005 is 1.4 times the parameter in 1999, while the combined parameter (
 +
+ Port) for zones with a port, in 2005 is 1.6 times that corresponding to 1999. This clearly suggests that in the linear model the freight generation in port zones is growing more rapidly than in the rest of the country.
Similarly, the parameter  of the power model in 2005 is 1.035 times the parameter in 1999, while the parameter (
 +
+ Port) in 2005 is 1.025 times the parameter corresponding to 1999. Although this seems to indicate that the parameters of the power function are more stable, in reality this is not the case as a small change in an exponent would lead to a major change in the dependent variable. The results show that in the linear model, the parameter of GDP is more stable than the one for Port(GDP). The same trend is observed in the power model. In almost all cases, however, the time index variable was found to be statistically significant (|t-value| > 1.96) as an explanatory variable of the change of value of the parameters over time.
3.2 Attraction Models
In this subsection, the relation between total tons attracted by the different zones and their corresponding populations is studied. The data are shown in Figure 3 for 1999 and 2005. As in the case of freight production, the data show that the amount of freight attracted by the population centers has increased over time. As shown, while the city of Bogota attracted about 13 million tons in 1999, in 2005 this number increased to more than 20 million tons.
Figure 3. Tons attracted vs. Population (1999 and 2005)
As in the previous case, econometric modeling was undertaken using the cross-sections for each year. The linear model used is shown as in equation (6), and the corresponding power function in equation (7). The statistical results are summarized in Table 3.
 (6)
(6)
Where FA is the production function in tons, and POP is the Population of each zone in number of inhabitants:
 (7)
(7)
Table 3. Parameters of Freight Attraction Models

The parameters of the linear models vary between 1.93 and 3.48 with an average of about 2.50 which indicates that during this time period, one individual attracts about 2.5 tons of freight per year. This value is still small compared with developed countries like the United States, where the value is 38 tons per capita in all modes, and 26 tons in highways (69%) in 2002 [9]. Both models (linear and power) also show that the amount of cargo attracted by the population is increasing over time. An alternative model takes into account the additional freight attracted by a port. The linear model used is shown in equation (8) and the corresponding power function in equation (9). The statistical results are summarized in Table 4.
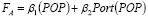 (8)
(8)
 (9)
(9)
Table 4. Parameters of Freight Attraction Models Including Ports
The analyses in this section clearly indicate that, regardless of the formulation used during estimation, the parameters of freight attraction and production have increased over time. The statistical models that express the parameter values as a function of the time index indicate that, in almost all cases, the parameters are time-dependent. As an illustration, the parameters of the linear model of freight production increased 40% between 1999 and 2005, while the parameter of the linear model of freight attraction increased 73% in the same time period. In essence, these results indicate that, over time, more freight is being produced and attracted by a unit of GDP and population, respectively.
4. FREIGHT DISTRIBUTION
The second group of models to be studied is the one that focuses on the estimation of freight distribution patterns. This is probably one of the processes in which freight demand modeling is the weakest, as it is the one where the mismatch between model assumptions and reality is the largest. Although the reasons are many and cannot be fully enumerated here, it is important to discuss the key ones.
The bulk of freight demand modeling applications relies on the use of distribution models originally designed for passenger demand modeling. The main focus of these models, e.g., gravity, is on explaining the flows between an origin i and a destination j as a function of the attributes of i and j, and the corresponding travel impedance. This approach is acceptable in passenger transportation as, in most cases, it could be argued that these assumptions are appropriate. However, in freight transportation—where long tours are the norm and not the exception—this assumption could be problematic. In Denver, for instance, the number of stops per tour is 5.6 [10]. As result of the multiplicity of individual trips in a long tour, the physical origins and destinations of the individual trips in the tour are likely to be very different than the sites that mark production and consumption relationships. When this happens, the assumption made by most distribution models, i.e., that the individual trips could be explained by the attributes of i and j, breaks down and the use of traditional distribution models is called into question. This is likely to be the case of urban freight. However, there are cases in which the mismatch between production-consumption (PC) and origin-destinations (OD) is less critical. One of such case is intercity freight transportation in developing countries like Colombia. In these cases, the number of long tours is much less than in urban freight. This leads to a situation in which using trip-based distribution models is a reasonable decision.
In this section, a set of doubly-constrained gravity models are estimated for both commodity flows in tons, and loaded trips in vehicle units. These models account only for the loaded trips in the network. The models were estimated for six years (2000-2005) using a doubly constrained gravity model. Distance was used as the impedance variable because costs were not available for all the years. The distances were obtained based on the current road network in the country. Three different impedance functions were used: power, exponential, and gamma. The gamma function did not converge in all cases. The values of the parameters found are shown in Table 5.
Table 5. Parameters of the Impedance Functions (Distance)
Table 5 shows that, in general, the parameters of the models estimated using the commodity flows are lower than those from vehicle-trip models. As shown, the value of the parameters of the power function varies between 1.53 (2005) and 1.91 (2000) in the case of the loaded vehicle trips model; and varies between 0.95 (in 2005) and 1.27 (2000) in the case of commodity flows model. In the case of the exponential function, the parameters vary between 0.0020 (2005) and 0.0028 (2000) in the loaded vehicle trips model, and between 0.0010 (2005) and 0.0016 (2000) in the case of the commodity flows model.
The results show that the parameters of the impedance functions decline over time. It is worthy to note that since the analyses used distance as the impedance variable, the changes in the parameters are solely the product of changes in the demand (observations indicate no major change in congestion during the period of analysis). These results have a direct impact in terms of prediction capability as a model calibrated with data from the year 2000 will produce very different forecasts than a model calibrated in 2005, as the impedance effect did not remain constant.
However, the statistical tests of time dependence indicate a split situation. As shown, while the parameters of the models estimated using loaded vehicle trips were found to be time-dependent, the ones estimated with commodity flows were not. This obviously suggests a decoupling between vehicle-trips and commodity flows, which makes perfect sense because the commodity flows reflect the production-consumption patterns, while the vehicle trips are a reflection of the logistical decisions made by the freight carriers. Since the production-consumption patterns are much slower in changing than vehicle-trips, it should not be a surprised that one is stable while the other is not. The decrease in the value of the parameter indicates that travel impedance is less importance than before. To a certain extent, this result is not surprising as it is well known that economic globalization has led to increases in both the amount of freight transported, and the corresponding distance.
5. CONCLUSIONS
This paper presents empirical research on the temporal stability of the parameters of freight demand models in the short-medium term. The analyses are based on seven national freight origin-destination samples conducted by the Colombian government during the years 1999 to 2005. The paper presents a study of the stability of the parameters of freight generation and freight distribution models. Typical formulations of these models were calibrated using the cross-sectional data corresponding to each year. Then, to identify time-dependent effects, the resulting parameters were regressed as a function of a time index. The results indicate the presence of statistically significant time-dependent effects on all freight generation models (production and attraction), as well as on the freight distribution model estimated with loaded vehicle trips. In contrast, the parameters of the freight distribution models based on commodity flows were found to be stable over time. The reason may be related to the fact that the commodity flows reflect production-consumption patterns that are much slower to change over time than vehicle trips that are the result of short term logistic decisions on the part of the carriers.
The results indicate that the amount of cargo produced by a unit of GPD, and the amount of cargo attracted by a unit of population have increased over time. This seems to indicate a lowering of the unit value of the cargo transported in Colombia, and an increase in the amount of goods consumed by the citizenry. The decrease in the value of the parameters of the vehicle-trip distribution models indicates that travel impedance is less important than before. In contrast, the commodity flow distribution models were found to have stable parameters. This suggests that the difference is due to a change in the logistical patterns of the freight industry, as opposed to a change in the underlying demand. Faced with increasing customer demands, freight carriers are frequently pushed to provide faster service with lower payloads at longer distances. Such changes could explain the finding concerning the vehicle-trip distribution models.
Taken together, this research has provided a mixed bag of evidence concerning the validity of the parameter stability assumption. As discussed in the paper, the assumption was rejected in half of the cases (freight generation and vehicle-trip distribution models), and found to hold in the commodity flow distribution models. Such a result is befitting for such a complex and important topic as it leads to the obvious conclusion that still more research is needed to reach solid conclusions.
REFERENCES
[1] GUNN, H., M. BEN-AKIVA AND M. BRADLEY. "Test of the Scaling Approach to Transfering Disaggregate Travel Demand Models." Transportation Research Record(1037): 21-30. 1985.
[2] ORTÚZAR, J. D. AND L. G. Willumsen. Modelling Transport. New York, John Wiley and Sons. 2001.
[3] TRETVIK, T. AND S. WIDLERT (1998). The stability of parameter estimates in household-based structured logit models for travel-to-work decisions. Travel behavior research: Updating the state of play: 457-472.
[4] MCCARTHY, P. "Further evidence on the temporal stability of disaggregate travel demand models." Transport Research Part B: Methodological 16B(4): 263-278. 1982.
[5] ROBUSTÉ, F. "Network simulation, tolls and some conjectures on regional development: the case of Catalonia." Flux(17): 33-40. 1994.
[6] Institute of Transportation Engineers. Trip Generation, Institute of Transportation Engineers. Washington, D.C. 1991.
[7] Universidad Nacional de Colombia Sede Medellin, Universidad del Norte and Universidad Pedagógica y Tecnológica de Colombia. Desarrollar y poner en funcionamiento modelos de demanda y oferta de transporte, que permitan proponer opciones en materia de infraestructura, para aumentar la competitividad de los productos Colombianos. Ministerio de Transporte. 2008.
[8] DANE. Population and GDP data by regions for Colombia. 2009.
[9] U.S. Census Bureau. Vehicle Inventory and Use Survey. 2004.
[10] HOLGUÍN-VERAS, J. AND G. PATIL. "Observed Trip Chain Behavior of Commercial Vehicles." Transportation Research Record 1906: 74-80. 2005.
Cómo citar
IEEE
ACM
ACS
APA
ABNT
Chicago
Harvard
MLA
Turabian
Vancouver
Descargar cita
Visitas a la página del resumen del artículo
Descargas
Licencia
Derechos de autor 2011 DYNA

Esta obra está bajo una licencia internacional Creative Commons Atribución-NoComercial-SinDerivadas 4.0.
El autor o autores de un artículo aceptado para publicación en cualquiera de las revistas editadas por la facultad de Minas cederán la totalidad de los derechos patrimoniales a la Universidad Nacional de Colombia de manera gratuita, dentro de los cuáles se incluyen: el derecho a editar, publicar, reproducir y distribuir tanto en medios impresos como digitales, además de incluir en artículo en índices internacionales y/o bases de datos, de igual manera, se faculta a la editorial para utilizar las imágenes, tablas y/o cualquier material gráfico presentado en el artículo para el diseño de carátulas o posters de la misma revista.


