


Publicado
GRADE CONTROL IN A QUARTZ DEPOSIT USING UNIVERSAL FUZZY KRIGING
Palabras clave:
Universal kriging, fuzzy number, quartz quality, 3D model, selective mining (es)we develop a fuzzy universal kriging that we use to estimate quality classes for a quartz deposit. The method models the trend in the data
by linearly combining functions that depend on the coordinates for each point, which are fuzzy numbers. The spatial dependence between
the data is determined by means of non-fuzzy covariograms. The proposed method provides fuzzy numbers and non-fuzzy variances at
unsampled locations. Finally, the estimated fuzzy numbers are translated back into quartz qualities and graphically represented. From the
grade model obtained by using fuzzy kriging it has been possible to perform selective mining at the deposit depending on market demand
of the four products exploited.
GRADE CONTROL IN A QUARTZ DEPOSIT USING UNIVERSAL FUZZY KRIGING
CONTROL DE LA LEY EN UN DEPÓSITO DE CUARZO EMPLEANDO KRIGEADO DIFUSO UNIVERSAL
ÁNGELES SAAVEDRA GONZÁLEZ
Ph.D., Department of Statistics, University of Vigo, Spain, saavedra@uvigo.es
CELESTINO ORDÓÑEZ GALÁN
Ph.D., Department of Mining Exploitation and Prospecting, University of Oviedo, Spain, ordonezcelestino@uniovi.es
JAVIER TABOADA CASTRO
Ph.D., Department of Natural Resources, University of Vigo, Spain. jtaboada@uvigo.es
EDUARDO GIRÁLDEZ PÉREZ
Ph.D., Department of Natural Resources, University of Vigo, Spain, edugiraldez@gmail.com
CARLOS SIERRA FERNÁNDEZ
M.Sc., Environmental Biotechnology and Geochemistry Group, Universidad de Oviedo, Spain. sierracarlos@uniovi.es
Received for review July 26th, 2011, accepted November 6th, 2012, final version November, 15th, 2012
ABSTRACT: We adapt the universal kriging method of prediction to contexts with uncertainty and imprecise data. Using fuzzy set theory, we develop a fuzzy universal kriging that we use to estimate quality classes for a quartz deposit. The method models the trend in the data by linearly combining functions that depend on the coordinates for each point, which are fuzzy numbers. The spatial dependence between the data is determined by means of non-fuzzy covariograms. The proposed method provides fuzzy numbers and non-fuzzy variances at unsampled locations. Finally, the estimated fuzzy numbers are translated back into quartz qualities and graphically represented. From the grade model obtained by using fuzzy kriging it has been possible to perform selective mining at the deposit depending on market demand of the four products exploited.
KEYWORDS: Universal kriging, fuzzy number, quartz quality, 3D model, selective mining
RESUMEN: Adaptamos el método universal de predicción por Krigeado a contextos con datos inciertos o imprecisos. Empleando la teoría de conjuntos difusos, desarrollamos un Krigeado difuso universal que utilizamos para estimar tipos de calidades en un depósito de cuarzo. El método modela la tendencia de los datos por combinación lineal de funciones que dependen de las coordenadas de cada punto, que son números fuzzy. La dependencia espacial entre los datos es determinada por medio de covariogramas no difusos. El método propuesto proporciona números difusos y varianzas no difusas en puntos no muestreados. Finalmente, los números difusos estimados son convertidos en calidades de cuarzo y representados gráficamente. Por medio del modelo obtenido empleando números difusos ha sido posible efectuar minería selectiva del depósito mineral dependiendo de la demanda del mercado para los tres productos explotados.
PALABRAS CLAVE: Krigeado universal, número difuso, calidad del cuarzo, modelo 3D, minería selectiva
1. INTRODUCTION
Spatially distributed phenomena are frequently found in various settings, including mining, the environment, the economy and medicine. Often, the aim is to predict a value in a location where the spatial phenomenon has not been observed. The most typical approach is for the data to be sampled over some kind of spatial grid mesh. This means that, almost always, the spatial phenomenon is measured just once, instead of the many repeated measurements that are typical in other experimental sciences.
The definition of some variables, such as quartz qualities in a block for our particular study case, frequently produce a certain degree of uncertainty in regard to observed data that cannot be associated with a probability. Transition between classes for those variables is not sharp and therefore traditional prediction techniques cannot exploit information of this type. However, fuzzy set theory, developed by Zadeh [1], can be used to quantify this type of imprecision and other mathematical problems [2]. Thus, using fuzzy set theory for several components in the mathematical model might reflect the associated uncertainty. This article considers the problem of predicting a fuzzy random spatial function  which takes values that are triangular fuzzy numbers. Predictions in new locations
  will also be fuzzy numbers.
2. MATHEMATICAL PREAMBLE: FUZZY RANDOM VARIABLES
A fuzzy number  is defined as a fuzzy set with the membership function
  satisfying three conditions:
a)  is normal, i.e.,
  such that
  .
.
b)  is convex, i.e., all its
  cuts
cuts  are real closed intervals.
c) The support for , given by
 , is bounded.
From this point on, we restrict ourselves to fuzzy numbers with a triangular membership function, or triangular fuzzy numbers. A fuzzy number with a triangular membership function  is fully determined by three real numbers:
  . These numbers are the modal values
  such that
  , with the values
  (right vertex) and
  (left vertex) delimiting the support of the fuzzy number.
As with the set of real numbers, a metric  can be defined for the set of triangular fuzzy numbers,
 , giving rise to a complete metric space
  :
:

This metric induces a topology and a Borel s-algebra with which to construct a probability space [2].
Given a domain  and an arbitrary but fixed location
 , a triangular fuzzy random variable
  is defined as a Borel measurable function that assigns triangular fuzzy numbers to the elements
 :
:

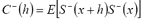
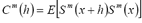
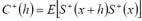
Following Aumann [3], the expected value of a random variable can be generalized to the case of fuzzy random variables. In particular, given a triangular fuzzy random variable , it can be proved that its expected value
  is also a triangular fuzzy number, determined by:
 Unlike the expected value, the variance of fuzzy random variables is a real non-negative number:
 Let
Let  be a spatial triangular fuzzy random function.
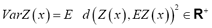
  is said to be second-order stationary if: i)
  exists and is independent of
  ; and ii) there exist three covariance functions
  ,
,  ,
,  independent of
  , such that:
3. FUZZY KRIGING
In this article, we examine the problem of spatial estimation for the most general case, i.e., the case referred to as estimation by means of universal kriging. The typical approach leads us to express the spatial function of interest as:
 ,
, 
where  and
and  are triangular fuzzy random functions and
  is a trend function that assigns a triangular fuzzy number to the elements in the domain
  :
:
According to the classification by Bardossy et al. [4], this is a case of fuzzy kriging type 1. The results of the predictions will also be triangular fuzzy numbers; however, given that non-fuzzy semivariograms are used, non-fuzzy kriging prediction variances can be calculated. This problem is tackled from a Bayesian perspective by Bandemer and Gebhardt [5].
4. UNIVERSAL FUZZY KRIGING
We assume that the trend function  can be expressed as a linear combination of known regressor functions
  and unknown fuzzy coefficients
 . Applying the Zadeh extension principle, we have: (1)
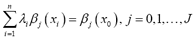
A typical hypothesis is to assume that  to ensure that the case of the constant mean, i.e., the ordinary kriging approach, is included in the model. Furthermore, for the relationship given in (1) to be coherent with the definition of a triangular fuzzy number, it is necessary for
  . Note that negative values for
  could lead to
  for some
 . This condition is not very restrictive if we bear in mind that these functions tend to be fixed by the user and that the coordinates
 can always be expressed as positive values.
We also assume that the fuzzy function  is second-order stationary.
Given a set  of values
  observed at the locations
 , we wish to predict the value
  for the variable
 . The linear kriging predictor takes the form
 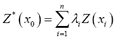 , with the weights
  estimated in such a way that this predictor is non-biased and minimizes the prediction variance
 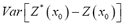 under certain conditions.
The non-bias condition is equivalent to 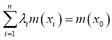 ; in other words:
This is guaranteed to be satisfied if we require the set of weights to verify the restrictions as follows:
 (2)
(2)
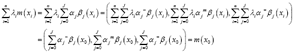
Using (2), it is very easy to verify that:
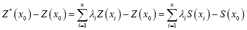
And so the prediction variance can be expressed as: 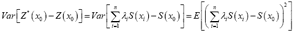 Assuming that the fuzzy spatial random variable is second-order stationary, the weights should satisfy:
 (3)
(3)
Following reasoning similar to that described by Diamond [6], it can be verified that:
 (4)
(4)
where
 ,
,  ,
, 
and  The set of weights
  that minimizes the prediction variance (4), subject to restrictions (2) and (3), can be posed as a problem of minimization with restrictions: (5)
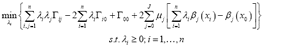
where  are Lagrange multipliers.
Fortunately, the problem of minimization with restrictions has been widely studied (see, for example, Wismer and Chattergy, [7]). In this case, the problem of minimization with restrictions was solved by applying results from the Kuhn-Tucker theorem [8]. Thus, combining an optimization methodology with classical kriging prediction theory, we can state that if the matrix formed of the elements  is strictly positive-definite, then the solution to (5) is the set of weights that satisfy the following system of equations:
(6)where, again,  are Lagrange multipliers.
The prediction variance for universal kriging is given by:
 (7)
(7)
Note that both the set of weights and the prediction variance are real and not fuzzy numbers.
Note also that in the particular case in which , results are obtained that are identical to those published by Diamond [6] for the case of ordinary kriging prediction for triangular fuzzy spatial random functions.
5. CHARACTERISTICS OF THE DEPOSIT AND QUARTZ VEIN MODEL CONSTRUCTION
The quartz deposit is located near the town of Vedra in the province of A Coruña (Northwestern Spain).The different qualities and, consequently, uses for quartz are a consequence of its aluminum content. Lower percentages of aluminum fetch greater prices for the material. Field data consists of 29 profiles obtained through sampling and fieldwork conducted in 2000 and 2003. A total of 57 boreholes were made in 2000 and data was also obtained following 200 blasting operations that produced further study material. In 2003, another 23 boreholes were surveyed, and again, further information was obtained following 236 blasting operations. Note that the data obtained from blastholes is not as precise as the data obtained from boreholes, given that the material resulting from blasting is highly dispersed.
The information was represented in a series of 29 profiles-each representing a specific depth-graphically represented in a CAD application. The modeled volume was bounded by a closed surface that joined the perimeters of the profiles, resulting in a 3D model of the vein of quartz. This volume was divided into cubes measuring 10 x 10 x 10 m3, representing the support of the data in our research. Bench height was 10 m. The input data for the statistical study was represented by a total of 7,543 blocks. For each block, a percentage of mineral representing each quality was assigned in accordance with the profiles found. This was done graphically by determining the intersection between blocks and profiles. Then, the percentage of quartz of each quality at the intersections was assigned to the corresponding block.
6. CONSTRUCTION OF FUZZY NUMBERS AND COVARIOGRAMS
The suitability of fuzzy kriging for the study of our quartz deposit is based primarily on the uncertainty implicit in the definition of the quality classes, making it impossible to clearly define precise boundaries between each class. Quality classification of a given specific block is difficult to implement with strict precision or accuracy, which means that a certain degree of uncertainty is associated with the task of establishing classes. This uncertainty may arise from the fact that it is sometimes difficult to characterize a block as a whole (e.g., not all its fronts may be accessible), or because of the application of different criteria by the persons collecting the data. Also, such large blocks are rarely homogeneous and several different qualities may exist in a single block (this is a common situation when estimating large blocks) [9].
Each input cell was assigned a fuzzy number representing the quality of the block. The base of the triangle for each block of a known quality was constructed from an X-axis that numerically represented the pre-defined commercial quality classes. Blocks representing a single quality were assigned a triangular function with a vertex centered in the quality value and with a base of 2 (Figure 1).
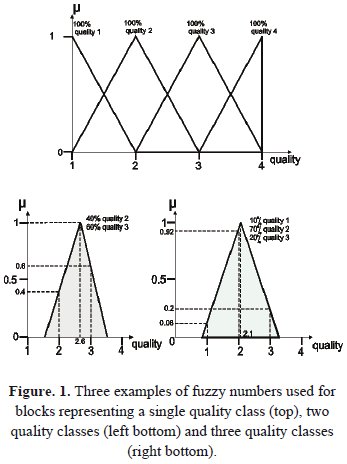
For a block with two quality classes, the triangle was created from two lines drawn from the vertex and passing through points corresponding to the two quality percentages. Finally, for blocks representing three or four qualities, the vertex was located at the point corresponding to the mean quality and the triangle was created by drawing two lines from this point and passing through points corresponding to the two quality percentages.
In this case, it was necessary to partially modify the percentages for each quality to ensure that they add up to 100%-representing a source of error in addition to that inherent in the definition of the classes. Figure 1 depicts triangles corresponding to blocks containing one, two or three mineral qualities. Further details of constructing triangular fuzzy numbers can be found in Taboada et al. [9]. Figure 2 shows the location of input data within a certain area with a constant Z-coordinate of 205 meters.
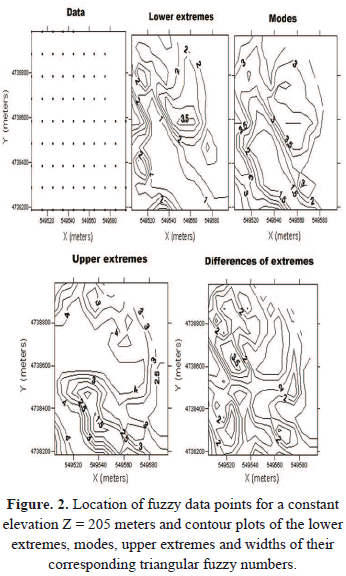
A triangular fuzzy number has been associated with each point, and contour plots of the lower extremes, modes and upper extremes of these vertexes are included in the figure. In addition, the contour plot of the difference between the lower and upper extremes (width of the triangle) gives an idea of the degree of uncertainty in the area.
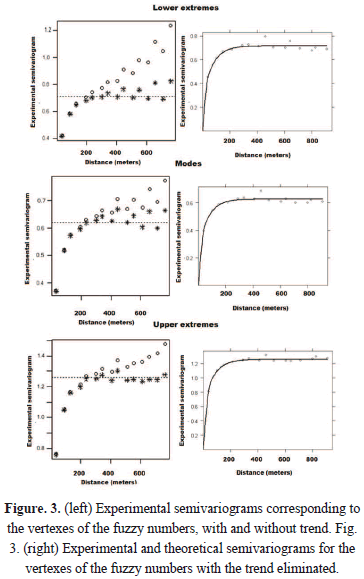
The 7,543 triangular fuzzy numbers represent the set of input data for the kriging estimation. In accordance with the methodology described in the previous section, three experimental non fuzzy semivariograms were fitted to the triangles: one to the lower extremes, another to the modes and a third to the upper extremes. The parametric model that best captures the spatial dependency is a nested spherical and exponential model. Both types of semivariogram are transitive models, which indicates that, at a certain distance or asymptotically, when  , the data are non-correlated. This type of function can be expressed in the form
  , with
  as the semivariogram function and
  as a partial sill. In addition, for the spherical model,
  with
with  and for the exponential model,
  , with
  as the parameter directly associated with the range of the spatial dependency.
Figure 3 (left) depicts the experimental semivariograms corresponding to the lower extremes, modes and upper extremes, with and without trends. The circles were calculated under the hypothesis that the trend function is constant, i.e.,  . It can be observed that the experimental function does not tend to stabilize as the distance
  between locations increases-which can be interpreted as an indication that the initial hypothesis of a constant trend may be false. Considering
With regressor functions:

the semivariograms have to be fitted in an iterative algorithm. Figure 3 (right) depicts the experimental and theoretical semivariograms corresponding to the lower extremes, modes and upper extremes. It can be observed that the semivariogram tends to stabilize at a specific distance-indicating the appropriateness of the regressor functions and the subsequent application of universal kriging.
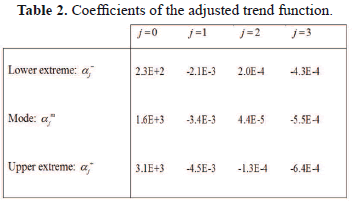
The parameters for each of the fitted semivariograms, or equivalently the corresponding covariograms, are shown in Table 1, while Table 2 summarizes the coefficients of the adjusted trend function.
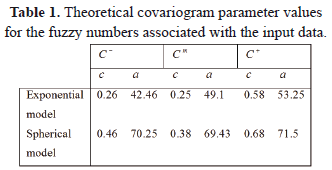
The different values of sills shown in Table 1 are related to the different values of variance of the lower extremes, modes and upper extremes. The modes of the triangular fuzzy number are calculated as averages of the different qualities, which explains why the sill of  is lower than the others. On the other hand, the way in which the lower and upper extremes are calculated implies a significant increase in the variability of these vertexes. This fact is shown in the higher sills of covariograms
  and
and  .
.
7. ESTIMATING QUARTZ RESERVES
For a new location of interest,  , predictor kriging,
  , is calculated as a linear combination of the fuzzy data around
  :
:
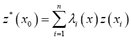
where the weights,  , are obtained by resolving a universal kriging system. These systems of equations were programmed using the open-source package GSLIB (see Deutsch and Journel [10]). Resolving these systems also results in the prediction variance, as expressed in (7).
The set of universal kriging predictions is made up of triangular fuzzy numbers, whose translation to percentages is done similarly to the construction of the input data, but in the inverse direction. Of the predictions obtained, any that fell outside the deposit were excluded, that is, the blocks outside the boundary of the deposit are excluded from the calculations, leaving a total of 254,681 fuzzy numbers. Figure 4 summarizes the predictions obtained for the bounded area with constant coordinate Z = 205, also used in Figure 2.

The complete kriging results are represented graphically on the quartz vein using grayscale intensities (Figure 5).

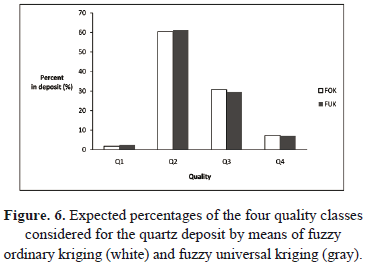
In this graph, the block is assigned the quality that is most representative. Figure 6 summarizes the expected percentages of each of the four qualities obtained by using universal fuzzy kriging and ordinary kriging methods.
The proposed prediction method was validated using a cross-validation procedure. Thus, each item  is removed from the original sample set and the estimated quality percentages are obtained from the remaining sample data.
In addition, the estimated quality percentages,  ,
,  ,
,  , and
, and  were obtained from the predictions. The squared error for each quality,
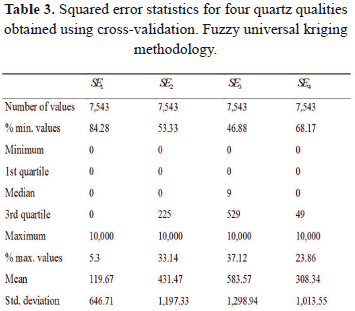
  , is an indication of the efficacy of the prediction method. Table 3 shows descriptive coefficients calculated for the squared prediction errors resulting from the cross-validation. The squared error for each quality can vary between 0 and 10,000, given that qualities range between 0 and 100.
To verify the suitability of the universal fuzzy kriging methodology, a fuzzy ordinary kriging was also carried out. Table 4 shows some descriptive coefficients for the squared prediction errors from the cross-validation under the hypothesis of constant mean.
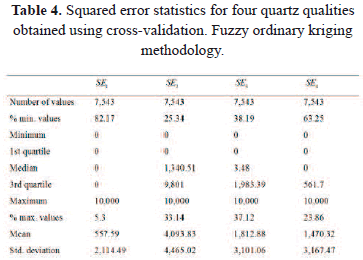
From the comparison with table 3, we can easily conclude that fuzzy universal kriging provides a better estimation than fuzzy ordinary kriging (mean squared errors and their standard deviations are lower for the first method).
8. CONCLUSIONS
The method developed here enables uncertainty to be taken into account in the definition of quartz quality classes by transforming the data into triangular fuzzy numbers. An innovation compared to previous research is the modeling of the trend in the data by using a linear combination of functions of the coordinates with fuzzy coefficients. The method produces a fuzzy number representing quality for each block and also a non-fuzzy number representing variance. To assist with interpretation of the results, the estimated values can be re-translated into qualities for each block.
Comparing the results with those obtained by using ordinary fuzzy kriging it can be seen that modeling the trend in the data improve the results, since estimation errors were reduced.
Finally, being able to view the spatial distribution of quality in the quartz vein is an important element for engineers in charge of planning mining operations. For this reason, a 3D model of the quartz vein was constructed, with colors or grayscale intensities assigned to each block to reflect the percentages of each quality. In addition, the association of the centroid of each cube with a database containing the estimated qualities means that users can automatically retrieve qualities for each block. This model is used to perform selective mining in order to obtain, at any time, the mining products of interest considering market fluctuations.
ACKNOWLEDGEMENTS
This research has been partially supported by Grant MTM2008-03129 of the Spanish Ministerio de Ciencia e Innovación.
REFERENCES
[1] Zadeh, L.A., Fuzzy set. Information and Control, 8, pp. 338-353, 1965.
[2] Schiassi, L.,Yanagi, T., Damasceno, P.A., Osorio,J.A. and Machado, N.S., Fuzzy modeling applied to the welfare of poultry farms workers. Dyna, 174, pp. 127-135, 2012.
[3] Aaumann, R.J., Integrals of set-valued functions J. Math. Anal Appl., 12, pp. 1-12, 1965.
[4] Bardossy, A., Bogardi, I. and Kelly, W., Geostatistics utilizing imprecise (fuzzy) information: Fuzzy Sets and Systems, 31, pp 311-327,1989.
[5] Bandemer, H. and Gebhardt, A., Bayesian Fuzzy Kriging. Fuzzy sets and systems, 112 pp. 405-418, 2000.
[6] Diamond, P., Fuzzy kriging, Fuzzy Sets and Systems, 33 pp. 315-332,1989.
[7] Wismer, D.A. and Chattergy, R., Introduction to nonlinear optimization. A problem solving approach. Elsevier North-Holland, Amsterdam,1987.
[8] Kuhn, H.W. and Tucker, A.W., Nonlinear programming. In: Proceedings of 2nd Berkeley Symposium, Nonlinear programming, University of California Press, Berkeley, 1951.
[9] Taboada, J., Rivas, T., Saavedra, A, Ordóñez, C., Bastante, F. and Giráldez, E., Evaluation of the reserve of a granite deposit by fuzzy kriging. Engineering Geology, 99, pp. 23-30, 2008.
[10] Deutsch, C.V., Journel, A.G., GSLIB: geostatistical software library and user's guide. Oxford University Press, New York, 1989.
Cómo citar
IEEE
ACM
ACS
APA
ABNT
Chicago
Harvard
MLA
Turabian
Vancouver
Descargar cita
Visitas a la página del resumen del artículo
Descargas
Licencia
Derechos de autor 2013 DYNA

Esta obra está bajo una licencia internacional Creative Commons Atribución-NoComercial-SinDerivadas 4.0.
El autor o autores de un artículo aceptado para publicación en cualquiera de las revistas editadas por la facultad de Minas cederán la totalidad de los derechos patrimoniales a la Universidad Nacional de Colombia de manera gratuita, dentro de los cuáles se incluyen: el derecho a editar, publicar, reproducir y distribuir tanto en medios impresos como digitales, además de incluir en artículo en índices internacionales y/o bases de datos, de igual manera, se faculta a la editorial para utilizar las imágenes, tablas y/o cualquier material gráfico presentado en el artículo para el diseño de carátulas o posters de la misma revista.


