Published
Analysis of aeromagnetic data for interpretation of seismicity at Fayoum-Cairo area, Egypt
DOI:
https://doi.org/10.15446/esrj.v18n1.36938Keywords:
Seismicity, aeromagnetic data, structural trends, Fayoum-Cairo, Egypt (en)An aeromagnetic reconnaissance study is presented to delineate the subsurface structure and tectonic setting at the Fayoum-Cairo district, which experienced a damaging earthquake on October 12, 1992 of magnitude (M = 5.7). Analysis of aeromagnetic and seismicity data demonstrate three significant tectonic faults with trending to the NE-SW, NW-SE and E-W. The basement is uplifted in the northern and central parts with a depth of 1.3 km, and deepening in the southern part with a depth of 2.5 km. This is a seismically active zone and historically has experienced damaging earthquakes. In 1847, a damaging earthquake with maximum epicentral intensity (Modified Mercalli Intensity (MMI) = VII) was located there. On the eastern side, earthquake sources are well recognized at different locations. These sources created events of moderate size magnitude M < 5. The focal mechanisms of the major events from these sources are generally strike-slip with normal component. The focal mechanism of the earthquake on October 12, 1992 is normal fault type with strike trends in the NW-SE direction. These fault plane solutions are consistent with the tectonic trends derived from the aeromagnetic data mentioned above and suggest that the new tectonics of northeast Africa is predominant.
Resumen
Este estudio presenta una exploración aeromagnética para delimitar la estructura subsuperficial y el marco tectónico del distrito de Fayoum-Cairo, que sufrió un terremoto el 12 de octubre de 1992 de magnitud M=5.7. Los análisis de datos sismicidad y aeromagnéticos señalan tres fallas tectónicas significativas con tendencias NE-SO, NO-SE y E-O. El subsuelo se elevó en el norte y en el centro a una profundidad de 1,3 kilómetros, y se hundió en el sur con una profundidad de 2,5 kilómetros. Esta es una zona sísmicamente activa que en su historia ha tenido terremotos dañinos. En 1847 tuvo lugar un terremoto con intensidad epicentral máxima (escala sismológica de Mercalli) de VII. En el lado este se estudiaron las fuentes de terremotos en diferentes partes. Estas fuentes crearon eventos de magnitud moderada M<5. Los mecanismos focales de los eventos principales en estas fuentes son generalmente fallas de desgarre con componente normal. El mecanismo focal del terremoto del 12 de octubre de 1992 es una falla tipo normal con fuertes movimientos NO-SE. Las soluciones de estas fallas son consistentes con las tendencias tectónicas de los datos aeromagnéticos antes mencionados y sugieren que la nueva tectónica del noreste de África es predominante.
ELECTRICAL AND MAGNETIC METHODS
Analysis of aeromagnetic data for interpretation of seismicity at Fayoum-Cairo area, Egypt
Ahmed Khalil 1,2, Mostafa Toni3, Awad Hassoup1 and Khamis Mansour1,2
1. National Research Institute of Astronomy and Geophysics, Helwan, Egypt
2. Laboratory of Exploration Geophysics, Earth Resource Engineering Department, Faculty of Engineering, Kyushu University, Fukuoka, Japan
3. Geology Dept., Faculty of Science, Helwan University, Cairo, Egypt
Record
Manuscript received: 30/01/2013 Accepted for publication: 23/05/2014
Abstract
An aeromagnetic reconnaissance study is presented to delineate the subsurface structure and tectonic setting at the Fayoum-Cairo district, which experienced a damaging earthquake on October 12, 1992 of magnitude (M = 5.7). Analysis of aeromagnetic and seismicity data demonstrate three significant tectonic faults with trending to the NE-SW, NW-SE and E-W. The basement is uplifted in the northern and central parts with a depth of 1.3 km, and deepening in the southern part with a depth of 2.5 km. This is a seismically active zone and historically has experienced damaging earthquakes. In 1847, a damaging earthquake with maximum epicentral intensity (Modified Mercalli Intensity (MMI) = VII) was located there. On the eastern side, earthquake sources are well recognized at different locations. These sources created events of moderate size magnitude M < 5. The focal mechanisms of the major events from these sources are generally strike-slip with normal component. The focal mechanism of the earthquake on October 12, 1992 is normal fault type with strike trends in the NW-SE direction. These fault plane solutions are consistent with the tectonic trends derived from the aeromagnetic data mentioned above and suggest that the new tectonics of northeast Africa is predominant.
Keywords: Seismicity, aeromagnetic data, structural trends, Fayoum-Cairo, Egypt
Resumen
Este estudio presenta una exploración aeromagnética para delimitar la estructura subsuperficial y el marco tectónico del distrito de Fayoum-Cairo, que sufrió un terremoto el 12 de octubre de 1992 de magnitud M=5.7. Los análisis de datos sismicidad y aeromagnéticos señalan tres fallas tectónicas significativas con tendencias NE-SO, NO-SE y E-O. El subsuelo se elevó en el norte y en el centro a una profundidad de 1,3 kilómetros, y se hundió en el sur con una profundidad de 2,5 kilómetros. Esta es una zona sísmicamente activa que en su historia ha tenido terremotos dañinos. En 1847 tuvo lugar un terremoto con intensidad epicentral máxima (escala sismológica de Mercalli) de VII. En el lado este se estudiaron las fuentes de terremotos en diferentes partes. Estas fuentes crearon eventos de magnitud moderada M<5. Los mecanismos focales de los eventos principales en estas fuentes son generalmente fallas de desgarre con componente normal. El mecanismo focal del terremoto del 12 de octubre de 1992 es una falla tipo normal con fuertes movimientos NO-SE. Las soluciones de estas fallas son consistentes con las tendencias tectónicas de los datos aeromagnéticos antes mencionados y sugieren que la nueva tectónica del noreste de África es predominante.
Palabras clave: Sismicidad, datos aeromagnéticos, tendencias estructurales, Fayum-El Cairo, Egipto.
Introduction
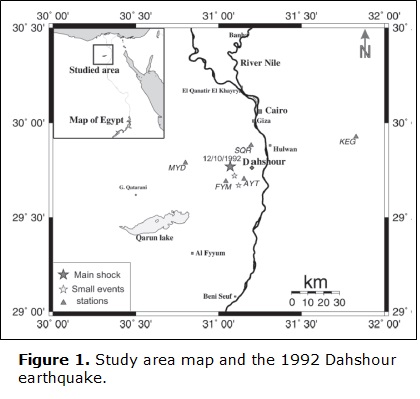
Studying the structure of Fayoum-Cairo area has become significant as the basement and its fraction played the main role in the seismic activity constructing the geological framework of southern Egypt. The magnetic method is believed to be efficient in this respect (Hassoup, et al., 2009), so the magnetic exploration has been preformed aiming to find out the subsurface structures set up at the Dahshour area. This area lies between the Latitudes 28°8 and 30°00 N and Longitudes 30° 4 and 32° 00 E in Egypt (Fig. 1). It is generally characterized by surface sedimentary rocks that can physiographically be divided into three main units: the Qarun lake, the plains of ancient terraces, and the plateau surface with irregular scarped faces. The Qarun-lake and its surrounding cultivated lands cover the major part of the Fayoum depression. There exist beach terraces of different levels and widths around the Qarun-lake which extend till the scarpment of Qattrani hill (353 m). This area is structurally controlled by a set of normal faults having long periods of growth and some of these faults manifest strike-slip movements. Deep drilling in the northern part of the Western Desert has exhibited large numbers of swells and basins (Said, 1990).
Meshref (1990) states that the basement rocks in the Western Desert of Egypt have been affected by the oldest E-W and ENE trending faults which in turn intersect with the younger NW and NNW trending faults. These two fault systems have large vertical and horizontal displacements. The Dahshour-Qattrani area is particularly affected by the NW and E-W-trending faults. The NW-trending fault, called the Qattrani fault, has a throw of about 350 m. However, the E-W trending fault, called the G. Sheeb fault, has a throw between 150 and 200 m. The Oligocene basalt occupies these two faults.
On the basis of geophysical data (i.e., seismic and gravity data), Abu El-Ata (1990), outlined three structural heights and two low:
1- The Abu Roash high that strikes in the N-NE-S-SW and E-NE-W-SW directions.
2- El-Sagha height which is oriented into NW-SE directions.
3- The El-Faras-El-Fayoum height, which is oriented in E-NE-W-SW and N-NW-S-SW directions.
Ghazala (2001) concluded that four significant tectonic zones characterize this area: the graben of Nile Valley, the uplift at the East Nile Valley, the Ginidi basin and the Kattaniya uplift. The study of the subsurface structure of the Fayoum-Cairo area is significant to understand relationship between the basement, its fraction and seismic activities at the area.
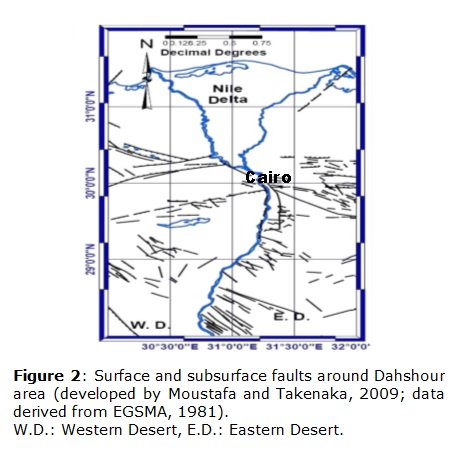
The Dahshour area is highly deformed with fault systems into different directions (Said 1990). The most predominant trend is the NW-SE followed by the E-W trend. According to (Naim, et al., 1993), the area is mainly affected by the NW-SE fault trend in the Gulf of Suez represented by the Qattrani fault of normal type, and the Mediterranean E-W trend represented by the Gabal El-Sheeb fault (Fig. 2).
Seismicity
The area under investigation experienced a moderate sized earthquake on August 7, 1847 (Fayoum earthquake) with epicentral intensity MMI = VII (Maamoun et al., 1984). On the basis of instrumental records, this area is characterized by moderate seismicity of M < 6 (Fig. 3A). Earthquakes are distributed in a large area, which extends from Dahshour (on the western side of the River Nile to the Red Sea area and the large-magnitude recurrence is quite big (Maamoun et al., 1984; Abou Elenean, 1997). The earthquakes distribution was developed on the basis of records of Helwan observatory (1900~1997) and the recent established Egyptian National Seismological Network (ENSN) from 1997 to 2012.

The fault plane solution of the 1992 earthquake main shock and spatial distribution of its aftershocks imply that this event is characterized by normal faulting with a slight strike -slip component (El-Hadidy, 1993; Hussein et al., 1998). Abou Elenean (1997), using the epicentral distribution, seismicity level, and the similarity of focal mechanisms, considered the area of Dahshour as a seismogenic zone. Tectonically, the faults of this area tend into E-W, parallel to the Mediterranean trend, or N-S parallel to the Gulf of Suez trend. The NW-SE and E-W directions correspond with the surface features, which appeared immediately after the occurrence of 1992 earthquake (Japanese Expert Team, 1993). The majority of earthquakes occurred along the well-defined surface faults with E-W to W-NW orientation as shown in (Fig. 2). The epicenters and focal mechanisms of the earthquake on October 12, 1992and three other events recently occurred around the area, are shown in (Fig. 3B). Three of these seismic events (June 29, 2000, Local magnitude scale (M L) = 4; July 07, 2005, ML = 4.2; and October 30, 2007, ML = 3.7) occurred at the east of the Dahshour area inside the Suez-Cairo shear zone (Abou Elenean et al., 2009). Focal mechanisms of all these events are normal faults with strike-slip movements.
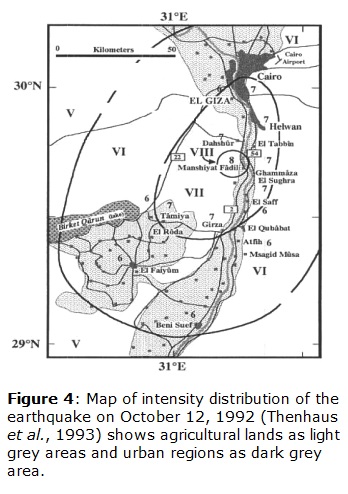
The earthquake on October 12, 1992 (Body wave magnitude (Mb) =5.8, epicentral intensity MMI = VIII), occurred in Dahshour. It caused tremendous damage performing major disaster in the Nile Delta area. It was noticed in all over Egypt, from Alexandria to Aswan, and even in some parts of surrounding countries (Hussein et. al., 1996; Abd El-Aziz, 2008). The intensity distribution map of this event, according to the Modified Mercalli Intensity scale (MMI), is shown in (Fig. 4); intensity was estimated (MMI = VI-VII) in Cairo, Giza, and Fayoum, where maximum level of damage was reported.
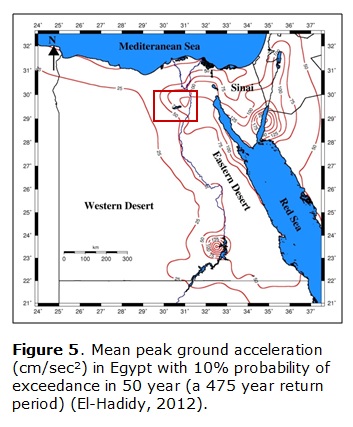
The report of Japanese Expert Team, (1993) estimated that about 8300 dwellings were destroyed, 561 people were killed and 6500 were injured; an official investigation revealed (Japanese Expert Team, 1993) that 1343 schools were damaged beyond any repair, 2544 had required major repair and had required repair or maintenance; the economic losses caused by this earthquake were estimated at more than US$ 35 million dollars. The earthquake shaking caused liquefaction of the Nile deposits at many sites near the epicenter ( Khater, 1992; Thenhaus et al., 1993). Recent estimations of seismic hazard (Riad et al., 2000; Moharram et al., 2008; El-Hadidy, 2012) show that for 10% probability of exceedence in 50 years (a return period of 475 years), thus the area of study is characterized by moderate level of seismic hazard (PGA=50-100 cm/s2) (Fig. 5).
Aeromagnetic data
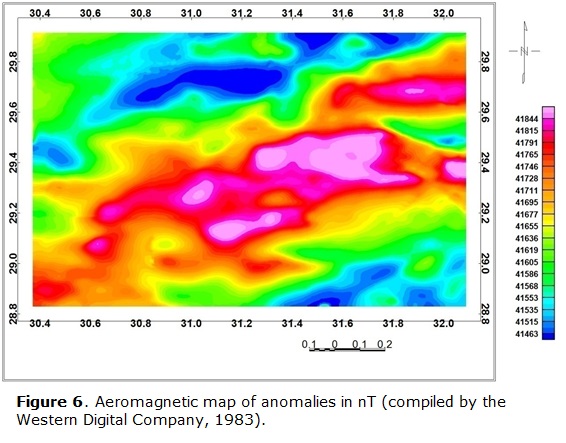
Generally, the qualitative interpretation for the magnetic maps, aims to get a clear view of the subsurface structures and an estimation of the relative depth of magnetic anomalies sources. It deals with the description of anomalies, especially their symmetry, strike, extension, width, amplitude and gradients (Nettelton, 1976). The aeromagnetic data is provided by the Western Digital Company (1983). These data were corrected prior to our working with them. Different processing methods are applied to the aeromagnetic data. The processing in this study was preliminary carried out by reduction of the magnetic northern pole (RTP), in order to overcome the undesired distortion of the shapes, sizes and locations of the magnetic anomalies; an average magnetic inclination of 41° was used for the area, to eliminate the obliquity of the inclination of the earth's magnetic field. The filters technique (regional, residual and band pass filters) were used in the interpretation and delineation of shallow and deep subsurface structures of the studied area. The quantitative interpretation has been used to determine the depths of shallow subsurface structures (faults and dykes), basaltic intrusions, as well as the basement complex of the considered area; the radially averaged power spectrum is the used method for interpretations. The analysis and processing of the aeromagnetic data were done through specialized computer program Geosoft: Oasis Montaj version 6.4.2, (Geosoft, 2007).
The aeromagnetic map of total intensity (Fig. 6) exhibits some positive (red colored) and negative (blue colored) anomalies, and reveals a prominent positive feature, as a circular shape, located at the center of the map area. This anomaly of major positive amplitude is called Agnes (red colored); the north part of the map is occupied by a magnetic belt majorly positive, divided into two positive closures and some positive small noises. The first anomaly tends nearly into the NE-SW with maximum positive amplitude at the northwestern corner; the second one is irregularly shaped at the northeastern part, with maximum positive amplitude of Moderate positive anomalies are included between the foregoing positive closures, especially around Agnes anomaly; however, the southern part of the map area reveals major negative magnetic belts. The first one is nearly a NE-SW negative magnetic anomaly extending from the southeastern to the southwestern of the map (blue colored); this negative belt exhibits more than six local closures with negative amplitudes and these anomalies also demonstrated condensed noise in their contour lines. The southwestern corner of this belt is occupied by an elongated negative closure with low frequency and low amplitude (blue colored); moreover, the NW-SE moderately positive magnetic belt, lies between the two negative anomalies and the moderately steep magnetic gradient delimits the previous southern negative magnetic belt and the northern positive magnetic belt.
Aeromagnetic data processing
Reduction to the magnetic north pole.
A reduction-to-the pole (RTP) transformation is typically applied to the magnetic data of total intensity to minimize the polarity effects (Blakely, 1996). RTP is a filtering technique used to align the peaks and gradients of magnetic anomalies directly over their sources. In this study, the aeromagnetic anomaly data about total intensity reduce the magnetic pole (RTP) (Fig. 7) through Geosoft: Oasis Montaj version 6.4.2 (Geosoft, 2007). This map (Fig.7) reflects the northward shift in the positions of the inherited magnetic anomalies, due to the elimination of the inclination and their declination of the magnetic field at this area; likewise, the sizes of the anomalies become larger and centered to some extent, over their respective causative bodies. In addition, the magnetic gradients became more intensive and steep, as well as the anomalies reliefs increase, giving rise to a higher resolution in the lithologic and structural inferences encountered.

Several zones with high and low magnetic values are present; the magnetic highs are separated from magnetic lows by steep gradients. The elongations of magnetic contour lines and their gradients at center of the area indicate that it is structurally-controlled by faults having major axes in NW-SE and E-W directions. The high magnetic anomalies in the northwestern side can be attributed to the occurrence of basic intrusions of the subsurface with high magnetic contents; the axes of the fault as well as the directions of magnetic anomalies are trend to the NW-SE and NE-SW in the northwestern, central and the southern parts. A further research of the RTP aeromagnetic map (Fig. 7) includes several local anomalies in the central, southwestern and northeastern parts; these anomalies have different reliefs, polarities and shapes. The general magnetic trends of these regions are almost NW-SE, NE-SW and E-W.
Digital filtering
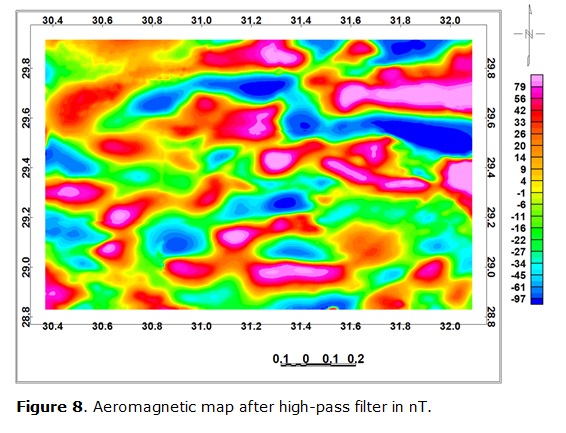
Frequency filtering represents a major component of magnetic data processing. As a rule, digital filters are used for signal enhancement that is to remove unwanted noises and enhance desired signals. The nature of "noises" and "signals" varies from case to case. The filtering technique in this study was performed using a cut-off frequency that ranges between 0.08 cycle/ unit data and 2.0 cycle/ unit data. The map after high-pass filtered (Fig. 8) elucidates high-frequency and short-wavelength spot-like magnetic anomalies, which are inferred as residual components. The map (residual) with high-pass component clearly shows several clusters of positive and negative magnetic anomalies, with higher resolution than those on RTP map. The local variations in both frequency and amplitude of these anomalies may be due to the difference in their compositions and/or the relative depths of their sources. The major trends (E-W, NW-SE, N-NW-SSE and NE-SW) are distinguished for the near-surface structures. This indicates that the trend of prominent faults (the trend on the RTP aeromagnetic map) extended in the subsurface up to shallow depths. Moreover, the random orientation of small scale anomalies reflecting that the shallow subsurface has been affected by different stress regimes of the neo-tectonics that may have not affected deep – seated rocks.
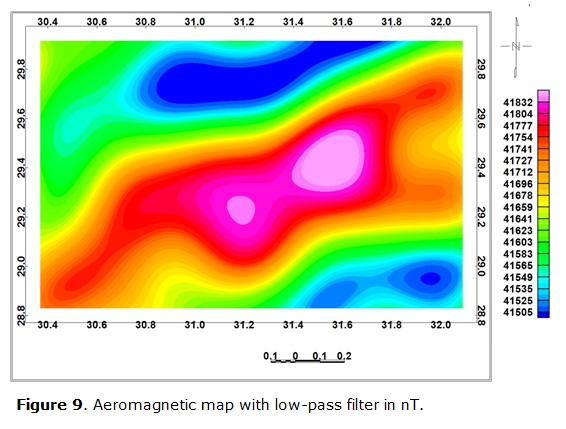
The anomaly map with low-pass magnetic filter (Fig. 9) shows a pattern of gradual rotation of magnetic trends from NE-SW and NW-SE towards E-W trend. The low-pass filtered anomalies give view about the subsurface depth, thus the gradual rotation of trends implies that suggested stress regimes (NE-SW and NE-SW) were contained in shallow depths, where the E-W trend dominates only in the deepest part. The deep-seated zone seems to be affected by an E-W stress trend. Also the map (regional) with low-pass magnetic component presents positive and negative magnetic anomalies with deep-seated high amplitude. The deep zone seems to be affected by the E - W stress trend.
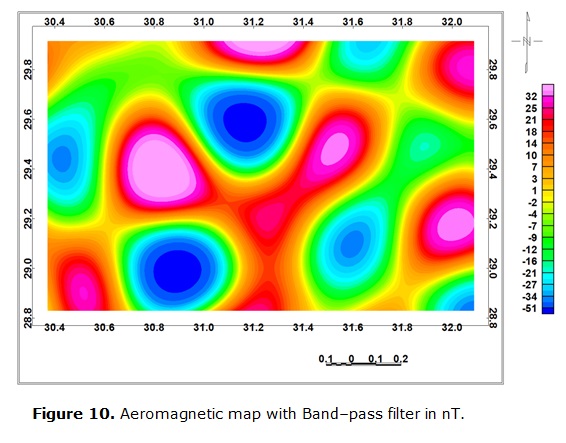
The anomaly map with band-pass magnetic filter (Fig. 10) shows that still persist well-defined trends of anomalies on the RTP aeromagnetic map. However, some regional anomalies that do not appear to be related to a subsurface structure, are most probably a result of regional variations in the magnetization or magnetic susceptibility of the rocks at medieval depths. The band magnetic filtered anomaly map shows that the well defined trends of anomalies in the aeromagnetic map still persist.
Analytical 3D signal method
The analytical signal method is a powerful technique to evaluate buried structures which cause significant linear magnetic anomalies, such as fault zones, steps and dykes (Saadi et al., 2008). The map with analytical signal (Fig. 11) was calculated through Geosoft: Oasis Montaj software version 6.4.2 (Geosoft, 2007). This map mostly reveals a number of elongated high anomalies tending to E-W, which is characterized by increasing the small undulations in their contour lines. These anomalies are separated by a lot of local elements of high relief, small area extensions and elongated shapes. This map (Fig. 11) could be directly used to obtain the corresponding value of the expected source bodies, in respect to the level of observations and it also displays several circular and linear maxima closures.

Analysis of power spectrum transformation
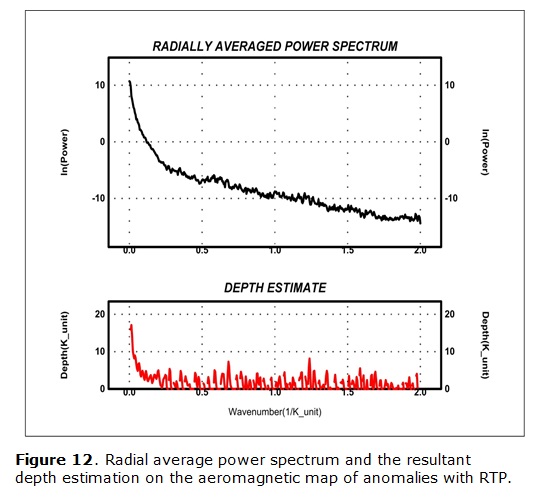
The method of radial average power spectrum is used to determine the depths of volcanic intrusions, depths of the basement complex and the subsurface geological structures. Several authors, such as Bhattacharya (1965), Spector and Grant (1970), Garcia and Ness (1994), Maurizio et al., (1998), explain the spectral analysis technique based on the analysis of the magnetic data using the Fourier Transform. For this study, the Fast Fourier Transform (FFT) was applied on the aeromagnetic data with RTP, to calculate the energy spectrum. As a result, a two-dimensional power spectrum curve was obtained (Fig. 12) on which two main average levels (interfaces) with depths of 0.5km and1.8km below the measuring level (for the aeromagnetic map with RTP) were revealed for the deep seated components and also the surface magnetic components respectively. The depth estimations on the aeromagnetic map with RTP indicated that, the depth on the top of the basement complex lies at 1.3 km, while the depth to the basement intrusion is at depth of 2.5 km, below the measuring level.
Structural trends analysis
The Fayoum–Cairo district lies in the south western of Cairo, Egypt which has been affected by several damaging earthquakes and magnetic data have been analyzed to provide new information about the tectonic setting and subsurface structures. Structural trend analysis techniques are frequently used in various fields of geology and geophysics for defining structural problems. In fact the distinctness with which faults appear on the magnetic map depends principally on the existence and the strength of magnetic contrast in the body rocks involved. The aeromagnetic map of anomalies with RTP and the residual anomalies map were interpreted to determine the common structural trends affecting the study area. The azimuth and length of each detected lineament on different maps probably represent the different lengths and directions of faults and/or contacts. These structure systems were statistically analyzed and plotted in the form of Rose diagrams, as shown in (Fig. 13). Examination of these diagrams indicates three predominant structural trends which have varying intensities and lengths. The predominant tectonic trends are the N-W, N-E, and E-W, which produce affectation as deduced from the magnetic point of view, by the other hand, other minor structural trends on the Rose diagrams such as those: N-S, N-NE, and E-NE are less significant in this area.

Conclusion
This study is devoted to the analysis of aeromagnetic data for seismicity interpretation at Dahshour area, Egypt, in order to detect major structural elements on subsurface which affect both, the sedimentary section and the underlying basement complex. Close examination of the different anomalies through the aeromagnetic map with RTP, reveals the dominance of negative magnetic anomalies in southeastern. Also, the differences in magnetic mitigation between each two adjacent magnetic highs and lows, suggest a comparable variation of composition of the subsurface rocks: these anomalies may be attributed to the occurrence of basic intrusions in the subsurface which have high magnetic content at different depths. The analysis of filtered magnetic maps is characterized by the presence of prominent trends in central part, with NW–SE and NE–SW directions; these faults may be responsible of the earthquakes occurred. The basement is uplifted in northern and central parts with a depth of 1.3 km, and becoming deeper in southern with a 2.5 km depth. Earthquakes have been occurred in this faulting area with high correlation between seismicity distribution and the inverted tectonic trends: this suggests that the N-NW-S-SE directions on the two nodal planes are fault planes (Fig. 3B). In contrast, the intensity distribution map does not show correlation with the inverted tectonic trends from the aeromagnetic data presented here where the isoseismals elongate into north-south direction. This is mainly due to the surface soil formation as site effect (i. e., the recent alluvium deposits elongate in the north-south trend, covering the Nile River and its Valley). These formation controls much of the intensity distribution map (Fig. 5).
References
Abd El-Aziz, K. (2008). Simulating time-histories and pseudo-spectral accelerations from the 1992 Cairo earthquake at the proposed El-Fayoum New City site, Egypt, Acta Geophysica Vol. 56, 4, pp. 1025-1042.
Abou Elenean, K. M. (1997). A study on the seismotectonics of Egypt in relation to the Mediterranean and Red Seas tectonics. PhD Thesis, Faculty of Science, Ain Shams University, Cairo, Egypt. 187 pp.
Abou Elenean, K. M., Mohamed Adel, M. E., Hussein, H. M. (2009). Source parameters and ground motion of the Suez-Cairo shear zone earthquakes, Eastern Desert, Egypt. Natural Hazards Vol. 52, 2, pp. 431-451.
Abu El-Ata, A. S. (1990). The role of seismic-tectonics in establishing the structural foundation and saturation conditions of El-Ginidi basin, western Desert, Egypt. Egyptian Geophysical Society (EGS), Proceedings of the 8th annual meeting pp. 150–189.
Bhattacharyya, B. K. (1965). Two-dimensional harmonic analysis as a tool for magnetic interpretation. Geophysics, vol. 30, pp. 829-857.
Blakely, R. J., (1996). Potential theory in gravity & magnetic applications, Cambridge University Press, Cambridge. 464 pp.
El-Hadidy, S. (1993). Source process of the 1992 Cairo, Egypt earthquake using far field seismogram, Report for the course of seismology 1992-1993, International Institute of Seismology and Earthquake Engineering (IISEE), Japan.
El-Hadidy, M. S. (2012). Seismotectonics and seismic hazard studies in and around Egypt: PhD thesis, Faculty of Science, Ain Shams University, Egypt.
Garcia. J. G., and Ness, G. E. (1994). Inversion of the power spectrum from magnetic anomalies. Geophysics, vol. 59, 3, pp. 391-401.
Geosoft: Oasis Montaj Program. (2007). Geosoft Mapping and Application System, Inc, Suit 500, Richmond St. West Toronto, ON Canadab N5SIV6.
Ghazala, H., (2001). Tectonic setting of the area between Cairo and Fayoum provinces, Western Desert, Egypt: Implications of gravity models. Proceedings of the 2nd International Symposium of Geophysics, Tanta University, Egypt, pp. 101-110.
Hassoup A., Alrifi N., Mekkawi M. and Othman K. (2009). Subsurface structure and seismicity characteristics of south Sinai area, Egypt. International Journal of Exploration Geophysics, Remote Sensing and Environment (EGRSE), Vol. XVI, pp. 9-19.
Hussein, H. M,, Korrat, I. M., Abdel Fattah, A. K. (1996). The October 12, 1992 Cairo earthquake a complex multiple shock, Bulletin Of The International Institute Of Seismicity And Earthquake Engineering (IISEE) Japan vol. 30, pp. 9-21.
Hussein, H. M., Abou El-Enean, K. M., Ibrahim, E. M., , Abu El-Ata, A. S. , Duda, S. J. (1998). Spectral magnitudes and source parameters for recent damaging earthquakes in Egypt, Bulletin Of The International Institute Of Seismicity And Earthquake Engineering (IISEE), Japan vol. 34, pp. 1-24.
Japanese Expert Team (1993). Report of Japan Disaster Relief Team on the earthquake in Arab Republic of Egypt of October 12, 1992, Japan International Corporation Agency. 89 pp.
Khater, M. (1992). Reconnaissance report on the Cairo, Egypt Earthquake of October 12 1992. Technical Report NCEER-92-0033, SUNY-Buffalo, Buffalo, NY. 52 pp.
Maamoun, M., Meghaed, A., Allam, A. (1984). Seismicity of Egypt. Bulletin of Helwan Institute of Astronomy and Geophysics. Vol. 4, pp. 109-160.
Maurizio, F., Tatina., Q., Angelo., S. (1998). Exploration of a lignite bearing in Northern Ireland, using ground magnetic. Geophysics, vol.62, 4, pp. 1143- 1150.
Meshref, W. M. (1990). Tectonic Framework in the Geology of Egypt. Edited by Said, R., A. A. Balkema, Rotterdam, pp. 113–155.
Moharram, A. M., Elghazouli, A. Y., Bommer, J. J. (2008). A framework for a seismic risk model for Greater Cairo. Soil Dynamics and Earthquake Engineering 28, pp. 795–811.
Moustafa, S. S. R. and Takenaka, H. (2009). Stochastic Ground Motion Simulation of the 12 October 1992 Dahshour Earthquake, Acta Geophysica, Vol. 57, 3, pp. 636-656.
Naim, G. M., Hayah al-Misriyah al-Ammah lil-Misahah al-Jiyulujiyah wa-al-Mashruat al-Tadiniyah. (1993). A preliminary report on the Dahshour earthquake, 12 October 1992. Egyptian Geological Survey and Mining Authority. Cairo, Egypt, 48 pp.
Nettelton, L.(1976). Gravity and magnetics in oil prospecting. McGraw Hill Book Company, New York. 464 pp.
Riad, S., Ghalib, M., El-Difrawy, M. A., Gamal, M., (2000). Probabilistic seismic hazard assessment in Egypt. Annals of the Geological Survey of Egypt 2000; Vol 18, part 3, pp. 851-881.
Said, R. (1990). The Geology of Egypt. Rotterdam Brookfield: A. A. Balkema Press, The Netherlands. 734 pp.
Spector, A., Grant, F. S.(1970):Statistical models for interpreting aeromagnetic data.
Geophysics, 35, pp. 293–302.
Thenhaus, P. C., Sharp, R. V., Celebi, M., Ibrahim, A. B. K., Van de Pol, H. (1993). Reconnaissance report on the 12 October 1992 Dahshour, Egypt, Earthquake. United States Geological Service (USGS) Survey Open File Report, pp. 93-181.
How to Cite
APA
ACM
ACS
ABNT
Chicago
Harvard
IEEE
MLA
Turabian
Vancouver
Download Citation
CrossRef Cited-by
1. Tarek Arafa-Hamed, Hossam Marzouk, Samah Elbarbary, Mohamed Abdel Zaher. (2023). A geophysical investigation of the urban-expanding area over the seismologically active Dahshour region, Egypt. Acta Geophysica, 72(2), p.743. https://doi.org/10.1007/s11600-023-01131-3.
2. Jamila Abderbi, Driss Khattach, Jamila Kenafi. (2017). Aeromagnetic contributions to the study of the Paleozoic basement structure of Southern High Plateaus (Eastern Morocco). Arabian Journal of Geosciences, 10(19) https://doi.org/10.1007/s12517-017-3204-9.
Dimensions
PlumX
Article abstract page views
Downloads
License
Earth Sciences Research Journal holds a Creative Commons Attribution license.
You are free to:
Share — copy and redistribute the material in any medium or format
Adapt — remix, transform, and build upon the material for any purpose, even commercially.
The licensor cannot revoke these freedoms as long as you follow the license terms.