Publicado
ATC-PSQUAL scale: A proposal to measure perceived quality of the Air Traffic Control Service
Palabras clave:
calidad percibida del servicio, servicios de transito aereo - ATS, servicio de control de transito aereo - ATC, medición de la calidad del control de transito aéreo, medición de la calidad del servicio de tránsito aéreo. (es)
instrumento de 21 ítems, llamado ATC-PSQUAL, para medir la calidad percibida
del servicio de Control de Tránsito Aéreo (ATC- Air Traffic Control).
Inicia con la conceptualización y operativización de la calidad del servicio,
la conceptualización de los servicios ATS y la metodología empleada en el
desarrollo de la investigación, continuando con el procedimiento utilizado
en la construcción y refinación de la escala multi-ítems para medir el
constructo referenciado.
Posteriormente, se presentan las evidencias de la fiabilidad y validez de
constructo del instrumento propuesto, basados en observaciones (encuestas)
efectuadas a clientes del servicio ATC (pilotos de aeronaves) que han
usado en los últimos tres meses el servicio prestado por la Unidad Administrativa
Especial de Aeronáutica Civil (Autoridad aeronáutica colombiana), en el espacio aéreo designado como FIR/UTA Barranquilla.
El trabajo concluye con el importante aporte del instrumento ATC-PSQUAL
para el mejoramiento del servicio ATC, no solo para la aviación civil en
Colombia sino también a nivel mundial, constituyéndose en un estudio
pionero en el sector aeronáutico, basado en la disciplina del marketing de
servicio, que deja abierta la discusión para futuros estudios sobre el tema.
Edison Jair Duque-Oliva* & Manuel Mercado-Barboza**
Associate Professor, Escuela de Administración y Contaduría Pública, Universidad Nacional de Colombia, sede Bogotá. E-mail: ejduqueo@unal.edu.co
Universidad Nacional de Colombia, Mechanical Engineering, Universidad del Norte, Specialist in Industrial Electronics, Universidad Nacional de Colombia, Master in Administration. E-mail: manuelmercado@telecom.com.co
Recibido: diciembre de 2010 Aprobado: abril de 2011.
Abstract:
This paper describes the development of the construction of a 21-item instrument, called ATC-PSQUAL, to measure the perceived quality of the Air Traffic Control service (ATC-Air Traffic Control). It begins with the conceptualization and operationalization of the service quality, the conceptualization of the ATS service and the methodology used in the development of the research; continuing with the procedure used in the construction and refinement of a multi-item scale to measure the construct referenced.
Subsequently, evidence of the reliability and construct validity of the proposed instrument, based on surveys applied to customers of the ATC service -aircrafts pilots- who have used, in the last three months, the service provided by La Unidad Administrativa Especial de Aeronautica Civil (the Colombian Civil aviation Authority) in the aerospace designated as Barranquilla FIR / UTA is presented.
The paper concludes with the important contribution of the ATC-PSQUAL instrument for the improvement of ATC service, not only for civil aviation in Colombia but also globally, becoming a pioneering study in the aeronautical sector, based on the discipline of service marketing, leaving the proposal open for future studies on the subject.
Keywords:
Measuring the quality, service quality, perceived service quality, air traffic services, ATS, quality of air traffic control services, air traffic control service, ATC, quality of air traffic control, quality measurement for air traffic control, measureament of the quality of air traffic control service.
Resumen:
Este trabajo describe el desarrollo de la construcción de un instrumento de 21 ítems, llamado ATC-PSQUAL, para medir la calidad percibida del servicio de Control de Tránsito Aéreo (ATC - Air Traffic Control). Inicia con la conceptualización y operativización de la calidad del servicio, la conceptualización de los servicios ATS y la metodología empleada en el desarrollo de la investigación, continuando con el procedimiento utilizado en la construcción y refinación de la escala multi-ítems para medir el constructo referenciado.
Posteriormente, se presentan las evidencias de la fiabilidad y validez de constructo del instrumento propuesto, basados en observaciones (encuestas) efectuadas a clientes del servicio ATC (pilotos de aeronaves) que han usado en los últimos tres meses el servicio prestado por la Unidad Administrativa Especial de Aeronáutica Civil (Autoridad aeronáutica colombiana) en el espacio aéreo designado como FIR/UTA Barranquilla.
El trabajo concluye con el importante aporte del instrumento ATC-PSQUAL para el mejoramiento del servicio ATC, no solo para la aviación civil en Colombia sino también a nivel mundial, constituyéndose en un estudio pionero en el sector aeronáutico, basado en la disciplina del marketing de servicio, que deja abierta la discusión para futuros estudios sobre el tema.
Palabras clave:
calidad percibida del servicio, servicios de transito aereo - ATS, servicio de control de tránsito aéreo - ATC, medición de la calidad del control de transito aéreo, medición de la calidad del servicio de tránsito aéreo.
Résumé :
Cet article décrit le développement de la construction d'un instrument de 21 ítems, ATC-PSQUAL, pour mesurer la qualité de service perçue du Contrôle du Trafic Aérien (ATC - Air Traffic Control).
L'article commence par la conceptualisation et le caractère opérationnel de la qualité de service, la conceptualisation des services ATS et la méthodologie utilisée pour le développement de l'investigation, déterminant ensuite la procédure utilisée pour la construction er le perfectionnement de l'échelle multi-items pour la mesure du modèle de référence.
Il présente les évidences de fiabilité et de validité de construction de l'instrument proposé, sur base d'observations (enquêtes) effectuées auprès de clients du service ATC (pilotes d'aéronef) ayant utilisé, durant les trois derniers mois, les services de l'Unité Administrative Spéciale d'Aéronautique Civile (Autorité aéronautique colombienne) dans l'espace aérien désigné FIR/UTA Barranquilla.
En conclusion, cette étude fournit l'instrument ATC-PSQUAL pour l'amélioration du service ATC, non seulement pour l'aviation civile colombienne mais aussi au niveau mondial, constituant ainsi une étude pionnière du secteur aéronautique, basée sur la discipline du marketing de service, laissant la discussion ouverte pour de futures études sur ce thème.
Mots-clefs :
qualité de service perçue, services du trafic aérien - ATS, service du contrôle du trafic aérien - ATC, mesure de la qualité du contrôle du trafic aérien, mesure de la qualité du service du trafic aérien.
Resumo:
Este trabalho descreve o desenvolvimento da construção de um instrumento de 21 itens, chamado ATC-PSQUAL, para medir a qualidade percebida do serviço de Controle de Tráfego Aéreo (ATC - Air Traffic Control). Inicia com a conceituação e operatividade da qualidade do serviço, a conceituação dos serviços ATS e a metodologia empregada no desenvolvimento da pesquisa, continuando com o procedimento utilizado na construção e refinação da escala multi-itens para medir o constructo referenciado.
Posteriormente, apresentam-se as evidências da fiabilidade e validade do constructo do instrumento proposto, baseados em observações (enquetes) efetuadas a clientes do serviço ATC (pilotos de aeronaves) que usaram, nos últimos três meses, o serviço prestado pela Unidade Administrativa Especial de Aeronáutica Civil (Autoridade aeronáutica colombiana) no espaço aéreo designado como FIR/UTA Barranquilla.
O trabalho é concluído com a importante contribuição do instrumento ATC-PSQUAL para o melhoramento do serviço ATC, não só para a aviação civil na Colômbia, como também em nível mundial, constituindo-se em um estudo pioneiro no setor aeronáutico, baseado na disciplina do marketing de serviço, que deixa aberta a discussão para futuros estudos sobre o tema.
Palavras chave:
qualidade percebida do serviço, serviços de trânsito aéreo -ATS, serviço de controle de tráfego aéreo- ATC, medição da qualidade do controle do tráfego aéreo, medição da qualidade do serviço de tráfego aéreo.
Aviation is remarkable for the giant technological leaps it has made over the last century. This progress would not have been possible without parallel achievements in the control and reduction of aviation's safety hazards. Given the many ways that aviation can result in injury or harm, those involved with aviation have been preoccupied with prevenying accidents since the earliest days of flying. Through the disciplined application of best safety management practices, the frequency and severity of aviation occurrences have declines significantly (ICAO, 2006).
Phenomena such as globalization, mergers of airlines, tourism, open skies policies among nations, technological advances in the aviation industry and the speed of air transportation, have increased the number of air operations worldwide, causing many aircrafts to use the same routes simultaneously, consistent with its high speed performance, making it difficult for the pilots to take overall control traffic in areas where they are flying, these situations increase the risk on air navigation, the possibility of collisions and near misses between aircrafts. These environmental conditions have increased the need for an external service to aircrafts to ensure safety; The service is called Air Traffic Service (ATS), maintaining and providing standard separation guides the aircraft from the ground, supported in aeronautical infrastructure such as communication, radar, radio navigation, and meteorology systems, among others. These services are classified as Air Traffic Control (ATC) service, the flight information service, and alerting service. The present study is focused on the ATC service provided in the Barranquilla FIR.
Aerial accidents and incidents are disastrous, causing loss of human lives, moral effects, and high economic costs, while having insurance can distribute the costs of an accident over time, accidents are not a good business. While insurance may cover specific risks, there are many uninsured costs. In addition, there are less tangible costs (but no less important) such as loss of confidence of the traveling public. Understanding the total cost of an accident is critical to understanding the need for high quality indicators in the various services provided to civil aviation.
Statistically speaking, few aircraft accidents are caused by a fault of ATC service, but less serious incidents still occur with a moderate frequency, those are signs that suggest safety issues underlying. Ignoring these underlying risks to safety could pave the way for an increase of more serious incidents. This is the reason why any ATC service provider worldwide should strive to understand the flaws in service delivery and the needs, desires and expectations of its customers or users.
Therefore, it is essential to have measurement tools to assess the quality of the ATC service, which will allow the ATC service provider to set the required strategy within the organization to minimize the occurrence of failures in the ATC service delivery ensuring optimal safety conditions and continuous improvement of its processes with customer focus, given the impact of the service on human life.
Since aviation accidents are rare events, accident rates are not good indicators of safety performance. They may be of limited value at the global, regional or national level. However, the absence of accidents may belie many unsafe conditions in the system, creating situation "ripe for accident". Accident rates are even less useful as an indicator of safety when applied to individual aerodromes or flight information regions (FIRs). For any given FIR, for example, the expected time between en-route accidents could be in excess of 100 years (ICAO, 2006).
Given the importance of providing excellent service and considering ATC strong impact on safety is why the need to examine how to measure the quality of the services provided was originated. In the exploration phase of this research was found that the agencies providers of this service compile quantitative data to provide indicators to measure quality, such as frequency of occurrence and aircraft proximity in flight near misses, runway incursions, loss required separation techniques, delays, notification of proximity of aircraft in flight, warning messages and alerts TCAS, loss of radar coverage and communications, among others; however it was found that there is not an instrument to measure the perceived quality of ATC services based on the discipline of marketing the service. This result originated the overall objective of this study: measuring perceived ATC service quality.
By the above considerations, it is intended to make a contribution to aviation, not only in Colombia but worldwide, building a measuring instrument with empirical validity and reliability to evaluate perceived quality of the ATC service, which allows, together with other quantitative measures established by any aviation authority, the continuous improvement of these services, and structure of the customer-oriented service.
This article is divided into four sections: The first section focuses in the conceptualization of perceived service quality and the ATC service (ATS - Air Traffic Service), in accordance with the provisions of the International Civil Aviation Organization (ICAO); the second section refers to the methodology used for the development of the work, the third section deals with the analysis of the scale and the results obtained, and ending in the fourth section with an analysis of the results or conclusions.
The concept of quality of service: Any product, service or good, consists of one or more attributes that characterize it; all those attributes or properties that allow the consumer to assign value to that product are considered its quality. The single most researched area in services marketing to date is service quality. The interest in service quality parallels the focus on quality, total quality management, and satisfaction in business. (Fisk et al., 1993, p. 77). As a starting point, it should be noted that the quality, whether in tangible products or services, is what customers perceive (Grönroos, 1994, p. 35); The very intangibility of the services causes that they are largely perceived in a subjective way (Grönroos, 1994, p. 37); Unlike goods quality, which can be measured objectively by such indicators as durability and number of defects (Crosby,1979; Garvin, 1983), service quality is an abstract and elusive construct because of three features unique to services: intangibility, heterogeneity, and inseparability of production and consumption (Parasuramant et al., 1985), and finally it is worth mentioning that "Knowledge about goods quality, however, is insufficient to understand service quality" (Parasuraman et al., 1985: p. 42).
As defined by Parasuraman et al. (1985: p. 41), referring to the importance of quality of services, "while the substance and determinants of quality may be undefined, its importance to firms and consumers is unequivocal." Researchers have demonstrated the strategic benefits of quality in contributing to expand the market share and return on investment (Anderson & Zeithaml, 1984; Phillips, Chang, & Buzzell, 1983), as well as in reducing manufacturing costs and improving productivity (Garvin, 1983). Service quality is an elusive (indefinable) and abstract term hard to define and measure. (Brown & Swartz, 1989; Carman, 1990; Crosby, 1979; Garvin, 1983; Parasuraman et al., 1985, 1988; Rathmell, 1966). In marketing literature we find definitions associated with this concept; we could classify the two perspectives, one from the customer's perception and other from the perspective of the expectations and perceptions of customers, then highlighting the following: Approach from the customer's perception:
- The consumer's judgment about an entity's overall excellence or superiority (Zeithaml, 1987).
- A high quality service is the one that satisfies the client in a given situation (Eiglier & Langeard, 1989).
- Overall customer judgment about service excellence or superiority (Casino, 1999).
- It is what the consumer perceives it is (Llorens & Fuentes, 2005).
Approach from the expectations and perceptions of customers:
- Comparison of customer expectations with the actual result of the service received (Parasuraman et al., 1985).
- It is the result of comparing the expectations and perceptions (Zeithaml, 1992).
- Results of the consumer-perceived difference between their expectations and perception of the outcome (Rust & Oliver, 1994).
- Comparison of expectations and actual service performance (Grönroos, 1984).
In classical literature related to the concept of quality, there are two approaches: The Objective quality and the Subjective quality. Authors as Reeves & Bednar (1994) distinguished four trends for the analysis of the quality concept, based on: Quality as an experience, quality as value perceived, quality as in being able to conform to specifications, and quality as meeting customer's expectations.
The Objective quality is related to compliance with specifications or compliance of a good or service with the technical standards. According to Vázquez et al. (1996), the Objective quality is an inside view of quality since it is a view from a production standpoint. Statistical Process Control could be considered as the basic tool of the Objective quality.
On the other hand, the Subjective quality is focused on the consumer or client perspective and relates to the extent of their perception or to the difference between expectation and perception of a product or a service. Vazquez et al. (1996) talk about subjective quality as an external view, as this quality is obtained through the determination and fulfillment of needs, desires and expectations of customers, since service activities are highly related to the contact with customers (Duque, 2006).
With all this, the service quality construct as it is conceptualized in the service marketing literature refers to the perceived quality. Perceived quality is the opinion of consumers about an entity's superiority or overall excellence (Zeithaml, 1987). Parasuraman et al. (1988), contrasting the perceived quality versus objective quality, state that: Researchers (Garvin, 1983; Dodds & Monroe, 1984; Holbrook & Corfman, 1985; Zeithaml, 1987) have emphasized the difference between objective quality and perceived quality.
Referring to the intrinsic characteristics of services (intangibility, heterogeneity, inseparability, and expiration), Cristóbal (2002) states that these distinguishing features of the services are the ones needed to determine its quality; they help to know which are the aspects that customers use to evaluate the service and what is the perception about them (Grönroos, 1994, p. 35), directing the assessment to the process rather than to the result. This perspective implies admitting that the determination of the quality of services should be based primarily on the perception that customers have on services (Grönroos, 1994; Parasuraman et al., 1985; Steenkamp, 1990) -the fundament that opens the door to introduce the concept of perceived quality of services, which has been the way of conceptualizing the quality, predominantly in the field of services.
The service marketing literature provides the multidimensional nature of perceived service quality construct. The dimensions are elements of comparison that individuals use to evaluate the various objects (Bou, 1997) and in many cases are not directly observable, but are abstractions which the subject perceives from service attributes; from the results of these studies can be inferred that there is not an unified approach about the dimensions that characterize the services.
The multidimensional nature of service quality has always been accepted with both practical and theoretical approaches. Being the point of divergence the determinants of this "quality of service identity". The different classifications of dimensions that are given to the construct are highly variable and heterogeneous, but for now there is no consensus (Duque, 2006).
Based on the multidimensional nature of the construct "service quality", many authors in the field of service marketing have proposed abstract models in order to establish what are the determining dimensions or attributes that characterize services and to make its assessment. The assessment of quality of service in the traditional atmosphere is studied through concepts such as perceived quality, satisfaction and value (Gil et al., 2004, p. 4).
Being the main point the disconfirmation process, the comparison of expectations, and actual service performance (Duque, 2006), based on the disconfirmation paradigm of Oliver (1980), which states that the client evaluates the quality making a comparison (divergence) between expectation and perception of service received, a trend that originated among others the Nordic model (Grönroos, 1984), the model of the five gaps developed by Parasuraman et al. (1985), and the SERVQUAL scale (Parasuraman et al., 1988, 1994a, 1994b); likewise there is another trend oriented to recognize only the perception as a determinant for assessing the quality of any service. This trend is considered unnecessary to compare perceptions with expectations; taking into account the latter, in most cases is above the perception of service performance by the client; this concept originated the SERVPERF scale (Cronin & Taylor, 1992) and model RSQS - Retail Service Quality Scale (Dabholkar et al., 1996), among others.
Measuring the perceived quality of service is developed from the research conducted by Parasuraman, Zeithaml, and Berry, who created the model of the five discrepancies (gaps) and the SERVQUAL measuring instrument.
SERVQUAL is a concise multi-item scale with good reliability and validity, which service companies can use to improve the understanding of the perceptions and expectations of service and as a result to improve the service. The instrument has been designed to be applied to a wide range of services. As it is, provide a basic skeleton through the expectations and perceptions formats covering items for each of the five dimensions of service quality. The model can be adapted or supplemented to fit the characteristics or specific research needs of a particular organization (Parasuraman et al., 1988).
The SERVQUAL scale, being one of the pioneering researches in measuring the scale of services-and perhaps the most consulted-has faced many criticisms, which may be summarized as shown by Buttle (1996, p. 10): "Notwithstanding its growing popularity and widespread application, SERVQUAL has been subjected to a number of theoretical and operational criticisms"
Due to the criticisms and limitations of the scale, proposed alternative were presented as follows the revised SERVQUAL scale (Parasuraman et al., 1991a; 1991b), the SERVPERF scale (Cronin & Taylor, 1992), and the Evaluated Performance Model (Teas, 1993).
The concept "ATS (Air Traffic Service)"
The conceptualization of the service ATS (Air Traffic Service) is a large and very technical topic; we will approach some specific aspects of it, beginning with the rationale for providing this service, its definition, objectives, classification, regulation, how the aerospace is distributed in Colombia, finishing with the issue of quality in the provision of ATS according to the suggestions or guidelines of the International Civil Aviation Organization (ICAO).
With the spectacular growth of civil aviation after World War II, the need for an international organization that regulates the aviation activity increased, so as to allow the transport of people and goods safely. The organization mandated international standardization of facilities and services, among others, the services that allow management and control of aerospace, to prevent each state independently establishing standards and procedures for air navigation, making difficult the usage of their aerospace for international aviation.
As a result of the meetings and talks led by U.S., Allied and neutral countries, in order to normalize international civil aviation, was successfully concluded on December 7, 1944, in Chicago - USA, an agreement on international civil aviation, called the Chicago Convention, giving rise to the International Civil Aviation Organization (ICAO), specialized agency of the United Nations responsible for administering the principles established in the agreement, setting rules on aviation safety and its efficiency, consistency and ensuring environmental protection and aviation.
Phenomena such as globalization, technological advances in the aviation industry, and the speed of air transportation, have increased the number of air operations worldwide, causing many aircrafts to use the same routes simultaneously, consistent with its high speed performance, making it difficult for the pilot to take overall control traffic in areas where he is flying. These situations increase the risk of air navigation, the possibility of collisions and near misses between aircrafts. Hence the need for an external service called ATC offered to the crews to ensure safety, maintaining and providing standardized separation of aircrafts, and guidance from the ground, supported by an aviation infrastructure, including communications systems, radars, radio aids, and meteorology services, among others.
International civil aviation from its beginnings was linked to efforts of many states to standardize their operations and enable peaceful use; finally, with the Chicago Convention (1944), the international regulation begins, setting standards for safety aviation, as well as efficiency, consistency, and ensuring environmental and aviation protection. Later in the year of 1947 the International Civil Aviation Organization (ICAO) emerged as a specialized agency of the United Nations, responsible for administering the principles established in the agreement.
For the specific case of ATS, the ICAO has issued annexes and documents in order to regulate the provision of these services; it is important to clarify that both documents and annexes are constantly updated through amendments in accordance with the accelerated evolution of aviation; in the case of our country, the Colombian aviation authority grounded in the Annexes to the ICAO established the Colombian Aeronautical Regulations - RAC.
ICAO (1984, p. 1) Air Traffic Services has been defined in Annex 11, as being "a generic term meaning variously flight information service, alerting service, air traffic advisory service, air traffic control service, area control service, approach control service or aerodrome control service".
In accordance with paragraph 2.2 of Annex 11 (ICAO, 2001), the objectives of air traffic services are in summary the following: To prevent aircraft collisions; accelerate and maintain an orderly flow of air traffic and provide useful advice for safe and effective operation of the flights, notifying the relevant authorities about aircrafts needing search and rescue aid and assist such agencies as needed.
In accordance with paragraph 2.3 of Annex 11 (ICAO, 2001), air traffic services comprise three services, with the following names: 1. Service Air Traffic Control (ATC) to meet the objectives of: Preventing collisions between aircraft; prevent collisions between aircraft on the maneuvering area and between them and the obstacles they have in that area, and expediting and maintaining an orderly flow air traffic. This service is divided into: Service Area Control, Approach Control Service, and Aerodrome Control Service 2. The Flight Information Service to meet the objective of advising and providing information useful for safe and effective running of the flights, and 3. Alert Service to meet the goal of notifying the relevant agencies for aircraft needing search and rescue aid, and assist such agencies as needed.
The designation given to the person providing ATS is the air traffic controller, responsible for directing the movement of aircraft in the airspace and aerodromes, in a safe, orderly and quick way. In accordance with annex 1 of ICAO (2010, p. 1), "As long as air travel cannot do without pilots and other air and ground personnel, their competence, skills and training will remain the essential guarantee for efficient and safe operations. Adequate personnel training and licensing also instill confidence between States, leading to international recognition and acceptance of personnel qualifications and licences and greater trust in aviation on the part of the traveller".
ATS aerospace, according to the ICAO, is classified as class A, B, C, D, E, F and G, depending on type of flight (IFR, VFR) and the type of services offered; its designation is as follows: Flight Information Regions (FIR), control areas, and control zones, controlled aerodrome.
Due to international civil aviation, aerospace organization for a state cannot be considered in isolation, which means it is an integral part of a much larger system that includes at least one ICAO region; our country (Colombia) is part of the CAR-SAM region (Caribbean region - South America). The aerospace where air trafffic services are provided is designated as follows: Flight Information Region (FIR), Control Area (CTA), and Control Zone.
Normally the FIR, which corresponds to a flight information region, covers the entire air space above the territory of a state. The FIR in Colombia is divided into two sectors: The Bogotá FIR/UTA (controlled from Bogotá) and the Barranquilla FIR/UTA (controlled from Barranquilla). The UTA corresponds to a greater control area above specific vertical limits (see Figure 1).
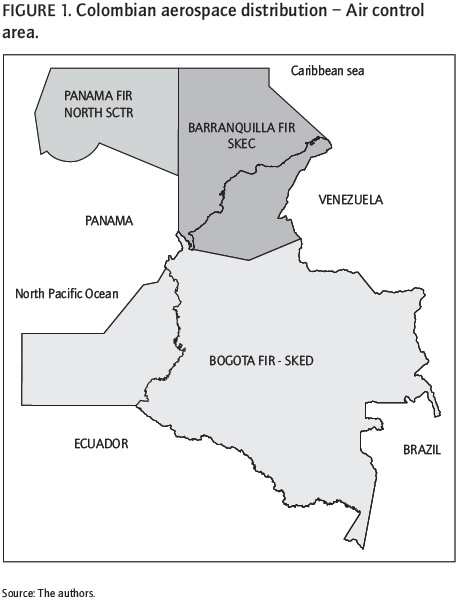
The ATC service is provided from air traffic control towers of different airports and control centers. Control towers provide information, in accordance with regulations on traffic control service to aerodrome, to the various incoming and outgoing flights at each airport. The services provided from the control centers are approaching control and superior area control to all aircraft entering, departing, and overflying the airspace UTA.
The concept of aviation safety may have different connotations, such as: No accidents (or serious incident), absence of hazards or risks, the extent to which risks are acceptable to aviation, processes of hazard identification and management of risks, and control of accidental loss, among others.
In the Document 9859 (Operational Safety Management Manual - SMM) , ICAO (2006: p. 1) defines operational safety as follows: "Is the state in which the risk of harm to persons or of property damage is reduced to, and maintained at or below, an acceptable level through a continuing process of hazard identification and risk management."
Annex 11 requires to states to establish an acceptable level of operational safety applicable to the provision of ATS within their aerospace and at aerodromes. In Chapter 17 (ATS) of the Document 9859 (ICAO, 2006) are established the guidelines related to service ATS.
The quality in the provision of ATS is critical considering the implications, sometimes catastrophic, due to operational errors in the provision of such services.
For anticipating operational incidents or accidents associated with the provision of ATS services, any ATS unit must take corrective action related to the following factors: The training of human resources (improvement of aeronautical phraseology, English language proficiency, training simulator, improvement of staff communications, etc.), teamwork, and customer service feedback.
According to ICAO (2002), Quality Assurance is a dynamic process used to continually improve an ATS. Although the quality of service continue to be measured by any method of historical data, such as the number of ATS incidents, delays, feedback from employees and customers, we also must recognize factors that cannot be measured so quickly. The success of the quality assurance effort depends on recognizing that all ATS providers in the CAR/SAM, independently and collectively, must strive to provide the best possible service.
In order to identify and correct deficiencies in the ATS provision, before the occurrence of an incident or accident, in the Third Regional Air Navigation Caribbean/South American (CAR/SAM/3) held in Buenos Aires, Argentina (October 1999) was addressed the issue of quality assurance programs in ATS. As a result, ICAO (2001) developed a regional guidance material CAR/SAM for quality assurance programs for ATS.
The methodology applied consist of the applications of techniques to collect information from primary sources: Exploratory interviews with experienced personnel-air traffic controllers and pilots-and secondary sources such as books, journals, ICAO publications, magazines, and Internet, among others.
For the specific case of marketing of the service, revisions to several journals such as Journal of Marketing, Journal of Marketing Research, European Journal of Marketing, Journal of Consumer Marketing, Journal of Service Marketing, European Journal of Information Systems, among others, were made; searches were performed under the following parameters: Quality measure, Service Quality, Perceived Service Quality, Measure Service, and Service Quality performance. The usage of databases such as: Emerald, JSTOR, Science Direct, Google Scholar, and IEE Electronic Library, among others. Likewise the libraries of the following universities: Fundación Universidad del Norte (Barranquilla), and National University of Colombia at its headquarters in Bogota and Medellin were researched.
For the specific case of ATS, revisions were made to various publications of the ICAO in the 2010 catalog of publications and on its website (www.icao.int).
ICAO documents and the Colombian aviation authority documents were consulted also in the library of the Centro de Estudios Aeronáuticos (CEA) of the Unidad Administrativa Especial de la Aeronáutica Civil in the city of Bogota and on its website (www.aerocivil.gov.co).
Likewise, the following databases: Emerald, JSTOR, Science Direct, Google Scholar, Academic Search Compete, Business Source Complete were searched using the following parameters: Air Traffic Service (ATS), Air Traffic Service Quality, Air Traffic Service Measurement, Air Traffic Control (ATC), Air Quality Traffic Control, Air Traffic Control Measurement.
After performing all the searches and consultations mentioned it was found that there is not a measurement instrument or scale to measure the perceived quality of ATC services, based on the discipline of marketing the service.
Through the process of measurement we can obtain some quantifiable knowledge about the characteristics of a concept, a construct or latent variable (which is not directly observable in a given time)[1], such as market trends, the quality of a product or behavior of organizational design variables in response to the conditions imposed by contextual factors. Thus, measuring a phenomenon is essential for any scientific activity because numbers (values) are assigned to the observed objects in a way that adequately represents the characteristics they have (Nunally & Bernstein, 1995).
Considering the criticism and alternative scales to SERVQUAL and the high levels of standardization of ATC services, we will use as the basis for the construction of the instrument to measure the perceived quality of these services, the scale SERVPERF proposed by Cronin and Taylor (1992), which confirms the dimensionality of service quality proposed by Parasuraman et al. (1988), given the convenience and methodological aspects of operationalization of this scale, and the fact that the concept of perceived service quality is considered by many authors even by the same authors of the SERVQUAL scale, as an attitude.
The methodology for the construction of the instrument used to measure the perceived quality of ATC services and the stage of empirical testing of its reliability and construct validity is presented in Table 1, based on the recommendations suggested by Churchill (1979) and used by Parasuraman, Zeithaml, and Berry in the construction of the SERVQUAL scale.
In general, the methodology is summarized in two main stages: The structure, culminating in the development of the questionnaire for data processing, and verification, which aims to show empirical evidence of reliability and validity of the scale proposed.
The structure of the Analysis Model
Whereas this study is a quantitative research, the goal of this phase of the methodology is to determine the dimensions that characterize the service of air traffic control and attributes through which we can quantify the perceived quality of the service (items' generation) and the development of the questionnaire for data collection; this stage is key to the construction of the instrument or measurement scale.
Generate sample of items. In general, in theoretical models a set of relationships between variables not directly observable and measurable of reality is posed, but they can be presented through a set of manifest variables, items or indicators. Thus "a measurement scale is a set of items, phrases or questions to measure the level reached by a particular attribute or concept is not directly observable in an object" (Vila et al., 2000: p. 1).
As suggested by Hayes (1999, p. 10), there are "two methods designed to identify important dimensions of quality of products or services. The first method is the establishment of quality dimensions, an approach that requires the supplier to set the dimensions of the quality of your service or product. The second method is based on critical incidents (Flanagan, 1954) and involves clients in determining the dimensions of quality." It is also stated, consistent with the above, that "we consider the needs of the client as the characteristics of the product or service that represent important dimensions." On his side, Quivy (2006, P. 117) argues that "there are two ways of structuring a concept, each corresponding to a different level of conceptualization, one is inductive and produce 'operational concept isolated', the other is deductive and make 'systematic concepts' ". Defining the concept isolated operating as a structured concept empirically from direct observations or other information collected. Through readings and interviews from the exploration phase meet the necessary elements for such structuring; and the system concept as a concept is not induced by experience; it is structured by abstract reasoning: deduction, analogy, opposition, involvement, etc., although necessarily inspire the behavior of real objects and previously acquired knowledge on these objects.
Hayes (1999) recommends group interviews or individual interviews to obtain indicators; for individual interviews suggests a number of 10 to 20 people, recommending a higher number to compensate for deficiencies in each approach that really needs to characterize the service and to achieve a correct dimensionality of the service.
The generation of samples of items was based on conceptualizing perceived service quality, in the conceptualization and ATS regulations, and in the open exploratory interviews conducted in the preliminary design stage, accepting the arguments presented by Hayes (1999) and Quivy (2006). Gorden (1975), comparing interviews with questionnaires, shows the following advantages of the interview: Provides more opportunity to motivate the respondent to supply a complete and accurate information immediately, offering greater flexibility in the formulation of questions and more opportunity to assess the validity of the information, observing non-verbal expressions of the interviewee.
Specifically for this study we used a semi-structured type interview, which is the method used to discern a person's knowledge about a specific aspect of his daily life. It takes the form of a conversation that revolves around an open questionnaire related to a precise field of research -often the questionnaire only contains the topics addressed (Létourneau, 2007).
In this way, semi-structured interviews were conducted with ten pilots of commercial aircrafts and ten air traffic controllers with more than ten years of experience in their respective professions. The purpose of the interviews was to determine the perception and needs of the service by drivers -such as direct customers of the service air traffic control, customers using the ATC service provided in the Barranquilla FIR and the opinion of air traffic controllers of this same aerospace, about the characteristics that an air traffic control service with excellent quality should have, because they are the direct suppliers of the service and also they understand the purpose and function of the service itself.
To ensure the quality of the interviews, for reliability and validity of the information collected, suggestions of Létourneau (2007) related to ethical issues in conexion with the respect to respondents and the characteristics of a good interviewer (listening capacity, ability to engage in harmonious conversation, etc.) were implemented. The interview research objectives were revealed to each of the interviewees and their approvals were obtained by recording in magnetic media at the beginning of the interview.
Determination of Dimensions. With the participation of an air traffic controller with more than 15 years of expertise the analysis of the 20 interviews was performed. 410 relevant prepositions or sentences, some of them with the same meaning, were obtained. These prepositions were categorized or grouped deductively, in the five dimensions of service quality (tangibility, reliability, responsiveness, assurance, and empathy) established by Parasuraman et al. (1985 & 1991a) (SERVQUAL scale). Following the suggestion of Hayes (1999), the key to classify the prepositions was based on personal discernment and selection of relevant adjectives and verbs that they contain. Later-after having categorized the different prepositions-phrases were written constituting the most representative indicators of the category or dimension, with the assistance of the expert air traffic controller.
On the other hand, considering the statements made by Parasuraman et al. (1988) that the SERVQUAL instrument is a multi-item scale concise with good reliability and validity, and that despite being designed for use in a wide range of services, adaptation or supplementation is required to suit the characteristics of a particular service, the revised SERVQUAL scale with each of the 22 items that form it were review and evaluated, eliminating those items that did not apply due to lack of coherence and relevance to the ATC service. In that way, questions (Q) (1, 2, 3, 4, 5, 7, 8,10,13,18, 19, and 20) were eliminated of the scale. The items that really applied to the service were included without modifications to the scale construction process; they were added to the indicators obtained from the inductive process of analysis of the preliminary interviews, giving a list of 27 indicators and 5 dimensions[2].
Content validity. Content validity seeks-according to what Devlin et al. (1993) point-that the measuring scale or questionnaire complies with the following characteristics: a) induces a minimal response bias, b) easy to understand and interpret, c) is easily administered or applied in the field, and d) has ability to discriminate (Zapata, 2008). By estimating the content validity we are looking to identify if what is being measured is actually the variable or latent construct we are looking to measure (Vila et al., 2000; Martinez & Hernandez, 2006).
Once collected and grouped the attributes in the above dimensions, we proceeded by using the Delphi Method to check the validity of its content; in that way, we developed a format in which the 27 statements were related, proposing a Likert-type scale from 1 and 5 to value with a score of 1 meaning "Strongly Disagree" and 5 meaning "Strongly agree" making these statements part of the scale or instrument to measure the quality of ATC services, also keeping in mind to have an opening for suggested modifications and/or inclusion of new claims. Following the recommendations of Hayes (1999) in the header of the questionnaire we asked the respondents to indicate the degree to which they agree or disagree with the assertions of the questionnaire.
For the development of this exercise 20 experts (commercial pilots) were contacted. From those, 17 returned the filled out forms; the forms came with a unanimous score agreeing with the inclusion of the proposed statements in the measuring instrument; for that reason it was not necessary to make amendments to the initial set of statements or sending the format (iteration) back to the experts.
Preparation of questionnaire for data collection. As a result of the above, an instrument was developed to measure the perceived quality of ATC services in the Barranquilla FIR, which included the 27 initial claims for assessment, as perceived by pilots, proposing a Likert scale from 1 through 7, where a score of 1 is equivalent to "Strongly disagree" and 7 is equivalent to "Strongly Agree" with the statements listed.
At the conclusion of the structuration phase the following hypothesis was proposed:
The proposed scale, based upon the concepts of perceived quality of the service and the ATS, has the validity and reliability to measure the perceived quality of the ATC Service.
Observation
Design of the population and sample. The sample size in a random sample depends on the behavior of the population variables measured. To calculate were analyzed three probability distributions: Rectangular Distribution, Normal Distribution, and the Bimodal Distribution. For a categorical variable (1 to 7) we have the following results for each set of distributions:
Rectangular Distribution: Assuming a 5% error (e); 95% reliability (α=5% meaning a Z=1.96), the sample size will be 171.
Normal Distribution: Assuming a 5% error (e); 95% reliability (α=5% namely Z=1.96), the sample size will be 100.
Bimodal Distribution: Assuming a 5% error (e); 95% reliability (α=5% namely Z=1.96), the sample size will be 385.
Considering that there are no previous studies that allow us to asumme a definite behavior of the variable evaluated -and with the purpose of supporting the study in a solid way- we will use as a reference the most critical case (maximum variance), that will maximixe the size of the sample. In this case scenario the error will be inferior to 5% in the case the variable behaves in a different way.
Under the above premise, we asumme that the population variable has a Bimodal Distribution, meaning that one half of the population is in the lower end of the scale and the other half is at the top.
Data collection. With the support of the Colombian aviation authority, the FAC - Colombian Air Force (CACOM 3) and the Caribbean Naval Air Group of the Navy in their air base located in the airport Ernesto Cortissoz of the city of Barranquilla and Air Transport Association of Colombia (ATAC)-which currently has 18 members: ADA, Aerorepública, Air France, Aires, Avianca, American Airlines, Continental, COPA, EasyFly, Helicol, Iberia, LAN, Martin, Satin, TACA, Tampa, Delta Airlines, and Aerolineas Argentinas-403 surveys were conducted in general with pilots that currently use the ATC services in the Barranquilla FIR. The answers received surpassed the initial calculated sample of 385 surveys . Data were analyzed by generating a matrix of 27 x 403 (27 variables and 403 pilots) (See Table 2).

Data analysis and Results
For data analysis software was used Statistical Package for the Social Sciences (SPSS) version 15.0 for Windows, considered the most widely used computerized statistical program in the social sciences and business market research. Other software used were SAS Version 9 and AMOS version 16, through which the psychometric calculations of the reliability scale and construct validity were performed.
Diagram design PATH: PATH diagram is the most common form of representing the relationships between different items of the scale and the concept that you are seeking to quantify. (Vila et al., 2000). The proposed model to measure the perceived quality of the Air Traffic control service (ATC) is shown in Figure 2.
Scale Purification: Before starting with the purification of the scale, through a confirmatory factor analysis, and in order to check the grouping of items or questions on the five dimensions (tangibles, reliability, responsiveness, assurance and empathy) that constitute the model proposed above, an exploratory factor analysis was performed using the SPSS software by applying the method of Principal Components and the Varimax orthogonal rotation. The parameters used for the exploratory analysis are shown in Table 3.
Prior to the removal of the factors we applied Bartlett'' sphericity contrast and the Kaiser, Meyer, and Olkin (KMO) measure of sampling adequacy, with the aim of verifying whether the data collected meet the conditions for the application of factorial analysis (see Table 4).

The KMO measure of sampling adequacy is satisfactory since it is above the minimum acceptable value (0.5) as well as Bartlett's sphericity test, as the critical significance level obtained was of 0.000, as manifested by Uriel & Aldas (2005).
The grouping of the items in the five groups or dimensions resulting from the exploratory analysis generated a cumulative percentage of variance of 71.553% (see Table 5). Due to the fact that the resulting groups (group 1 consists of q7, q8, q9, q10, q11, q12, q13, q14, q18, q19, q21, q22, q24, q25, q26, and q27; group 2: q15, q16, q17, and q23; group 3: q3, q4, and q5; group 4: q6 and q20; and group 5: q1 and q2 do not fit the theoretical model proposed, we will perform a confirmatory factor analysis to adjust the data model proposed collected in the observation stage of this research.

We start from a model composed by 27 questions classified as follows:
Tangibility: Q1, Q2, and Q3.
Reliability: Q4, Q5, Q6, Q7, Q8, Q9, Q10, Q11, and Q12.
Responsiveness: Q13, Q14, Q15, Q16, and Q17.
Assurance: Q18, Q19, Q20, Q21, Q22, Q23, and Q24.
Empathy: Q25, Q26, and Q27.
Reliability of each one of the dimensions of the scale was calculated, in accordance with Cronbach (1951); the results obtained through the SPSS are shown in the Table 6.

From the results obtained a satisfactory internal consistency is inferred because the indices calculated are above 0.7 as stated by Hair et al. (1999).
In order to test the construct validity, we conducted a confirmatory factor analysis via AMOS V16 software with the purpose of check the fit of the proposed model; the factor loadings of each of the items and the value of the statistic "t" are shown in Table 7 and values of the adjustment indices are shown in Table 8.

In conducting the t test of the factor loadings of the items that measure each of the latent variables or constructs, it appears that they are loaded positively and significantly on the construct and its value is greater than 0.4 as recommended by Hair et al. (1999); however, signs of adjustment are below the values considered acceptable -this is the reason why we did not consider them satisfactory for the convergent validity of the scale.
With the object of improve the fit indices, we proceeded to evaluate the recommendations given by the statistical packages, through Lagrange multipliers, but ultimately we did not take into account their recommendations to modify the theoretical structure of the proposed model, due to the fact that his recommendations were oriented to modify the proposed correlations between questions (items) and dimensions and the proposed changes did not have affinity or were meaningless. The matrix of waste were also reviewed in order to identify those items or questions that had residues above the value recommended by Hair et al. (1999) of 2.58, with the purpose of remove them from the scale without sacrificing those items that in theory and in practice are considered indicators of weight in the corresponding dimensions.
In summary, the eliminated ítems per each dimensión were as follows:
Tangible: Q3.
Reliability: Q6, Q8, and Q12.
Responsiveness: Q16 and Q17.
The step by step of this procedure is shown in Table 9, which shows the fit indices for each of the models that arise by removing the items mentioned above.
As manifested by Zapata & Canet (2008), the statistics Normed Fix Index (NNF), Non-Normed Fit Index (NNFI), Comparative Fit Index (CFI), and LISREL: Goodness of Fix Index (GFI) and Adjusted Goodness of Fix Index (AGFI) should reach values above or very close to 0.9 to properly consider the goodness of fit of the model (Bentler, 1990; Schumacker & Lomax, 2004; Uriel & Aldas, 2005). In our case, the above indicators are above 0.9, with the exception of AGFI sign that has a value of 0.872, which could be considered acceptable in accordance with the suggestion of the authors mentioned above.
Following the previously analyzed, the model 6 is the one that most closely matches the recommended indexes to ensure the convergent validity of the scale, sacrificing least as possible the spirit of the proposed model, based on the theory of service quality concept ATS -and implementing exploratory interviews with experts.
The item Q3 was deleted as it had standardized residual values above 0.258; perhaps this result is due to Q1 and Q2 items, with whom it formed the dimension called "tangibility", possibly biased due to interference generated by an external source that affected the service one month before conducting the surveys.
Item 6 was removed due to high values of the standardized residuals; we analyzed the remaining items comprising the scale and found that the intention of the measure was included in items 7 and 10.
Likewise item 8 was eliminated due to high values of the standardized residuals; in addition ATC services in Barranquilla FIR statistics have a 100% availability; after analyzing the remaining items comprising the scale, it was determined that the intended measure was already included in other items that make up the dimension of "reliability".
The item Q12 was removed from the SERVQUAL scale due to the facts that had too high values of standardized residuals and that it was not interpreted the same way by the pilots surveyed.
Items Q16 and Q17 were eliminated for the scale not only for their high residuals but also because they are included in item Q13; in developing the Delphi Method two comments were received which stated that the Q13 and Q16 statements were similar, although not initially excluded due to the fact that they were a very low percentage and because they served as a parameter to assess how respondents were concentrated in the processing of the survey form.
Final adjustment of the scale: The resulting final model shown in Figure 3, which we call "ATC-PSQUAL" stands originating from "Air Traffic Control-Perceived Service Quality" is the product of the purification of the scale, which consists of 5 dimensions and 21 items. The calculation of internal consistency or reliability of the scale "ATCPSQUAL" is shown in Table 10 and the load factor of each of their items are shown in Table 11.

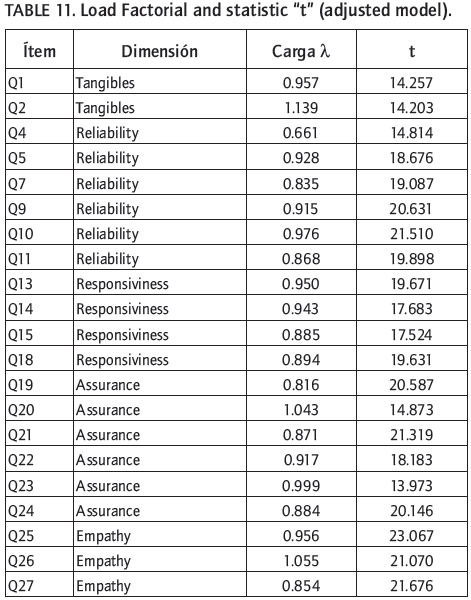
The Cronbach reliability indices of the scale ATC-PSQUAL are met in a satisfactory manner, which allows us to infer that the scale has sufficient reliability to measure perceived service quality of air traffic control; for the above mentioned there was not necessary to remove items from the scale, using as parameters the correlation item - total items suggested by Churchill and applied by Parasuraman et al. (1988). Although the tangibility dimension has two items, internal consistency is satisfactory, indicating that Q1 and Q2 items are strongly correlated.
In general aviation is characterized by its high standards of quality, from the manufacture of components, instrumentation, aircraft, telecommunications systems, etc., including the processes involved in the diversity of services that make up this transport sector. The quality with which the ATS is provided is no exception, playing a leading role in safety, making it necessary to have measurement tools to evaluate not only quantitative parameters, such as delays, number of incidents per period, availability, and reliability of aircraft equipment, but also qualitative parameters such as the quality of the service expected or perceived by the different users of this service.
Given the importance of providing excellent ATC service due to its strong impact on operational safety, developing a way to evaluate how to measure the quality of how these services are provided became necessary. The exploration phase of this research proved that an instrument based on the marketing of the service to measure the perceived quality of ATC service did not exist. This result confirms the need to undertake this study whose main objective was:
To measure the perceived quality of the ATC Service.
The methodology used for the construction of the measuring instrument and empirical testing of its reliability and validity was based on the recommendations suggested by Churchill (1979) and used by Parasuraman, Zeithaml, & Berry in the construction of the SERVQUAL scale.
As a result of the structuring stage came a model for measuring perceived quality of ATC service based on the theory of marketing the service, the ATS concept and content validity of the concepts supported by experts (pilots and air traffic controllers). The attributes or items that make up the proposed model were grouped into five (5) dimensions (tangibility, reliability, responsiveness, assurance and empathy) empirically supported by Parasuraman et al., (1998) and Cronin & Taylor (1992). Considering the criticisms made of the SERVQUAL scale and before the highly suspected of standardization of ATC services, was used as the basis for the construction of the instrument to measure perceived quality, the scale SERVPERF of Cronin and Taylor (1992), given its convenience and methodological aspects of operationalization, based on the fact that the perceived service quality concept is considered by many authors, even by the authors of the SERVQUAL scale, as an attitude.
In the observation phase of data collection was conducted through the diligence of 403 questionnaires (proposed model, the product of methodological structuring phase), by pilots who use the ATC service in the Barranquilla FIR.
The reliability and construct validity of the proposed model was calculated with the AMOS statistical package SPSS version 16 and version 15. Although the internal consistency or reliability of the proposed model was successful, achieving Cronbach's Alpha values above recommended values (tangibility: 0727; reliability: 0923; responsiveness: 0861; assurance : 0898 and empathy: 0902), the exploratory factor analysis did not conform to the theoretical model, hence the need to run a confirmatory factor analysis using AMOS v16 to adjust the theoretical model to the data collected in the observation stage. The goodness of fit indices resulting from the confirmatory analysis of the theoretical model were below recommended levels, still not satisfactory for the convergent validity of the scale. Then, in order to improve the fit indices, we proceeded to evaluate the recommendations given by the statistical packages, through Lagrange multipliers, but ultimately did not take into account his recommendations and modified the theoretical structure of the proposed model; the proposed correlations between questions (items) and dimensions had no affinity or no sense, so we had to rely in the use of the matrix of the residues to identify those items or questions that had residues above the value recommended by Hair et al. (1999), to remove them from the scale, as long as those items are not sacrificed in the theory and practice, and are considered indicators of weight in the dimensions that make up the perceived quality of service. The result of this process was the removal of items Q3, Q6, Q8, Q12, Q16 and Q17, reaching a model whose fit indices are satisfactory, implying a construct validity (χ2/g.l.: 2.5530726; GFI: 0.901; AGFI: 0.872; RMR: 0.052; RMSEA: 0.062; NFI: 0.932; CFI: 0.957; IFI: 0.957; PGFI: 0.698). Then we made the calculation of the reliability of the model (Cronbach's Alpha coefficient) for each of the five dimensions giving the following satisfactory results (tangibility: 0743; Reliability: 0.913; Responsiveness: 0.830; Assurance: 0.898; Empathy: 0.902).
After the psychometric calculations were completed in the research of the present study, we concluded that the scale of the proposed instrument, which we called "ATCPSQUAL," has reliability and the validity of the construct with empirical evidence, corroborating the hypothesis stated: "The proposed scale, based on the concepts of perceived quality of service and the ATS, has the reliability and validity for measuring perceived service quality of air traffic control in the Barranquilla FIR" in compliance with our overall objective. Additionally, as an aggregate contribution of the research, the dimensions that characterize the service were determined -and we also verified that the perceived service quality is a multidimensional construct.
To improve the quality of the air traffic control service provided for any global ATC, it is necessary to measure not only the quantitative results of this service, but to measure the qualitative aspects too; the ATC-PSQUAL scale created allow to measure the perceived quality of ATC services from point of view of the customers; this scale is a valuable contribution to aviation because allow researchers to get knowledge from the customer's perspective in each of the dimensions that make up the scale. The information obtained from the scale provide valuable information to determine the strengths, weaknesses and critical conditions of service, and can be used as a tool to develop strategies aimed at strengthening aviation safety through human talent (groups of air traffic controllers), investments in technology, improving relationships with customers (pilots, airlines, associations, etc.), and maintenance of aviation infrastructure, among others.
Under the consideration that this study is pioneering in the aviation sector in Colombia and possibly worldwide, this work becomes a benchmark for future research, within which we might suggest, creating scales to measure the perceived quality of services flight information and alerting services, tools that might allow, together with ATCPSQUAL scale, measuring the perceived overall quality of ATS.
[1] Our parethesis.
[2] Please contact the authors to get a more detailed description of the instruments employed.
ICAO. (1944). Convenio sobre aviación civil internacional. Doc 7300. International civil aviation organization, Chicago.
ICAO. (1995). Manual de planificación de servicios de tránsito aéreo. Doc 9426. International civil aviation organization, Montreal.
ICAO. (1995). Plan mundial de navegación aérea para los sistemas CNS/ATM Gestión del tránsito aéreo. Documento 4444. International civil aviation organization, Montreal.
ICAO. (2001). PANS/ATM Gestión del tránsito aéreo. Documento 4444. International civil aviation organization, Montreal.
ICAO. (2005). Anexo 2. Reglamento del aire. International civil aviation organization, Montreal.
Anderson, Carl, R. & Zeithaml, V. (1984). Stage of the Product Life Cycle, Business Strategy and Business Performance. Academy of Management Journal, 27(1), 5-24.
Bentler, P. (1990). Comparative Fit Indexes in Structural Models. Psychological Bulletin, 107(2), 238-246.
Bou, J.C. (1997). Influencia de la calidad percibida sobre la competitividad: analisis de los efectos via "demanda". Tesis Doctoral no publicada, Dpto. de Administración de Empresas y Marketing, Universitat Jaume I, Castellón.
Brown, S.W. & Swartz, T.A. (1989). A gap analysis of the professional service quality. Journal of Marketing, 53, 92-98.
Buttle, F. (1996). SERVQUAL: Review, critique, research agenda. European Journal of Marketing, 30(1), 8-32.
Casino, A. (1999). Medición de calidad de servicio. Una aplicación a los establecimientos de alojamiento turístico. En Blanquer D. (Dtor.). Turismo. Organización administrativa, calidad de servicios y competitividad empresarial. I Congreso Universitario de Turismo: Tirant Lo Blanch, Valencia.
Carman, J.M. (1990). Consumer perceptions of service quality: An assessment of the servqual dimensions. Journal of Retailing, 69, 127-139.
Churchill, G.A. (1979). A paradigm for developing better measures of marketing constructs. Journal of Marketing Research, XVI, 64-73.
Cristobal, E. (2002). Conceptualizacion de la calidad de servicio al cliente percibida en el comercio electrónico. Evaluación y aplicación en el establecimiento virtual. Tesis Doctoral, Universidad de Lleida.
Cronbach, L. (1951). Coefficient alpha and the internal structure of tests. Psycometrika, 16, 297-334.
Cronin, J. & Taylor, S.A. (1992). Measuring service quality: A reexamination and extension. Journal of Marketing, 56, 55-68.
Crosby, P. (1979). Quality is Free: The Art of Making Quality Certain. New York: New American Library.
Dabholkar, P., Thorpe, D. & Rentz, J. (1996). A measure of service quality for retail stores: Scale development and validation. Journal of the Academy of Marketing Science, 24(1), 3-16.
Dodds, W.B. & Monroe, K.B. (1985). The Effect of Brand and Price Information on Subjective Product Evaluations. Advances in Consumer Research, 12, 85-90.
Duque, E. J. (2006). Revisión del concepto de calidad percibida del servicio en internet. Trabajo de Investigación. Universidad de Valencia, Facultad de Ciencias Económicas y Administrativas.
Eiglier, P. & Langeard, E. (1989). Servuccion. El marketing de servicios. Madrid: Ed. Mc-Graw Hill.
Fisk, R.P., Brown, S.W. & Bitner, M.J. (1993). Tracking the evolution of the services marketing literature. Journal of Retailing, 69, 61-103.
Flanagan, J. C. (1954). The critical incident technique. Psychological Bulletin, 51, 327-358.
Garvin, D.A. (1983) . Quality on the Line. Harvard Business Review, 61(4), 65-75.
Gil, I., Berenguer, G., Gallarza, M. & Moliner, B. (2004). Calidad, satisfaccion y valor del servicio, una revision. Quaderns de treball, (152).
Gorden, R.L. (1975). Interviewing Strategy, techniques and tactics. Illinois: Dorsey press.
Grönroos, C. (1984). A service quality model and its marketing implications. European Journal of Marketing, 18(4).
Grönroos, C. (1994). Marketing y gestión de servicios: la gestión de los momentos de la verdad y la competencia en los servicios. Madrid: Editorial Díaz de Santos.
Hair, J., Anderson, R., Tatham, R. & Black, W. (1999). Análisis Multivariante. Madrid: Prentice Hall.
Hayes, B. E. (1999). Cómo medir la satisfacción del cliente. México: Oxford University Press.
Holbrook, M. & Corfman, K. (1985). Quality and value in the consumption experience: Phaedrus rides again. In J.Jacoby and J. Olson (Eds.) Perceived Quality. Lexington, MA: Lexington Books, 31-51.
ICAO. (1984). Air traffic service planning manual. Doc 9426-AN/924. Montreal: International civil aviation organization.
ICAO. (2001). Annex 11. Air traffic services. Montreal: International civil aviation organization.
ICAO. (2001). Material de orientación regional CAR/SAM para programas de garantía de calidad de servicio de tránsito aéreo. Montreal: International civil aviation organization.
ICAO. (2002). Primera Reunion de Directores de Aviacion Civil de la Región Caribe (CAR/CDA/1). International civil aviation organization. Gran Caimán, Islas Caimanes 8 al 11 de octubre del 2002.
ICAO. (2006). Safety management manual (SMM). Doc 9859-AN/460. Montreal: International civil aviation organization.
ICAO. (2010). The Convention on International Civil Aviation. Annexes 1 to 18. Montreal: International civil aviation organization.
Létourneau, J. (2007). La caja de herramientas del joven investigador - Guia de iniciacion al trabajo intelectual. E.U.: La carreta editors.
Lloréns, F. J. & Fuentes, M. M. (2005). Gestión de la calidad empresarial. Fundamentos e implantación. Madrid: Editorial Pirámide.
Martínez, L. Á. & Hernández, E. M. (2006). La Fiabilidad y la Validez en las Escalas de Medida de Modelos de Dirección de Operaciones. XVI Congreso Nacional de ACED, Valencia, España.
Nunnally, J.C. & Bernstein, I.J. (1995). Teoría psicométrica. México: McGraw-Hill.
Oliver, R.L. (1980). A cognitive model of the antecedents and consequences of satisfaction decisions. Journal of Marketing Research, 17, 460-69.
Parasuraman, A., Berry, L. & Zeithaml, V. (1991a). Refinement and reassessment of the SERVQUAL scale. Journal of Retailing, 67(4), 420-450.
Parasuraman, A., Berry, L. & Zeithaml, V. (1991b). Understanding customer expectations of service. Sloan Management Review, 32, 39-48.
Parasuraman, A., Zeithaml, V. & Berry, L. (1985). A conceptual model of service quality and its implications for future research. Journal of Marketing, 49(4), 41-50.
Parasuraman, A., Zeithaml, V., & Berry, L. (1988). SERVQUAL: A multiple-item scale for measuring consumer perceptions of services quality. Journal of Retailing, 64(1), 12-40.
Parasuraman, A., Zeithaml, V.A. & Berry, L.L. (1994a). Reassessment of expectations as a comparison standard in measuring service quality: Implications for further research. Journal of Marketing, 58, 111-124.
Parasuraman, A., Zeithaml, V.A. & Berry, L.L. (1994b). Alternative scales for measuring service quality: A comparative assessment based on psychometric and diagnostic criteria. Journal of Retailing, 70, 201-230.
Phillips, L. W., Dae, R. C. & Buzzell, R. (1983). Product Quality, Cost Position and Business Performance: A Test of Some Key Hypotheses. Journal of Marketing, 47(Spring), 26-43.
Quivy, R. (2006). Manual de investigacion en ciencias sociales. Editorial Limusa.
Rathmell J.M. (1966). What is Meant by Services? Journal of Marketing, 30, 32 -36.
Reeves, C. A. & Bednar, C. A. (1994). Defining quality: Alternatives and implications. Academy of Management Review, 19, 419-445.
Rust, R. & Oliver, R. (1994). Service quality. New directions in the theory y practice.
Schumacker, R. & Lomax, R. (2004). A Beginner's Guide to Structural Equation Modeling. Nueva Jersey: Lawrence Erbaum Associates, Inc.
Steenkamp, J.B (1990). Conceptual Model of the Quality Perception Process. Journal of Business Research, 21, 309-333.
Teas, R.K. (1993). Expectations, performance evaluation and customers perceptions of quality. Journal of Marketing, 57, 18-34.
Uriel, E. & Aldas, J. (2005). Análisis Multivariante Aplicado. México: Editorial Thomson.
Vila, N., Kuster, I. & Aldás, J. (2000). Desarrollo y Validación de Escalas de Medidas en Marketing. Quaderns de Treball, 104.
Vázquez, R., Rodríguez, I. & Díaz, A. M. (1996). Estructura multidimensional de la calidad de servicio en cadenas de supermercados: desarrollo y validación de la escala Calsuper Oviedo. Facultad de Ciencias Económicas y Empresariales. Universidad de Oviedo. Documento de trabajo 119/96.
Zapata, R., Canet & Giner, M. (2008). Propuesta metodologica para la construccion de escalas de medicion a partir de una aplicación empirica. Revista electrónica actualidades investigativas en educación, (Mayo-Agosto), 1-26.
Zeithaml, V. (1988). Consumer perceptions of price, quality and value: a means-end model and síntesis of evidence. Journal of Marketing, 52(3).
Zeithaml, V. (1992). Calidad total en la gestión de los servicios. Madrid: Editorial Díaz de Santos.
Zeithaml, V. (1987). Defining and Relating Price, Perceived Quality, and Perceived Value. Report N. 87-101. Cambridge, MA: Marketing Science Institute.
Zeithaml, V., Berry, L.L. & Parasuraman, A. (1988). Communication and control processes in delivery of service quality. Journal of Marketing, 52, 35-48.
Cómo citar
APA
ACM
ACS
ABNT
Chicago
Harvard
IEEE
MLA
Turabian
Vancouver
Descargar cita
Visitas a la página del resumen del artículo
Descargas
Licencia
Derechos de autor 2011 Innovar

Esta obra está bajo una licencia internacional Creative Commons Reconocimiento-NoComercial-CompartirIgual 3.0.
Todos los artículos publicados por Innovar se encuentran disponibles globalmente con acceso abierto y licenciados bajo los términos de Creative Commons Atribución-No_Comercial-Sin_Derivadas 4.0 Internacional (CC BY-NC-ND 4.0).
Una vez seleccionados los artículos para un número, y antes de iniciar la etapa de cuidado y producción editorial, los autores deben firmar una cesión de derechos patrimoniales de su obra. Innovar se ciñe a las normas colombianas en materia de derechos de autor.
El material de esta revista puede ser reproducido o citado con carácter académico, citando la fuente.
Esta obra está bajo una Licencia Creative Commons: