Published
Effects of the Amount of Activity on the Learning of Data Analysis and Sampling Distribution in the Context of Statistics Teaching: An Imperfect Comparison
Los Efectos de la Cantidad de Actividades en el Aprendizaje del Análisis de Datos y la Probabilidad Muestral en el Contexto de la Enseñanza de la Estadística: una Comparación Imperfecta
Os Efeitos da Quantidade de Atividades na Aprendizagem da Análise de Dados e a Probabilidade Amostral no Contexto do Ensino da Estatística: uma Comparação Imperfeita
Keywords:
statistical reasoning, data analysis, simulation, online resources, new technologies (en)razonamiento estadístico, análisis de datos, simulaciones, recursos virtuales, TICs, racionamento estatístico (es)
racionamento estatístico, análise de dados, simulações, recursos virtuais, TICs (pt)
Downloads
En este estudio se examinaron los costos y beneficios interrelacionados que tiene el aprendizaje de estadística mediante el análisis de datos en situaciones auténticas y el uso de simulaciones que permiten la práctica repetida; para tal fin se compararon dos intervenciones dirigidas a enseñar dicho tema y a desarrollar el razonamiento estadístico. En la enseñanza sobre ANOVA, una intervención empleó herramientas de análisis de datos, mientras que la otra se enfocó en aspectos formales de la probabilidad, explicados a través de simulaciones. Los resultados mostraron que la intervención con simulaciones fue efectiva para enseñar conceptos de probabilidad, muestreo y tamaño muestral, mientras que la intervención enfocada en el análisis de datos no tuvo efectos significativos en el desarrollo de dicha habilidad.
Effects of the Amount of Activity on the Learning
of Data Analysis and Sampling Distribution in the Context of Statistics Teaching: An Imperfect Comparison
Los Efectos de la Cantidad de Actividades en el Aprendizaje del Análisis de Datos y la Probabilidad Muestral en el Contexto de la Enseñanza de la Estadística: una Comparación Imperfecta
Os Efeitos da Quantidade de Atividades na Aprendizagem da Análise de Dados e a Probabilidade Amostral no Contexto do Ensino da Estatística: uma Comparação Imperfeita
JAVIER ALEJANDRO CORREDOR
Universidad Nacional de Colombia, Bogotá
Correspondence concerning this article should be addressed to Javier Corredor, e-mail: jacorredora@unal.edu.co.
Department of Psychology, Universidad Nacional de Colombia, Cr. 30 No. 45-03, Building 212, office 211, Bogotá, Colombia.
SCIENTIFIC RESEARCH ARTICLE
RECEIVED: 8 MARCH 2012 - ACCEPTED: 16 SEPTEMBER 2012
Abstract
This article examined the tradeoff between data analysis and simulations in the learning of statistics. In order to do this, the article compared two different interventions aimed at teaching statistics. One intervention used data analysis tools and focused on examples and long exercises that required students to interpret data. The other intervention used simulations and focused on formal aspects of probability related to statistical inference. Then, both perspectives were contrasted in their effectiveness to teach ANOVA. The intervention that used simulations improved students' knowledge about probability, sampling and sample size effects. The intervention that used data analysis tools showed no significant effects on students' data analysis knowledge.
Keywords: statistical reasoning, data analysis, simulation, online resources, new technologies.
Resumen
En este estudio se examinaron los costos y beneficios interrelacionados que tiene el aprendizaje de estadística mediante el análisis de datos en situaciones auténticas y el uso de simulaciones que permiten la práctica repetida; para tal fin se compararon dos intervenciones dirigidas a enseñar dicho tema y a desarrollar el razonamiento estadístico. En la enseñanza sobre ANOVA, una intervención empleó herramientas de análisis de datos, mientras que la otra se enfocó en aspectos formales de la probabilidad, explicados a través de simulaciones. Los resultados mostraron que la intervención con simulaciones fue efectiva para enseñar conceptos de probabilidad, muestreo y tamaño muestral, mientras que la intervención enfocada en el análisis de datos no tuvo efectos significativos en el desarrollo de dicha habilidad.
Palabras clave: razonamiento estadístico, análisis de datos, simulaciones, recursos virtuales, TICs.
Resumo
Neste estudo, examinaram-se os custos e benefícios inter-relacionados que a aprendizagem de estatística tem mediante a análise de dados em situações autênticas e o uso de simulações que permitem a prática repetida; para isso, compararam-se duas intervenções dirigidas a ensinar o tema e a desenvolver o racionamento estatístico. No ensino sobre a ANOVA, uma intervenção empregou ferramentas de análise de dados, enquanto a outra se enfocou em aspectos formais da probabilidade, explicados por meio de simulações. Os resultados mostraram que a intervenção com simulações foi efetiva para ensinar conceitos de probabilidade, amostragem e tamanho amostral, enquanto a intervenção enfocada na análise de dados não teve efeitos significativos no desenvolvimento de dita habilidade.
Palavras-chave: racionamento estatístico, análise de dados, simulações, recursos virtuais, TICs.
THIS STUDY explores the relationship between the pedagogical perspectives of statistical education entailed in computer-based instruction; the amount of activity possible in each perspective, measured as the number and type of exercises; and the resulting learning of statistical inference. In particular, this study focuses on two different interventions aimed at teaching statistical inference in the context of group mean differences. The first intervention, called the sampling condition, requires students to use simulations in order to learn about ANOVA. The second intervention, called the data analysis condition, asks the students to engage in data analysis exercises in order to learn about the same content. The comparison between these two interventions is an opportunity to understand how different online tools facilitate the learning of statistics and how those effects relate to common flaws in statistical reasoning.
Why is Learning Statistics Difficult?
People have three basic difficulties in learning statistics. Each one related to the basic spaces of statistical practice. First, people have problems understanding the concepts of probability and sampling. Second, people have trouble with the representation and analysis of data in the presence of variability. Finally, people seem to produce causal inferences in a way that is not consistent with inferential statistics.
Sampling. The first type of difficulty is related to problems to understand sampling and sample size effects. People use heuristics that do not follow probabilistic algorithms to calculate payoffs and likelihoods (Kahneman & Tversky, 1972; Tversky & Kahneman, 1974). The use of heuristics produces misconceptions about probability that are highly resistant to change (Chance, DelMas, & Garfield, 2004; Konold, 1995; Konold, Pollatsek, Well, Lohmeier, & Lipson, 1993). For example, people tend to ignore population base rates when judging the probability of a sample with certain characteristics. Instead, people evaluate the representativeness of the sample characteristics according to their beliefs (Tversky & Kahneman, 1974).
Additionally, students consider samples simply as arbitrary subsets of populations, and they do not consider variability due to sampling effects. This erroneous conception of samples leads students to reason in flawed ways about statistical inference (Saldanha & Thompson, 2003). Students tend to think that all samples resemble the population from which they were obtained regardless of the sample size. Finally, people have an intuitive model of chance in which probability values represent single event outcomes instead of tendencies in a series of events (Garfield, 2002; Konold, 1989). When told, for instance, that there is an 80% chance of having a sunny day, people assume that there is going to be a sunny day (Konold, 1995).
Data analysis. The second difficulty in learning statistics comes from people's tendency to make incomplete use of data when building representations, and to ignore variability in the interpretation of data sets. Several problems with data interpretation have been identified in the literature. Ben-Zvi and Arcavi (2001) elaborated the distinction between local and global views of data. Local views of data focus on individual values or small subsets of data instead of building an interpretation of all the available information. Global views, by contrast, are interpretations that identify patterns in the complete data set. Experts in statistics combine local and global views of data when building interpretations, whereas novices focus exclusively on local views. This difference comes from the fact that statistics experts think in terms of propensities, that is, in terms of properties of non-homogenous data aggregates (Konold, Pollatsek, & Well, 1997), while novices do not.
Another possible extension of flawed statistical reasoning is people's tendency to prefer concrete representations of data when carrying out statistical analysis. Konold (1995) reported that students had a strong preference for two-way tables and absolute frequencies with precise values over other types of representations such as histograms and boxplots. It is possible that learners stick with concrete representations due to problems with considering permutations in data representations. These permutations, called transnumerations by Wild and Pfannkuch (1999), are an important part of statistical thinking. The ability to work with multiple representations is central to the understanding of mathematics in general (Dreyfus & Eisenberg, 1996; Leinhardt, Zaslavsky, & Stein, 1990) and statistics in particular (Burgess, 2002; Cai & Gorowara, 2002). In the case of statistics, representational permutations permit learners to generate different interconnected data representations in order to attain a deeper understanding of the statistical situation (Ben-Zvi, 2002; Burgess, 2002).
Concrete representations mask the existence of variability in data sets. Frequency counts and central tendency indicators by themselves cannot represent the variability that surrounds them. People's preference for this type of representations is problematic because statistical reasoning requires acknowledging variability as a central feature of data and reality (Garfield & Ben-Zvi, 2005). Variability is what creates uncertainty in the conclusions and, therefore, it is what gives statistical character to descriptions and comparison with multi-case datasets (Konold et al., 1997). Ignoring variability as well as focusing exclusively on concrete values when conducting data analysis are problems that have a common root: the lack of conceptual understanding of statistics' goals and tools caused, in part, by traditional teaching that is focused mainly on algorithms (Cai & Gorowara, 2002). Students accustomed to mechanical calculations are unable to give conceptual meaning to different types of statistics (e.g., mean, standard deviation, etc.), even when they know the algorithms necessary to determine numerical values for these statistics (Batanero, Godino, Vallecillos, Green, & Holmes, 1994). It has been shown also that the use of statistics (e.g., regression, ANOVA, etc.) does not happen spontaneously, even when the students have the procedural knowledge necessary to conduct the calculations (Ben-Zvi, 2002; Gal, Rothschild, & Wagner, 1990). Among the causes for this situation are an incomplete or non-existent understanding of the need for global views of data (Ben-Zvi & Arcavi, 2001), limited experience with the conditions of use of statistical indicators (e.g., mean vs. median in the presence of outliers), and the inability to find adequate representations of the meaning of the statistical indicators both in graphical and numerical form (Watson & Moritz, 1999).
Inference. A third type of difficulty for the learning of statistics comes from the fact that people do not produce causal inferences using standard statistical procedures. Literature in causal inference states that people's behavior can be described by models that are no consistent with parametric inferential procedures. Models of causal inference assume that people behave rationally in the sense that they evaluate causal relationships by updating beliefs in concordance with bayes theorem (Buehner, Cheng, & Clifford, 2003; Cheng, 1997; Griffiths & Tenenbaum, 2005). The basic idea behind the different models in this paradigm (e.g., Power PC and ∆p) is that people evaluate causal strength by conducting calculations based on bayesian models over the contingency distributions of cause and effect variables. While bayesian models are based on probabilistic theory, they are not consistent with statistical inference, particularly, with the parametric models for evaluating group-mean differences. For example, it is common in causal inference experiments to ask participants to evaluate the strength of the relationship between two dichotomous variables presented in a contingency table. The model assumes that the strength perceived by learners will be consistent with calculations that use the posterior probability of a bayesian model applied to the data. It is not clear, however, whether learners understand the sampling effects derived from the posterior probability in which the causal power is calculated. There is no evidence supporting the idea that learners understand that in different possible worlds, different actual frequencies would appear, due to sampling distribution effects. Learners are also unable to evaluate the effects of inner group variance in the evaluation of causal strength when presented with problems that include continuous variables (Cordoba, 2007).
In addition to bayesian-based reasoning, research in causal inference has identified heuristic strategies that are not consistent with pure rational models. Research has shown that people take into account temporal information -the fact that the cause precedes the effect- when making causal inferences, even when comparing models that are normatively equivalent (Greville & Buehner, 2007). In the same line, research on heuristic judgment shows that prior knowledge (Griffiths, Sobel, Tenenbaum, & Gopnik, 2011), the need for theory-based explanations and causal mechanisms (Griffiths & Tenenbaum, 2009), and the superficial matching in the characteristics of causes and effects play an important role in the attribution of causal effects (LeBoeuf & Norton, 2012). Additionally, there has been shown that causal strength is influenced by asymmetries in the distribution of values among variables (Cheng, Novick, Liljeholm, & Ford, 2007), and that learners conduct local computations over a limited number of relationships when faced with several possible causes (Fernbach & Sloman, 2009). Finally, research suggest that people are influenced by non-normative tendencies like being sensible to the probability of the outcome even when it does not affect the contingency or the causal power of the independent variable when calculated by bayesian-based models (Vallée-Tourangeau, Murphy, & Baker, 2005).
Both bayesian methods and non-bayesian heuristics for causal inference work different than parametric methods of statistical inference. This fact makes difficult for people to learn statistics because they need to change the way they produce inferences naturally and understand the way in which statistics produce inductive arguments by comparing patterns in data with expectations in probability theory.
How Can the Affordances of Computer-based Tools Support the Learning of Statistics?
The interventions used in this study employed simulations and statistical packages for data analysis. The affordances of these tools support the development of statistical reasoning by addressing the main difficulties in statistical learning; these difficulties are related to the understanding of probability and sampling, as well as the development of skills to use data and represent variability. The next section explains how computers can help to solve common flaws in statistical reasoning.
Simulations. The origin of probabilistic misconceptions relates to problems in the comprehension of mathematical ideas based on mathematical proofs. However, using proofs in statistical teaching requires sophisticated prior knowledge and mathematical skills from students, knowledge and skills that many students lack or that they do not consider an important part of their statistical training (particularly in social sciences). Computers may in fact fulfill a role once reserved for the mathematical proof (Blejec, 2002). With simulations, it is possible to create dynamic representations in which students interact with the properties of mathematical objects. In the case of probability, simulations help learners to observe random behavior that is only visible when events are aggregated over several trials.
In the past, random behavior was represented through formal proofs or explained by physical simulations of random processes (e.g., tossing coins) (see, for example, Schwarz & Sutherland, 1997). Recently, however multimedia computational technology made it possible to show how events aggregated over several occasions create tendencies (Cramer & Neslehova, 2003). Now, with computer-supported tools, it is possible to simulate random processes, condense events over time, and see how tendencies change as a function of different parameters.
Knowledge and recognition of random situations does not emerge spontaneously (Chance et al., 2004; Konold, 1995; Konold et al., 1993) but grows from contact with random mechanisms (Nisbett, Krantz, & Jepson, 1993). Interventions using simulations provide students with an understanding of the random process involved in statistical inference because they make visible those random mechanisms. In a typical simulation, for example, students can change the parameters of the simulation to produce changes in different graphical and numerical indicators that represent stochastic distributions (Batanero et al., 1994; West & Ogden, 1998). In this way, they can see and operate on the results of random processes.
Data analysis software. The capacity of computers to generate representations of data can help learners to operate beyond concrete representations of data (e.g., frequency counts) and to create several representations of statistical concepts or situations. In this sense, computers provide visual representations that can be used as analytical tools (Garfield, 1995). Additionally, statistical packages permit one to conduct authentic research in classroom settings. That is, computers permit students to access large data sets collected from real situations and to explore those sets without the huge computational costs that existed before (Finzer & Erickson, 2005). At a cognitive level, conducting data analysis through statistical packages requires learners to define several aspects of the task. These types of tools permit learners to oscillate among different representations of statistical situations and, in this way, these tools help to develop statistical reasoning skills. Visualizations and data exploration through computers help students to see statistical problems from multiple perspectives, as well as to learn how to make informed decisions among different representations and numerical summaries (Ben-Zvi, 2000; Biehler, 1995; Garfield, 1995). When computers work as graphical devices, it is easy to switch from one representation to a different one and to enhance the use of multiple representations without a large workload being required to produce them (DelMas, Garfield, & Chance, 1999; Snir, Smith, & Grosslight, 1995). In this sense, computers not only provide computational and representational power but also change the structure of the instructional task (Ben-Zvi, 2000): The task is no longer to calculate a statistic or construct a graph; the task is to make adequate decisions on how to organize, represent, and interpret data.
This type of intervention normally requires participants to use statistical packages to analyze data sets coming from authentic or simulated data (Connor, 2002; Conti & Lombardo, 2002; Hooper, 2002; McClain, 2002; Wilensky & Stroup, 1999). This experience helps learners to develop the ability to organize data complexity in patterns that isolate signal from noise (Biehler, 1995). Additionally, the authenticity of data analysis tasks requires students to learn how to build representations in order to make sense of the actions and results during the statistical process (Burgess, 2002; Lehrer & Schauble, 2007), and to deal with variability in the data (Kazak & Confrey, 2004; Petrosino, Lehrer, & Schauble, 2003). Experience with data analysis situations should push learners to develop the skill to conduct representational permutations (Wild & Pafnnkuch, 1999), to build global views of data (Ben-Zvi & Arcavi, 2001), and to develop a deeper understanding of the statistical situation (Ben-Zvi, 2002).
Interventions to teach statistical inference. The advantages of computers for the teaching of inference come from the above-mentioned affordances for the teaching of sampling and data analysis. It is not possible to teach statistical inference directly. Therefore, the sequence and combination of tools devoted for these two spaces is what defines the potential of online resources to impact the understanding of statistical inference. The case of statistical inference is especially interesting because there is a tradeoff between the authenticity of the tasks and the number of simulations or examinations that can be conducted. The effects of this tradeoff need to be explored carefully because statistical inference is at the intersection of data analysis and probability theory. Therefore, understanding it grows from experiencing both data analysis in authentic contexts and repeated simulation in random environments. If the instructional situation favors data analysis in comparison to probabilistic training, students can underestimate the effects of probability on their conclusions. If the instructional situation focuses on fostering probabilistic understanding but ignores the data analysis aspects of inference, students lose perspective on the applied underpinnings of the discipline.
For this reason, it is difficult to cover both spaces (data analysis and sampling) in the same detail. Because of time constraints, either probability or data analysis has to be sacrificed. Both knowledge bases compete. If the decision is to teach probability in depth, then the time for authentic data analysis exercises is reduced. If the focus is on data analysis, students have to discover how to construct and test their own hypotheses, but all of the supporting content, including the probabilistic content, needs to be presented as text due to the time that it takes to conduct an authentic data analysis task. The comparison conducted in this study is imperfect, in the sense that students in both conditions receive the same general ideas, but the amounts of text, examples and exercises vary between them. This imperfection was created on purpose to replicate the tradeoff that statistical educators have to face in real teaching situations.
In general, the predictions of the study are that the amount of activity, not text or examples, devoted to each space will determine the differences in learning. These differences are specific to the statistical space where the activity is placed; that is, higher levels of learning will be found in spaces where the students have more opportunities to get feedback, but not in those spaces where they have more text or examples that do not imply active engagement and feedback. The reason for this prediction is that active engagement allows learners, on one hand, to observe the nature of statistical phenomena over several trials and understand the effects of sampling effects on observable outcomes. Active engagement, on the other hand, allows students to explore the representational possibilities of data analysis, and control the different tools available to them. These effects, however, cannot be achieved through isolated exercises but they require repeated activity in sampling, data analysis or statistical inference. Additionally, it is expected that the change in statistical inference scores will be determined by the combined effects of the change in sampling and data analysis.
Method
Participants
This study was conducted with 85 students from an upper-middle class university in Latin America. All participants were native Spanish speakers with high computer proficiency. Students were part of three middle-level statistics courses for social sciences majors. All courses covered topics from basic descriptive statistics to basic inferential methods including ANOVA and regression. All three courses had focused on exploratory data analysis (EDA) and students were accustomed to work with computer packages for data analysis.
Instruments
Initially, students solved a questionnaire that evaluated their ability to coordinate three processes: the comparison of distribution graphs, the interpretation of statistical test results (ANOVA tables), and the generation of conclusions in context (see Corredor, 2008, for examples of the items). These three processes are basic for the understanding of statistics (Ben-Zvi, 2004; Lehrer & Shauble, 2007; Saldanha & Thompson, 2003; Watson, 2002; Watson & Moritz, 1999). In the second section of the pre and posttest, students responded to a questionnaire devoted to aspects of group comparison and sampling that affected the significance of mean differences (e.g., variance, sample size). In the third section, they engaged in a data analysis task. Finally, students were asked to solve a selection of items from the Advanced Placement Exam (College Board, 2006) and the Comprehensive Assessment of Outcomes in a First Statistics Course (CAOS 4) test (DelMas, Garfield, Ooms, & Chance, 2007).
From all of these measures, it was developed a main questionnaire that is the source of all the findings reported in this study. In this main questionnaire, eight items were designed specifically for this study and eight items were taken either from the AP exam or the CAOS test. Significant correlations between both types of items were found in the pretest (r=.59, p<.01). Items were aligned with the content of the interventions through a coding process in which interventions' information and activities, and pre and posttest questions were classified in each of the statistical spaces (data analysis, sampling and inference). Reliability analyses were conducted on the instruments and they produced acceptable results given the low number of items (α=.76). A factor analysis confirmed that the items were assigned correctly to each statistical space (see Corredor, 2008, p. 85).
Items were classified as data analysis, sampling or inference items (Table 1). Data analysis items required participants to compare two or more distributions represented in different ways; sampling items required students to understand the relationship between population and sample characteristics; and inference items required participants to interpret ANOVA results in real situations. This classification was produced by comparing the goal of the exercise, the elements of the problem that needed to be accounted for, and the input information in each exercise. Items evaluating the same dimension were grouped and three general scores were computed: one for data analysis, one for sampling, and one for inference.
Procedure
The study was a randomized design with two conditions: a data analysis condition and a sampling condition. It was conducted in Latin America with three groups of bilingual college students taking inferential statistics courses. The study was conducted between the 12th and the 14th week of instruction. Students engaged in a pretest task, after which they were assigned randomly within each group/class to one of two interventions aimed at teaching ANOVA. After they completed the intervention, they were evaluated again with a set of activities equivalent to those used before the intervention. The items in the posttest were almost identical to the items in the pretest. The pre and posttest questionnaires had the same structure varying only in the cover stories and in the absolute numerical values of the parameters. The relationship among variables in the questionnaire items was the same for both versions of the test.
Interventions
Students were exposed to one of two interventions: data analysis or sampling. In the data analysis condition, students were asked to go through the sampling distribution and the ANOVA sections of the statistics course of the Open Learning Initiative (OLI) (Open Learning Initiative, 2005). The OLI course was produced by a group of specialists in statistics and online learning, and for this reason, the course is a valid source of disciplinary content (Meyer & Thille, 2006). The course explains the concept of ANOVA by placing it within the broader range of activities that test hypotheses for relationships. In particular, the OLI course explains that the mechanism by which ANOVA compares means is the contrast between explained and unexplained variances. The course provides several occasions for data analysis in which students are given data sets and asked to conduct statistical analysis using either Minitab or Excel. Feedback and assessment opportunities provided by the OLI course were disabled in order to increase the comparability between conditions. In the sampling condition, students were asked to read a study guide that follows similar steps to those in the OLI course, but instead of using data analysis, students were asked to pull random samples using several simulation applets. The instructional time for both interventions was approximately three hours, including the reading of the text and the completion of the exercises.
Data analysis. The data analysis condition required students to go through an instructional experience that combined the sampling distribution and ANOVA sections of the OLI course (Open Learning Initiative). The OLI course shows the "big picture" of statistics, that is the relationship among exploratory data analysis (EDA), probability, and statistical inference. The OLI course provides students with several opportunities to explore data sets using computer packages. Both the use of the programs and the interpretation of the results are modeled in the course through several examples.
In the first pages of the sampling distribution section of the OLI course included in this intervention, students learn the concept of sampling distribution and explore the relationship between sample and population in an authentic example. After that, students go through the ANOVA section of the OLI course. This section explains ANOVA's logic and how this procedure allows researchers to test hypothesis. The first page presents the introduction to ANOVA. In this introduction, ANOVA is regarded as a procedure to evaluate the relationship between a categorical independent variable with two or more groups and a dependent continuous variable. This introduction indicates also that evaluating this relationship implies comparing the group means of the categories defined by the independent variable. Included in the introduction is an example that organizes the explanation across the chapter; the example is a study of the relationship between academic major and frustration scores. The second page explains that ANOVA's F-test works in a different way than other inferential tests because the hypothesis used in ANOVA is not directional. The third page explains the "idea behind the ANOVA F-test" using two pseudo-authentic scenarios (that is, two possible configurations of data for the example mentioned above). The idea of ANOVA, according to this text, is that it compares within- and between- group variances to draw conclusions about the sample mean differences (e.g., "when the variation within group is large (like in scenario #1), the variation (differences) among the sample means could become negligible and the data have very little evidence against Ho"). On the fourth page, the same idea is restated and a short quiz is given. After that, the text continues with an explanation of how the degrees of freedom affect the interpretation of ANOVA results. Alongside this text, the assumptions of ANOVA are presented and instantiated in an example. On the fifth page, the meaning and location of the p-value are explained. Finally, the text provides a very short explanation about how p-values can be interpreted in context. The sixth page presents a worked-out example of ANOVA,s use; this example presents a research question that delves into the relationship between the educational level of a journal and the number of words in its ads. Included in this page is a "learning by doing" exercise that asks students to conduct a complete ANOVA analysis using Excel. This exercise is highly ill-defined. Students are given a set of data, and they have to build an interpretation of it, without much guidance. This fact requires students to make representational decisions and to organize the different steps of the data analysis. The seventh page presents some final comments on the interpretation of the results of ANOVA.
Sampling. In this condition, students went through an instructional experience built on the same ideas of the OLI course. This intervention asked students to use simulations instead of data analysis to learn ANOVA. Initially, students were asked to use a random-sampling simulator available at http://statweb.calpoly.edu/chance/applets/Shopping/Shopping.html. This random-sampling applet allowed them to draw samples from a population while controlling the sample mean and the standard deviation. In order to explain why ANOVA is necessary to evaluate mean differences, students were asked to draw several samples from the population and to write down the means of the obtained samples. Then read an explanation explaining that drawing a sample is equivalent to collecting data on a given phenomenon. The instruction provided in this part of the intervention suggested that it is impossible to observe all the possible instances of a given phenomenon, and that therefore sampling is a necessary part of scientific research. At this point, the students solve exercises related to the variability of the samples. After that, students were asked basically to think why samples obtained from the same population have different sample means, and then they were asked to consider how researchers can be sure of the accuracy of their research conclusions. The instruction then suggested that sampling creates variability but that sampling variability is not unpredictable. Samples vary within certain ranges that depend on the parameters of the population. To prove that, students were asked to draw a large number of samples (n=40) and use a sample counter -available in the same applet- to quantify the number of samples under or below certain limits. The next step was to extend these conclusions to the case of two populations with different means. Students sampled from each population and had to find out how many sample means fell within a common range for both groups. They, then, repeated the same exercise but this time they sampled from the same population. At this point students were asked to compare the means from the one-population sampling and the means from the two-population sampling. Then, students repeated the same exercises but they played with different parameters (sample size and standard deviation) to establish how those parameters affect the confidence in the observed mean difference. Finally, there was an explanation about how ANOVA helps researchers to identify whether a difference is the result of either systematic effects or random sampling.
At this point, the intervention explained that the idea behind ANOVA is the comparison of within- and between- group variability. To explain this idea, the intervention used two new applets. One of these applets visualized the relationship between explained and unexplained variance in a pie diagram (http://www.ruf.rice.edu/~lane/stat_sim/one_way/index.html). In the right half of the applet, three vertical lines represented three different groups in an ANOVA. In each line, black dots represented the data points (individual scores) and a red line represented the mean of the group. Students had seven data sets to work with. Once the data set was uploaded, students could move the points (black slots) in each line. The applet automatically modified the numerical indicators presented in an ANOVA table in the lower part of the diagram, and also modified the relationship between explained and unexplained variance depicted in the pie diagram. This part of this intervention asked students to use this applet to visualize the relationship between explained and unexplained variance in a small data set. Students were asked to move the points in the graph to obtain different amounts of explained variability. They had to find out which data configuration produced larger explained variance results.
The other applet permitted students to sample from three groups while controlling population and sample parameters (available at http://www.rossmanchance.com/applets/Anova/Anova.html). Students controlled the means of the three populations, and the size and standard deviation of the samples. The results for each group could be displayed as histograms (dotplots) or as boxplots (see Figure 1). Numerical results were presented as an ANOVA table in the bottom of the applet. The probability of obtaining each sample was displayed as a red band in an ANOVA distribution graph. Sampling results were not accumulated in any graph of this applet.

Using this applet, students were asked to draw 10 samples from a situation where the populations had small mean differences. Then, they had to draw 10 samples from a situation where the populations had large mean differences. Participants should explore the difference between the configurations of data in those two situations and find out that large mean differences produced higher levels of explained variance in the applet. The next step asked students to play with sample size and variability (standard deviation) to see how those parameters affected the obtained samples. The final question in this exercise was about the meaning of the p-value in this context according to the result of the simulations.
Coding of the Interventions
Interventions were coded in terms of idea units to specify the type of information and the type of activity students were receiving in each condition. Idea units were defined as a non-redundant proposition (subject plus predicate) that were propositionally independent from each other (Chafe, 1985). The codification showed that students received the same content, but the amount of text, examples and exercises varied among the different interventions (Figure 2). This difference was created in part by the different constraints and affordances of simulations and data analysis tools (for a more detailed cognitive analysis of the interventions, for examples of the interventions and for a description of the segmentation and coding of the idea units, see Corredor, 2008).

The amount of activity in each statistical space was coded in order to make visible the differences in the intensity of the students' activity. Since the construction of the idea units map showed that both interventions covered the same content (Corredor, 2008), the differences in students' learning must have been due to differences in the amount of activity in each intervention. The sampling intervention employed simulations that permitted students to solve a large number of short, well-defined exercises. The data analysis intervention, on the other hand, used an ill-defined exercise that required students to conduct a data analysis task, similar to the tasks of authentic statistical practice. This exercise however was long and time consuming, and therefore only one exercise fitted within the instructional time. For this reason, this intervention had few opportunities for activity and feedback. This difference poses a critical point in understanding students' learning gains during the study.
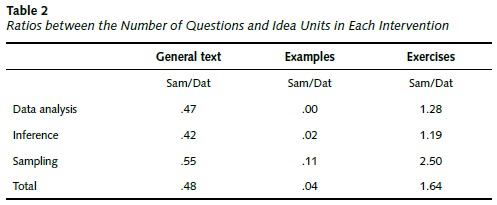
The results in Table 2 show the data analysis intervention had more text and examples in any space than the sampling intervention, and the sampling intervention had more exercises devoted to sampling than the data analysis intervention. This asymmetry has important consequences for the evaluation of students' gains; students in the data analysis condition read significantly more text and explored more examples in any statistical space than students in the sampling condition. On the other hand, students in the sampling condition had higher levels of activity in the sampling space than students in the data analysis condition.
Results
Effects of Data Analysis and Simulations on the Learning of Statistics
In general terms, the students in the sampling condition performed better than the students in the data analysis condition. The change in the sampling scores was greater than the change in the data analysis scores for both groups. It is important to note that the data analysis scores were higher than the sampling scores in the pretest for both groups. The change in the inference scores was somewhere between the change in data analysis knowledge and the change in sampling knowledge. No significant differences between the averages of both conditions were found in the pretest scores.
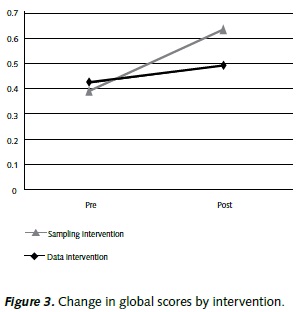
The intervention effects were analyzed using a mixed ANOVA model in which the treatment was assigned as the between subjects factor, the pre, posttest change was assigned as the within subject factor, and group -the course of the students- as a nested factor within intervention. These analyses indicated that both the pre-posttest variable and the interaction between the pre-posttest variable and the intervention had significant effects on the global scores. In other words, the results showed that there was a significant change in the global scores from the pretest to the posttest (F(1,78)=25.78, p<.01), and that the trajectories of change were different for participants in different treatment conditions (F(1,78)=7.71, p<.01) (Figure 3). Group effects, that are the differences between the courses participating in this study, were not significant.
However, when pre and posttest scores were disaggregated into the sampling, data analysis, and inference parts of the test, it was clear that the change from pretest to posttest was produced mainly by gains in the sampling knowledge (Figure 4). When a mixed ANOVA was calculated for the sampling scores, the pre-posttest change continued being significant (F(1, 78)=40.52, p<.01), as well as the interaction between pre-posttest change and intervention (F(1,78)=8.47, p<.01). No group effects were found. The situation was different for the data analysis scores. The mixed ANOVA results indicated that neither the change in time (F(1, 78)=2.26, p>.05), nor the interaction between time and intervention (F(1, 78)=2.01, p>.05) were significant.

With respect to the inference scores, the mixed ANOVA results indicated that there is a strong change from pretest to posttest (F(1, 78)=18.03, p<.01), and a moderate interaction between pre-posttest change and intervention (F(1, 78)=3.71, p<.10). The change is stronger for participants in the sampling intervention (from .36 to .61) than for the participants in the data analysis condition (from .35 to .43). There is a moderate effect of group -the course of students- in the change in inference scores (F(4, 78)=2.62, p<.05). An explanation for this result is that change in the inference scores was related to gains in sampling knowledge produced by the interventions, but it was not related to gains in the inference knowledge itself; this possibility will be explored later.
All of the analyses presented in this section were double-checked using adjusted ANCOVAs on posttest scores, controlling for pretest scores and using the intervention as the between-subjects factor. This analysis revealed the same picture regarding the changes in the participants during the study: strong effects for sampling knowledge, moderate effects for inference knowledge, and no effects for data analysis knowledge. The effect sizes of condition for this analysis as reported by the η2 values in the adjusted ANCOVAs are .10 for the global scores, .11 for the sampling scores, .03 for the data analysis scores, and .07 for the inference scores.
The question that needs to be solved at this point is why the data analysis intervention did not produce gains in data analysis knowledge. It is not a ceiling effects because the pretest scores in the data analysis condition are in the middle of the scale (around 50%). The explanation has to do with the levels of activity available in each condition. The data analysis condition has a reduced number of exercises in data analysis because each exercise takes a long time. As explained, exercises in this condition are designed to resemble authentic data analysis situations, students have to build the analysis from scratch, from organizing the data to running the statistical programs and interpreting the results. On the other hand, the sampling intervention provides students with more exercises because the exercises in this condition are short. This effect of the amount of activity on learning happens in all conditions and statistical spaces (Figure 5).
Interaction between Sampling, Data Analysis and Inference Knowledge Bases
As pointed out in the theoretical review, statistical inference is, from a cognitive point of view, the product of combining data analysis and sampling knowledge bases. Therefore, it is expected that there is a strong relationship between changes in data analysis and sampling knowledge with the gains in the ability to solve inference problems. This hypothesis was tested by building a mixed linear model with a variance components (VC) covariance structure that specified pre-posttest change in inference scores as the dependent variable, change in sampling and data analysis scores as covariates, and the intervention as between subjects factor.
The results of this analysis, displayed in Table 3, show clearly that change in data analysis and sampling scores predicts the change in students' inference scores. The results of this analysis indicate also that intervention plays a role in this process. The broader picture depicted by the holistic models presented in this article shows that changes produced by the intervention were significant for sampling knowledge. The inference scores, although affected moderately by the interventions, were related to small changes in students' data analysis knowledge and to strong changes in students sampling knowledge.
Conclusion
The findings presented in this study need to be articulated to explain both the gains in the sampling scores observed in the sampling intervention and the lack of change in the data analysis scores in the data analysis condition. The differences seem to be related to the number of exercises in each condition. The data analysis intervention contains fewer exercises than the sampling intervention because authentic exercises are time-consuming and this fact limits the number of exercises that can be presented in the time frame of the intervention. For this reason, simulations seem to be a better option. They provide learners with more intensive activity in similar timeframes than data analysis exercises. For this reason they produce larger gains in probability knowledge. This result indicates that there is a tradeoff between the authenticity and the number of exercises that can be conducted in a given instructional session. Asking students to conduct the data analysis task from scratch is important, because they grow familiar with the basic process of statistical activity, from organizing information into data bases to interpreting statistical reports. However, this authenticity comes with a cost: few exercises by time unit. This tradeoff needs to be accounted for researchers and instructional designers in statistical education.
References
Batanero, C., Godino, J., Vallecillos, A., Green, D., & Holmes, P. (1994). Errors and difficulties in understanding elementary statistical concepts. International Journal of Mathematics Education in Science and Technology, 25 (4), 527-547.
Ben-Zvi, D. (2000). Towards understanding the role of technological tools in statistical learning. Mathematical Thinking and Learning, 2 (1), 127-155.
Ben-Zvi, D. (2002). Seventh grade student’s sense making of data and data representations. Retrieved from http://www.stat.auckland.ac.nz/~iase/publications/1/2c5_benz.pdf
Ben-Zvi, D. (2004). Reasoning about variability in comparing distributions. Statistics Educational Research Journal, 3 (2), 42-63.
Ben-Zvi, D. & Arcavi, A. (2001). Junior high school students’ construction of global views of data and data representations. Educational Studies in Mathematics, 45, 35-65.
Biehler, R. (1995). Probabilistic thinking, statistical reasoning, and the search of causes: Do we need a probabilistic revolution after we have taught data analysis? Newsletter of the international study group for research on learning probability and statistics, 8 (1).
Blejec, A. (2002). Teaching statistical concepts with simulated data. Retrieved from http://www.stat.auckland.ac.nz/~iase/publications/1/7b3_blej.pdf
Buehner, M., Cheng, P., & Clifford, D. (2003). From covariation to causation: A test of the assumption of causal power. Journal of Experimental Psychology: Learning, Memory and Cognition, 29 (6), 1119-1140.
Burgess, T. (2002). Investigating the ‘data sense’ of preservice teachers. Retrieved from http://www.stat.auckland.ac.nz/~iase/publications/1/6e4_burg.pdf
Cai, J. & Gorowara, C. C. (2002). Teachers’ conception and constructions of pedagogical representations in teaching arithmetic average. Retrieved from http://www.stat.auckland.ac.nz/~iase/publications/1/2c1_cai.pdf
Chafe, W. L. (1985). Linguistic differences produced by differences between speaking and writing. In D. R. Olson, N. Torrace, & A. Hildyard (Eds.), Literacy, language and learning. The nature and consequences of reading and writing (pp. 105-123). Cambridge: Cambridge University Press.
Chance, B., DelMas, R., & Garfield, J. (2004). Reasoning about sampling distributions. In D. Ben-Zvi & J. Garfield (Eds.), The challenge of developing statistical literacy, reasoning, and thinking (pp. 295323). Dordrecht, The Netherlands: Kluwer.
Cheng, P. (1997). From covariation to causation: A causal power theory. Psychological Review, 104 (2), 367-405.
Cheng, P. W., Novick, L. R., Liljeholm, M., & Ford, C. (2007). Explaining four psychological asymmetries in causal reasoning: Implications of causal assumptions for coherence. In M. O’Rourke (Ed.), Topics in contemporary philosophy: Explanation and causation (Vol. 4, Ch. 1, pp. 1-32). Cambridge: MIT Press.
College Board. (2006). AP statistics 2006 free-response questions. Retrieved from http://www.collegeboard.com/prod_downloads/student/testing/ap/statistics/ap06_frq_statistics.pdf
Connor, D. (2002). Censusatschool 2000: Creation to collation to classroom, UK. Retrieved from http://www.stat.auckland.ac.nz/~iase/publications/1/2d1_conn.pdf
Conti, C. & Lombardo, E. (2002). The Italian census at school. Retrieved from http://www.stat.auckland.ac.nz/~iase/publications/1/4e1_cont.pdf
Cordoba, M. (2007, August). Conjunctive causal judgement using categorical and continuous variables. Proceedings 29th Annual Conference of the Cognitive Science Society, Nashville, Tennessee, USA.
Corredor, J. (2008). Learning statistical inference through computer-supporter simulation and data analysis (Unpublished Doctoral Dissertation). Retrieved from http://d-scholarship.pitt.edu/6683/1/CorredorJ_etdPitt2008nb.pdf
Cramer, E. & Neslehova, J. (2003, August). (e)Learning the basics of probability. Paper presented at the International Association of Statistical Education Conference on Statistics Education and the Internet, Satellite Conference to the 54th Session of the International Statistical Institute (ISI), Berlin, Germany.
DelMas, R., Garfield, J., & Chance, B. (1999). A model of classroom research in action: Developing simulation activities to improve students’ statistical reasoning. Journal of Statistics Education, 7 (3).
DelMas, R., Garfield, J., Ooms, A., & Chance, B. (2007). Assessing students, conceptual understanding after a first course in statistics. Statistics Education Research Journal, 6 (2), 28-58.
Dreyfus, T. & Eisenberg, T. (1996). On different facets of mathematical thinking. In R. J. Sternberg & T. Ben-Zeev (Eds.), The nature of mathematical thinking (pp. 253-284). Hillsdale, NJ: Lawrence Erlbaum Associates.
Fernbach, P. & Sloman, S. (2009). Causal learning with local computations. Journal of Experimental Psychology: Learning, Memory, and Cognition, 35 (3), 678-693.
Finzer, W. & Erickson, T. (2005). Curriculum innovations using census microdata: A meeting of statistics, mathematics and social science. In G. Burrill & M. Camden (Eds.), Curriculum development in statistics education: International association for statistics education 2004 roundtable (190-203). Voorberg, the Netheralnds: International Statistical Institute.
Gal, I., Rothschild, K., & Wagner, D. A. (1990, April). Statistical concepts and statistical heuristics in school children: Convergence or divergence? Paper presented at the Annual Meeting of the American Educational Research Association, Boston, Massachusetts, U.S.A.
Garfield, J. (1995). How students learn statistics. International Statistical Review, 63, 25-34.
Garfield, J. (2002). The challenge of developing statistical reasoning. Journal of Statistics Education, 10 (3), 58-69.
Garfield, J. & Ben-Zvi, D. (2005). A framework for teaching and assessing reasoning about variability. Statistics Education Research Journal, 4 (1), 92-99.
Greville, J. & Buehner M. (2007). The influence of temporal distributions on causal induction from tabular data. Memory and Cognition, 35 (3), 444-453.
Griffiths, T., Sobel, D., Tenenbaum, J., & Gopnik, A. (2011). Bayes and blickets: Effects of knowledge on causal induction in children and adults. Cognitive Science, 35 (8), 1407-1455.
Griffiths, T. & Tenenbaum, J. B. (2005). Structure and strength in causal induction. Cognitive Psychology, 51, 334-384.
Griffiths, T. & Tenenbaum, J. (2009). Theory-based causal induction. Psychological Review, 116 (4), 661-716.
Hooper, L. (2002). Making census count in the classroom. Retrieved from http://www.stat.auckland.ac.nz/~iase/publications/1/4e2_hoop.pdf
Kahneman, D. & Tversky, A. (1972). Subjective probability: A judgment of representativeness. Cognitive Psychology, 3 (3), 430-453.
Kazak, S. & Confrey, J. (July, 2004). Investigating educational practitioners’ statistical reasoning in analysis of student outcome data. Paper presented at the Tenth International Conference of Mathematical Education, Copenhagen, Denmark. Paper Retrieved from http://www.stat.auckland.ac.nz/~iase/ publications.php?show=11
Konold, C. (1989). Informal conceptions of probability. Cognition and Instruction, 6, 59-98.
Konold, C. (1995). Issues in assessing conceptual understanding in probability and statistics. Journal of Statistics Education, 3 (1), 1-9.
Konold, C., Pollatsek, A., & Well, A. (1997). Students analyzing data: Research of critical barriers. In J. B. Garfield & G. Burrill (Eds.), Research on the role of technology in teaching and learning statistics (pp. 151-168). Voorburgh, The Netherlands: ISD.
Konold, C., Pollatsek, A., Well, A. D., Lohmeier, J., & Lipson, A. (1993). Inconsistencies in students’ reasoning about probability. Journal for Research in Mathematics Education, 24, 392-414.
LeBoeuf, R. & Norton, M. (2012). Consequence-cause matching: Looking to the consequences of events to infer their causes. Journal of Consumer Research, 39 (1), 128-141.
Lehrer, R. & Schauble, L. (2007). Contrasting emerging conceptions of distribution in contexts of error and natural variation. In M. Lovett & P. Shah (Eds.), Thinking with data. Mahwah, NJ: Lawrence Erlbaum Associates.
Leinhardt, G., Zaslavsky, O., & Stein, M. K. (1990). Functions, graphs and graphing: Tasks, learning and teaching. Review of Educational Research, 60 (1), 1-64.
McClain, K. (2002). Uses of interactive minitools to explore authentic data with teachers to create individual and collective thinking. Retrieved from http://www.stat.auckland.ac.nz/~iase/publications.php?show=1
Meyer, O. & Thille, C. (2006). Developing statistical literacy across social, economic and geographical barriers using a “stand-alone” online course. Retrieved from http://www.stat.auckland.ac.nz/~iase/publications/17/6C3_MEYE.pdf
Nisbett, R., Krantz, D., & Jepson, C. (1993). The use of statistical heuristics in everyday inductive reasoning. In R. Nisbett (Ed.), Rules for reasoning (pp. 15-54). Mahwah, NJ: Lawrence Erlbaum Associates.
Open Learning Initiative. (2005). Introduction to Statistics. Retrieved from http://www.cmu.edu/oli.
Petrosino, A. J., Lehrer, R., & Schauble, L. (2003). Structuring error and experimental variation as distribution in the fourth grade. Mathematical Thinking and Learning, 5 (2-3), 131-156.
Saldanha, L. & Thompson, P. (2003). Conceptions of sample and their relationship to statistical inference. Educational Studies in Mathematics, 51, 257-270.
Schwarz, C. & Sutherland, J. (1997). An On-line workshop using a simple capture-recapture experiment to illustrate the concepts of a sampling distribution. Journal of Statistics Education, 5 (1).
Snir, J., Smith, C., & Grosslight, L. (1995). Conceptually enhanced simulations: A computer tool for science teaching. In D. Perkins, J. Schwartz, M. Maxwell, & M. Stone (Eds.), Software goes to school (pp. 106129). New York: Oxford U. Press.
Tversky, A. & Kahneman, D. (1974). Judgment under uncertainty: Heuristics and biases. Science, 185, 1124-1131.
Vallée-Tourangeau, F., Murphy, R., & Baker, A. (2005). Contiguity and the outcome density bias in action-outcome contingency judgements. The Quarterly Journal of Experimental Psychology, 58 (2), 177-192.
Watson, J. M. (2002). Inferential reasoning and the influence of cognitive conflict. Educational Studies in Mathematics, 51 (3), 225-256.
Watson, J. M. & Moritz, J. B. (1999). The beginning of statistical inference: Comparing two data sets. Educational Studies in Mathematics, 37, 145-168.
West, R. W. & Ogden, R. T. (1998). Interactive demonstrations for statistics education on the world wide web. Journal of Statistics Education, 6 (3).
Wild, C. J. & Pfannkuch, M. (1999). Statistical thinking in empirical enquiry. International Statistical Review, 67 (3), 223-265.
Wilensky, U. & Stroup, W. (1999). Participatory simulations: Network-based design for systems learning in classrooms. Proceeding of the Conference on Computer-Supported Collaborative Learning, Stanford University.
How to Cite
APA
ACM
ACS
ABNT
Chicago
Harvard
IEEE
MLA
Turabian
Vancouver
Download Citation
Article abstract page views
Downloads
License
The RCP is published under the Creative Commons license and can be copied and reproduced according to the conditions of this license (http://creativecommons.org/licenses/by-nc-nd/2.5). RCP articles are available online at https://revistas.unal.edu.co/index.php/psicologia/issue/archive. If you would like to subscribe to the RCP as reader, please go to https://revistas.unal.edu.co/index.php/psicologia/information/readers and follow the instructions mentioned in the webpage. Additionally, a limited number of print journals are available upon request. To request print copies, please email revpsico_fchbog@unal.edu.co.