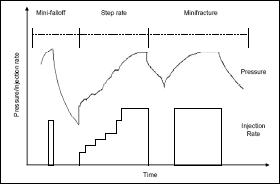
Figure 1. Calibration Treatment Sequence
INTERPRETACION DE PRUEBAS DE INYECCION EN YACIMIENTOS NATURALMENTE FRACTURADOS
INTERPRETATION OF AFTER CLOSURE TESTS IN NATURALLY FRACTURED RESERVOIRS
OSCAR URIBE
Ingeniería de Petróleos, M.Sc, SPT Group, oscar.uribe@sptgroup.com
DJEBBAR TIAB
Ingeniería de Petróleos, Ph.D, Universidad de Oklahoma,
USA, dtiab@ou.edu
DORA PATRICIA RESTREPO
Ingeniería de Petróleos, Ph.D, Universidad de Oklahoma,
USA, Universidad Nacional de Colombia, dprestre@ou.edu
Recibido para revisar Agosto 23 de 2007, aceptado Diciembre 12 de 2008, versión final Enero 25 de 2008
RESUMEN: Este estudio presenta un nuevo método para determinar la transmisibilidad en yacimientos naturalmente fracturados usando el análisis del flujo radial en pruebas de calibración. El método se basa en el análisis del comportamiento de la derivada de la presión con el tiempo. El objetivo es simplificar y facilitar la identificación del flujo radial y la “garganta” característica que se observa en la derivada cuando se tienen yacimientos naturalmente fracturados. El método propuesto no requiere el conocimiento previo de la presión de yacimiento. Un grafico logarítmico es usado para determinar la permeabilidad, la presión promedio, el almacenamiento y el coeficiente que relaciona las permeabilidades s de la matriz y de las fracturas en el yacimiento.
PALABRAS CLAVE: Yacimientos naturalmente fracturados, pruebas de flujo, TDS.
ABSTRACT: A new method for the determination of reservoir transmissibility using the after closure radial flow analysis of calibration tests was developed based on the pressure derivative. The primary objective of computing the pressure derivative with respect to the radial flow time function is to simplify and facilitate the identification of radial flow and the characteristic trough of a naturally fractured reservoir. The proposed method does not require a-priori the value of reservoir pressure. Only one log-log plot is used to determine the reservoir permeability, average pressure, storativity ratio, and interporosity flow coefficient.
The main conclusion of this study is that small mini-fracture treatments can be used as an effective tool to identify the presence of natural fractures and determine reservoir properties.
KEY WORDS: Naturally fractured reservoirs, Tiab’s direct technique (TDS), after closure analysis, mini-frac.
1. INTRODUCCION
Using the theory of impulse testing and principle of superposition, Nolte et al [1] developed a method which allows the identification of radial flow and thus the determination of reservoir transmissibility and reservoir pressure. The exhibition of the radial flow is ensured by
conducting a specialized calibration test called mini-fall off test. Benelkadi and Tiab [2] proposed a new procedure for determining reservoir permeability and the average reservoir pressure in homogeneous reservoirs. In this paper, the procedure is extended to naturally fractured reservoirs.
2. INJECTION TEST AND NATURALLY FRACTURED RESERVOIRS
The mini-frac injection test has permitted the determination of the reservoir description in homogeneous reservoirs where fluid leakoff is dependent on the matrix permeability, fluid viscosity, and reservoir fluid compressibility. Applying this type of test to naturally fractured reservoirs introduces new factors that are difficult to measure, e.g. fluid leakoff dominated by the natural fractures that vary with stress or net pressure. This study allows the identification of naturally fractured reservoirs from after closure tests and the estimation of their respective reservoir parameters.
2.1 Naturally Fractured Reservoirs
Because of the complexity in the
geometry of naturally fractured reservoirs, different mathematical approaches
have been developed for diverse geometric shapes in an effort to simulate the
effect of matrix block shapes in the transition period. One of the most popular
approaches was proposed by Warren and Root [3]. They introduced two parameters
that they referred to as the storativity ratio (ω) and the interporosity flow coefficient (λ)
to characterize naturally fractured reservoirs.
2.2 Injection Test
In the last two decades, mini fracture injection tests -also called calibration
treatments or injection tests- have been developed to diagnose features including
interpretation of near wellbore tortuosity and perforation friction, fracture
height growth or confinement, pressure-dependent leak-off, fracture closure,
and more recently transmissibility and permeability.
Frequently, a calibration treatment is a test done right before the main stimulation treatment. This test follows a similar fracture treatment procedure but conducted, generally, without the addition of proppant, causing the fracture to have negligible conductivity when it closes. The short fracture created in this test allows the connection between the undamaged formation and the wellbore. Pressure analysis is based simultaneously on the principles of material balance, fracturing fluid flow, and rock elastic deformation (solid mechanics).
The calibration treatment sequence is shown in Figure 1, and consists of the following tests: mini fall off, step rate and mini-fracture test.

Figure 1. Calibration Treatment Sequence
2.1.1 Mini-falloff Test
The test is performed using inefficient fluids and a low injection rate. These
characteristics make that the long term radial flow behavior that normally
occurs only after a long shut-in period, can be attained during injection or
shortly after closure in the mini-fall off test. This test allows the integration
of information for analysis of pre- and after- closure analysis.
2.1.2 Step Rate Test
The step rate test is used to estimate fracture extension pressure and respective
rates, thereby, determining the horsepower required to perform the fracture
treatment.
2.1.3 Mini-fracture Test
Gathering the information obtained by the first two tests of the calibration
treatment (a breakdown test may be also implemented into the treatment sequence),
a mini-fracture test is performed. The determination of fracture propagation
and fracture geometry during pumping is obtained by the implementation of Nolte-Smith
[4] plot. This test is conducted with the fracturing fluid at the fracturing
rate similar to the main fracturing treatment, but on a small scale. Figure
2 presents the fracturing evolution; each stage provides information for the
fracture treatment design. This study is focused on the zone labeled as transient
reservoir pressure near the wellbore.
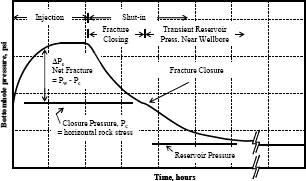
Figure
2. Example of fracturing-related pressure
In fact, natural fracture reservoirs enhanced fluid loss leading to a premature closing in the hydraulic fracture. In the cases that matrix permeability is high, the fluid leakoff process is not affected for the natural fractures; however, if matrix permeability is low the transmissibility of the natural fractures could be higher than the one from the matrix.
2.3 Closure pressure and closure time
There are several methods in the literature for estimating closure pressure
and closure time. Basically, this is the initial point for this study because
the research is based on the pressure response after the fracture closes mechanically.
For the purposes of this study, the estimation of closure pressure and closure time follows the method presented by Jones et al [5]. They related the value of the fracture closure pressure to the minimum horizontal stress by the implementation of a derivative algorithm to identify different flow regimes.
The two relationships for an infinite conductivity fracture flow and finite conductivity fracture are, respectively:

Where A and A’ are grouping independents parameters, such as permeability, viscosity, and compressibility, for infinite and finite conductivity fracture flow respectively.
Taking the logarithm on both sides of equations 1 and 2, and then differentiating them in respect to the logarithm of time:
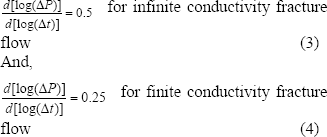
Then, a Cartesian plot of pressure derivative versus time would show a straight line of slope zero at a value of 0.5 for infinite conductivity, and 0.25 for finite conductivity. Jones et al [5] recommend to identify the closure pressure (Pc) at the pressure value corresponding to the end of the infinite conductivity fracture flow (te). In case the infinite conductivity fracture flow is not observed, the recommendation is to read the value of pressure corresponding to the first point of the straight line of the finite conductivity fracture flow (ts) as the value of closure pressure (see Figure 3 and Figure 4). The closure time can be obtained by adding the pumping time, tp to te or ts. The effect of skin will cause that the straight lines, representing the infinite and finite conductivity fracture flow, to not have the values of 0.5 and/or 0.25, respectively, in the derivative.
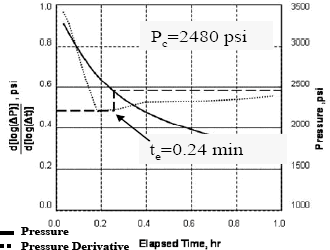
Figure 3. Example of estimation of closure pressure
(Pc) and ending time (te) in presence of infinite conductivity
fracture flow
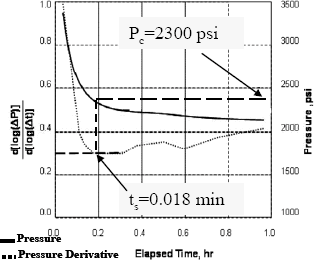
Figure 4. Example of estimation of closure pressure
(Pc) and starting time (ts) in presence of finite conductivity
fracture flow
2.4 After-Closure Methods
The basis for After Closure Analysis (ACA) was initially proposed by Gu et
al [6] and Abousleiman et al [7]. They demonstrated that properties of the
injected fluid do not have any effect on the pressure response, acting like
a skin effect because it is isolated to the near well area.
Transient pressure response is dominant within the reservoir exhibiting linear or radial flow, losing its dependency from the mechanical response of an open fracture. This late time pressure falloff would be a good representation of the reservoir response allowing the estimation of reservoir pressure and permeability. The after closure response is similar to the behavior observed during conventional well test analysis, supporting an analogous methodology for its evaluation.
Nolte [8] introduced the concept of apparent time function. The after closure time function is selected to define various combinations of the reservoir parameters, including the estimation of closure time and reservoir pressure. The main assumptions of this dimensionless time function are the fracture closes instantaneously when pumping is stopped (tc = tp) and significant spurt loss occurs. The concept of an apparent exposure time for the constant pressure period, as considered for a propagating fracture, is expressed as [8]:
![]()
The minimum value for time (t) in Equation 5 corresponds to the time that fracture closes (tc). This means that for t = tc the value of the after-closure dimensionless time function, F(t), is equal to the unity. Therefore, the maximum value achieved by the dimensionless time function is unity and its value decreases when real time increases. The term χtc symbolizes an apparent time of closure, or equivalently, time of exposure to fluid loss and χ»1.62.
An excellent approximation for Equation 5 with an error percent less than 5% for t > 2.5tc is given by [9]:
![]()
F2 approaches the equivalence of Horner behavior, achieving the time behavior of linear and radial flow from a single function. In fact, the mini-frac injection test is similar to the slug test or the impulse test.
Then, the instantaneous source solution is applied to the diffusivity equation in order to model the pressure response of the reservoir. This concept implies a sudden extraction or release of fluid at the source in the reservoir creating a pressure change throughout the system. The sources are distributed until the fracture closes and there is no more leakoff into the formation. Abousleiman et al [7] define the after closure pressure response as a result of instantaneous point source solution by applying Duhamel’s principle of superposition for time t ≥ tc:

3. MATHEMATICAL MODEL
Conventional pressure transient tests in low permeability reservoirs require a long duration to observe all flow regimes necessary for determining correctly all reservoir and near-wellbore parameters. The cost of these tests is generally very high because of additional equipment and production. Short-time tests, such as drill stem test and impulse test, provide local estimations of the properties in the reservoir that are usually contaminated by near-wellbore damage. Alternatively, the calibration test, as discussed previously, follows a procedure similar to the hydraulic fracturing treatment but only a small fracture is induced in the formation to overcome formation damage. The pressure response during a calibration test is estimated by the instantaneous line source solution of the diffusivity equation. The mathematical approach discussed in this section is specifically for the calibration test. The following assumptions are made: 1) the fracture and matrix are distributed homogeneously throughout the formation, 2) reservoir is fractured by a fluid injection and this created fracture has a constant height equal to the reservoir height, 3) the fluid injection has the same property as the reservoir fluid, 4) the fracture created is a Perkins-Kern-Nordgren type (PKN) [9], [10], 5) closed fracture is of zero conductivity (hydraulically and mechanically) and 6)natural fractures do not close.
Following a procedure similar to the one Benelkadi and Tiab [2] proposed for conventional reservoirs, the response of pressure difference and pressure derivative versus an apparent function of time for naturally fractured reservoirs is expected to show a trend similar to the one in conventional techniques. F2 is a time function similar to Horner time; therefore, late times correspond to low values of F2, and early times to values of F2 close to unity. The maximum value of F2 is unity, which corresponds to the value of closure time. Therefore, the expected shape obtained by this method is shown in Figure 3.
Similarly to the TDS (Tiab’s Direct Synthesis) technique in naturally fractured reservoirs, it is possible to identify unique characteristic points from Figure 5 for calculating various reservoir parameters. The nomenclature for these points is:
(F2×ΔP’)R radial flow, psi
F21 beginning of the trough
F22 base of the trough
F23 end of the trough
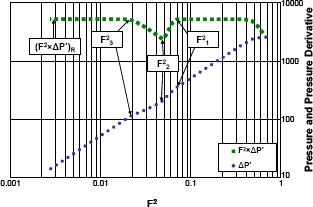
Figure 5. Idealized
sketch of the characteristic points detected on a logarithmic plot of pressure
and pressure derivative versus F2
3.1 Intermediate
time appreciation of the trough F2 Procedure
Analogous to the TDS technique, the plot of pressure and pressure derivative
versus F2 shows a trough at intermediate times. Previous
investigations [11], [12] have proven that a logarithmic plot of pressure derivative
versus dimensionless time allows the identification of characteristic points
for calculating storativity ratio and interporosity coefficient at the
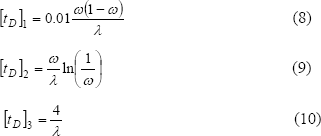
Defining dimensionless time as:
![]()
After mathematical manipulation of Nolte’s apparent time function approximation (i.e. Eq. 6) and combining it with dimensionless time (i.e. Eq. 11) in function of F2 the following equations are obtained at the beginning, base, and end of the trough, respectively:
![]()
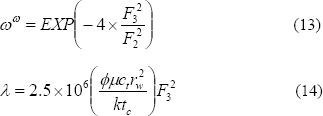
In order to calculate ω by Equation 12 we must first determine the value of the right side of the equation; then read the value of the corresponding ω from Figure 6 (for ω < 50%). The following correlation is obtained from Figure 6:

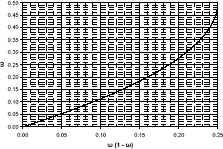
Figure
6. Graphical representation of ω versus ω(1-ω)
It is important to notice that this correlation implies 0 ≤ ω ≤ 0.45 and 0 ≤ A ≤ 0.25. Furthermore, Figure 6 shows that the value of ω(1-ω) varies between 0 and 0.25. This range allows the estimation of ω from reading the values of F21 and F23 and the quadratic solution of Equation 12 without obtaining imaginary results. Substituting for A into Eq. 15 yields:

From Figure 6 only the negative solution of the quadratic solution is applicable (values of storativity in the range of 0 < ω < 0.5); therefore ω can also be calculated from the following equation:

To calculate ω by Equation 13 it is required to determine the value of the right side of the equation; then read the value of the corresponding ω from Figure 7 (for ω < 35%). The following correlation is obtained from Figure 7:
![]()
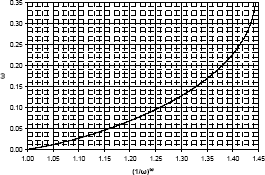
Figure
7. Graphical representation of ω versus (1/ω)ω
Where B = (1/ω)ω. Note that this correlation implies 0 ≤ ω ≤ 0.35 and 1 ≤ B ≤ 1.44.
3.2 Late Time - Radial Flow F2 Procedure
The instantaneous line source solution for naturally fractured reservoirs presented by Chipperfield [13] is used to evaluate the double integral in Equation 7. At late times t1 behaves as t1(x’) ≈ ∆t, and t1 - t’ ≈ ∆t, so Equation 7 becomes:

Where m stands for matrix and f for fractures. S is the storativity (øµct), Tf is transmissibility for the fractures and ηf the diffusivity as a function of time [13].
During radial flow (late time) ∆t is independent of x’ and t’ then Equation 18 becomes:
![]()
Applying the solution presented by Abousleiman et al. [9] for the double integral of Equation 19 we have:
![]()
The injected fluid volume Vi is defined as the product of the average injection rate and closure time [7], then:
![]()
Multiplying and dividing Equation 21 by tc and combining it with the concept of apparent closure time (i.e. Equation 6):
![]()
The derivative of Equation 22 with respect to F2 is:
![]()
Then, during radial flow a plot of ΔP versus F2 on a log-log graph is a straight line of a slope of unity and the derivative has a slope equal to zero. The permeability is calculated by extrapolating this horizontal straight line until it intercepts the y axis, similarly to the TDS technique:
![]()
On the log-log plot the pressure and pressure derivative have the same value when F2 is equal to the unity. Then, the unit slope line must intercept the horizontal line at F2 = 1 at the value of (F2×ΔP’)R. In other words, combining the equations for pressure derivative and pressure difference it is possible to determine that the straight line, which corresponds to the radial flow in the pressure difference, has a slope equal to unity and its intercept corresponds to the value of (F2×ΔP’)R. The equation of this straight line is:
![]()
Where (Pw)R is the value of Pw that corresponds to F2 read at any point on the radial flow portion.
Pressure derivative [2], [14] is more sensitive to time change than the pressure function and is not affected by the value of the reservoir pressure. Then, if the bottomhole pressure curve is incorporated to the diagnostic plot and the derivative is estimated in function of Pw instead of ΔP, the average reservoir pressure can be calculated using Equation 25. This means, Equation 25 allows for the calculation of average reservoir pressure without the need of guessing reservoir pressures as it was required before. For verification of average reservoir pressure, the radial flow portion of the pressure difference plot must lay on a unit slope crossing F2 at the value of 1 and (F2×P’w)R.
3.3 Special Cases
3.3.1 Comparison
of ω with the one obtained by the
TDS technique at the minimum point of the trough
Tiab and Donalson [14] obtained the following relationship at the minimum
point of the trough:
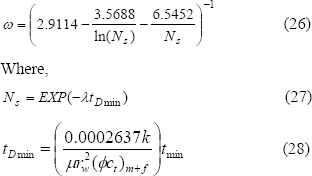
tmin (in hours) is the time coordinate of the minimum point of the trough on the pressure derivative curve.
Combining Equations 13 and 27 gives:
![]()
Combining Equations 29 and 26 yields:

3.3.2 The beginning and base of the trough are difficult to observe
Engler and Tiab [15] developed the following equation for the intersection
point of the infinite acting line and the unit slope of the transition period:
![]()
Where x stands for the intersection point and time is expressed in hours. Combining Equation 31 with Equations 11 and 6, the intersection point of the unit slope line at intermediate times and the radial flow line gives:
![]()
Another useful equation developed by Engler and Tiab [15] relates the value of λ and ω at the beginning of the radial flow:
![]()
The combination of Equations 33, 11, and 6 gives:
![]()
3.4 Step-by-step procedure
The following step by step procedure is recommended for the determination
of permeability (k), average reservoir pressure (Pr), storativity
ratio (ω), and interporosity flow coefficient (λ).
Step 1 - Following a mini-falloff test, acquire, compute and prepare the following required input parameters:
Step 2 - Convert the time data into shut in time intervals (i.e. Dt).
Step 3 - Identify and determine the closure pressure and the closure time. The method applied here for calculating closure pressure and closure time is referred to the one developed by Jones and Sargeant [5]
Step 4 - Compute the radial flow time function F2:

Step 5 - Compute the pressure derivative with respect to the dimensionless time function with the following equation:

Step 6 - Plot the bottomhole pressure and its derivative on the same log-log plot.
Step 7 - Identify radial flow and calculate reservoir pressure with Equation 25.
Step 8 - With the estimated reservoir pressure, calculate pressure difference and plot it in the same logarithmic plot with the pressure derivative and bottomhole pressure. Verify the value of reservoir pressure tracing a straight line of unit slope crossing F2 = 1; radial flow must overlay on this straight line.
Step 9 - The derivative curve would show a trough at intermediate times. This is a characteristic of a naturally fractured reservoir. Read the values of F21, F22, F23, and F2x at the beginning, base, end of the trough, and intersection point between unit slope at intermediate times and radial flow respectively. These characteristic points correspond to the
inflection points in the pressure difference curve and, because of noise, can be read more accurately from the pressure difference curve (Figure 5).
Step 10 - Estimate the formation permeability, k, from the infinite acting radial flow line on the pressure derivative curve using Equation 24.
Step 11 - Calculate the interporosity flow coefficient by Equations 14 and/or 32. In the case that more than one equation could be applied to the analysis, use them for verification purposes as well as for a better setting of characteristic points.
Step 12 - Calculate the storativity ratio with:
In the case that more than one equation could be applied to the analysis, use them for verification purposes as well as for a better setting of characteristic points.
4. FIELD EXAMPLE
This example is taken from Benelkadi and Tiab [2]. This is a calibration test applied to an oil well from TFT field ( Algeria ). The purpose of this job is to collect information about leak-off characteristics of the fracturing fluid. Determination of the fracture dimensions (fracture half length and average fracture width) and estimation of the fracture geometry model is also accomplished by means of interpretation and analysis from mini-fracture test. The test was performed by pumping 5000 gallons (119 bbl) of linear gel at an approximate rate of 13 bbl/min (pumping time was 9.1 min). The bottomhole pressure decline was monitored for 57 minutes.
Other parameters are:
f = 9.00 % μ = 0.355 cp h = 32.8 ft
Vi = 119 bbl tp = 9.1 min rw = 0.25 ft
ct = 7.112×10⁻⁵ psi-1
Step-by-step procedure:
Steps 1 and 2 - The information pertinent to these steps is reported above.
Step 3 Determine closure pressure and closure time.
Following the procedure suggested by Jones and Sargeant [5], Figure 8 permits the identification of Pc = 3208.76 psi and ts =1.23 min then tc =1.23+9.1=10.33 min. These values are close to the ones reported by Benelkadi and Tiab [2], Pc = 3210 psi and tc = 10.43 min.
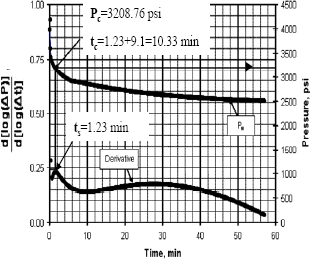
Figure
8. Plot for estimating closure pressure and closure time, Field example
Step 4 and 5 - Compute F2 and F2×Pw'.
Step 6 - Plot bottomhole pressure and its derivative on the same logarithmic plot as shown in Figure 9. From this Figure the following data can be read:
(F2×Pw')R = 2550 psi (F2)R = 0.066543
(Pw)R = 2511.81 psi
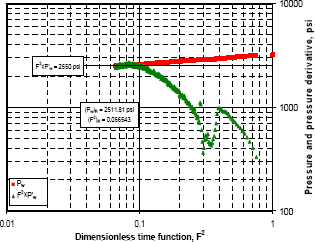
Figure
9. Pressure and pressure derivative plot, Field example
Step 7 - Identify radial flow and calculate average reservoir pressure with Equation 25.
![]()
Step 8 - With the estimated average reservoir pressure, calculate pressure difference and plot it in the same logarithmic plot. Verify the value of reservoir pressure.
Step 9 - Read the values of F21, F22, and F23.
Despite the fact that it is possible to identify the inflection point in the pressure difference curve, the behavior on the derivative shows wellbore storage effects.
From Figure 10 read:
F23 = 0.096 F2x = 0.11
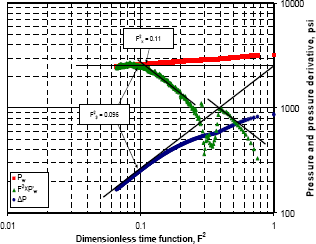
Figure 10. Diagnostic plot,
Field example
Step 10 Use Eq. 24 to calculate the formation permeability:
![]()
Step 11 - Calculate the interporosity flow coefficient:
Calculation of λ with Equation 14:
![]()
Step 12 - Calculate the storativity ratio.
Calculation of ω with Equation 34:
![]()
Table 1 summarizes the estimated values of ω, λ, Pr, and k for the field Example. It is important to notice that both methods complement each other, allowing a robust methodology for the interpretation of the naturally fractured reservoir from a mini-falloff data.
5. CONCLUSIONS
6. NOMENCLATURE
A: dummy variable
B: dummy variable
b: dummy variable
F(t): time function, dimensionless
F2×∆P: pressure derivative respect time function F2
g: gravity
h: formation thickness, ft
k: permeability, md
P, p: Pressure, psi
ql(x,t): leakoff intensity
Qo: injected rate, bbl/min
rw: wellbore radius, ft
t : time, min
tc: closure time, min
tp: pumping time, min
t’: leakoff exposure time of the fracture element, min
v: velocity
V: ratio of the total volume of the medium to the bulk volume of the system, ft3
Greek Symbols
f: porosity, fraction
η: dummy variable
ρ: density
ρ(h): density as function of depth
ω: storativity ratio, dimensionless
λ: interporosity flow coefficient, dimensionless
χ: factor for apparent time = 16/π2
μ: viscosity, cp
Subscripts
b: bulk/breakdown pressure (fracture pressure)
D: dimensionless quantity
f: fracture
H: maximum horizontal
h: minimum horizontal
i: injected
m: matrix
max: maximum
r: reservoir
R: radial flow
w: wellbore
x: intersection point between radial flow and unit slope line at intermediate times/x axis
y: y axis
z: z axis
1: beginning of the trough
2: base of the trough
3: end of the trough
REFERENCES
[1] NOLTE,
K. G., MANIERE, J. L., and OWENS, K. A.: “After Closure Analysis of Fracture Calibration Tests”.
Paper SPE 38676 presented at the SPE Annual Technical Conference and Exhibition
held in San Antonio, Texas, October 5 - 8, 1997.
[2] BENELKADI, S. and TIAB, D.: “Reservoir Permeability Determination using After-Closure Period Analysis of Calibration Tests”.
Paper SPE 88640 (SPE 70062) presented at the SPE Permian Basin Oil and Gas
Recovery Conference, Midland, Texas, May 15 - 16, 2001.
[3] WARREN, J.E. and ROOT, P.J.: “The Behavior of Naturally Fractured Reservoirs”.
Paper SPE 426 presented at the Fall Meeting of the Society of Petroleum Engineers
in Los Angeles, October 7 - 10, 1962.
[4] NOLTE, K. G. and SMITH, M. B.: “Interpretation of Fracturing Pressures”.
Paper SPE 8297, Journal of Petroleum Technology, p. 1767 - 1775, 1979.
[5] JONES, C. and SARGEANT, J. P.: “Obtaining the Minimum Horizontal Stress from Minifracture Test Data: A New Approach Using a Derivative Algorithm”.
Paper SPE 18867, SPE Production and Facilities, February, 1993.
[6] GU, H., ELBEL, J.L., NOLTE, K.G., CHENG, A., and ABOUSLEIMAN, Y.: “Formation Permeability Determination Using Impulse Mini-Frac Injection”.
Paper SPE 25425 presented at the Production Operation Symposium, Oklahoma City,
March 21 - 23, 1993.
[7] ABOUSLEIMAN, Y., CHENG, A., and GU, H.: “Formation Permeability Determination by Micro or Mini-Hydraulic Fracturing”.
Journal of Energy Research and Technology, Vol. 116, pages 104 -116, June 1994.
[8] NOLTE, K. G.: “Background for After-Closure Analysis of Fracture Calibration Test”.
Unsolicited companion paper to SPE 38676, Paper SPE 39407, July 24, 1997.
[9] ECONOMIDES, M. and NOLTE, K.G.: “Reservoir Stimulation”. Third Edition,
2000.
[10] AGUILERA, R.: “Well Test Analysis of Naturally Fractured Reservoirs”.
Paper SPE 13663, SPE Formation Evaluation, p. 239 - 252, September 1987.
[11] STEWART, G. and ASCHARSOBBI, F.: “Well Test Interpretation for Naturally Fractured Reservoirs”.
Paper SPE 18173 presented at the 63rd Annual Technical Conference and Exhibition
of the Society of Petroleum Engineers held in Houston, TX, October 2 - 5, 1988.
[12] BOURDET, D., AYOUB, J., WHITTLE, T. M., PIRARD, Y-M., and KNIAZEFF,
V.: “Interpreting Well Test in Fractured Reservoirs”. World Oil 72, October
1983.
[13] CHIPPERFIELD, S.: “After-Closure Analysis to Identify Naturally Fractured Reservoirs”.
Paper SPE 90002 presented at the SPE Annual Technical Conference and Exhibition
held in Houston, Texas, U.S.A. , September 26 - 29, 2004.
[14] TIAB, D. and DONALDSON, E. C.: PETROPHYSICS - theory and practice
of measuring reservoir rock and fluid transport properties”. Elsevier, 2nd
Edition, Boston, 2004.
[15] ENGLER, T. and TIAB, D.: “Analysis of Pressure and Pressure Derivative without Type Curve Matching, 4. Naturally Fractured Reservoirs”.
Journal of Petroleum Science and Engineering 15(1996) 127 - 138.
[16] URIBE, O.: “After closure analysis of mini frac tests in naturally fractured reservoirs”.
Thesis, the University of Oklahoma, Norman, May, 2006.
[17] TALLEY, G. R., SWINDELL, T. M., WATERS, G. A., and NOLTE, K. G.: “Field Application of After Closure Analysis of Fracture Calibration Tests”.
Paper SPE 52220 presented at the Mid Continent Operation Symposium held in
Oklahoma City, Oklahoma, March 28 - 31, 1999.