Determining cement ball mill dosage by artificial intelligence tools aimed at reducing energy consumption and environmental impact
J. R. Gómez Sarduy1, J. P. Monteagudo Yanes2, M. E. Granado Rodríguez3, J. L. Quiñones Ferreira4 and Y. Miranda Torres5
1 Julio R. Gómez Sarduy. Electrical Engineer, Las Villas University, Cuba. PhD, Las Villas University, Cuba. Affiliation: Energy and Environmental Study Center, Cienfuegos University, Cuba. E-mail: jgomez@ucf.edu.cu
2 José P. Monteagudo Yanes. Mechanical Engineer, Las Villas University, Cuba. PhD, Cienfuegos University, Cuba. Affiliation: Center of Study of Energy and Environmental, Cienfuegos University, Cuba. E-mail: jpmyanes@ucf.edu.cu
3 Manuel E. Granado Rodríguez. Mechanical Engineer, Cienfuegos University, Cuba. Affiliation: Energy and Environmental Study Center, Cienfuegos University, Cuba.
4 Jorge L. Quiñones Ferreira. Electrical Engineer, Las Villas University, Cuba. Affilia-tion: Cementos Cienfuegos, SA, Cuba. E-mail: jquinones@cementoscfg.com
5 Yudith Miranda Torres. Master of Sc. Cienfuegos University, Cuba. Affiliation: Energy and Environmental Study Center, Cienfuegos University, Cuba. E-mail: ymiranda@ucf.edu.cu
How to cite: Gómez, J., Monteagudo, J., Granado, M., Determining cement ball mill dosage by artificial intelligence tools aimed at reducing energy consumption and environmental impact., Ingeniería e Investigación, Vol. 33, No. 3, December 2013, pp. 49 - 54.
ABSTRACT
Energy management systems can be improved by using artificial intelligence techniques such as neural networks and genetic algorithms for modelling and optimising equipment and system energy consumption. This paper proposes modelling ball mill consumption as used in the cement industry from field variables. The regression model was based on artificial neural networks for predicting the electricity consumption of the mill's main drive and evaluating established consumption rate performance. This research showed the influence of the amount of pozzolanic ash, gypsum and clinker on a mill's power consumption; the dose determined according to the model ensured minimum energy consumption using a simple genetic algorithm. The estimated savings potential from the proposed dose was 36 600 kWh / year for mill number 1, representing $5,793.78 / year and a 33,708 kg CO2 / year reduction in the environmental impact of gas left to escape.
Keywords: energy management, energy, cement mill, artificial neural network (ANN), genetic algorithm.
RESUMEN
Los sistemas de gestión energética pueden ser mejorados mediante la utilización de técnicas de inteligencia artificial, tales como, las redes neuronales y los algoritmos genéticos; con el propósito de modelar y optimizar el consumo energético de equipos y sistemas. Este trabajo, propone la modelación del consumo de los molinos y de las bolas que se emplean en la industria cementera, a partir de las variables disponibles en el campo. El modelo de regresión obtenido está basado en redes neuronales artificiales, permitiendo predecir el consumo de la electricidad en el accionamiento principal de los molinos, así mismo, permite evaluar el comportamiento de los índices de consumo establecidos. Además, se demuestra la influencia que ejerce la cantidad de puzolana, yeso y clinker en el consumo eléctrico del molino y se determina la dosificación que de acuerdo con el modelo, garantiza un mínimo consumo energético utilizando un algoritmo genético simple. El potencial de ahorro estimado a partir de la dosificación propuesta, es de 36 600 kWh/año para el molino 1; lo que representa 5 793,78 $/año y una reducción del impacto ambiental por gases sin emitir de 33 708 kg CO2/año.
Palabras clave: gestión energética, consumo energético, molinos de cemento, Redes Neuronales Artificiales (RNA) y algoritmo genético.
Received: November 26th 2012 Accepted: October 7th 2013
Introduction
Many industries currently have difficulties in trying to reduce costs (mainly energy costs) and also face stringent environmental constraints.
This requires a quick reaction from specialists in a dynamic setting for achieving conflicting objectives. One important aspect when optimising production is to anticipate demand and energy costs regarding equipment involved in higher-consumption processes which can be achieved through a suitable management system. However, most management systems have no programmes or models which can resolve how to predict solutions for optimising demand and energy consumption within a reasonable timeframe.
Others do not reflect the equipment's actual operating conditions as they are based on features provided by a manufacturer and not on actual behaviour data considering wear and aging, or operating conditions deviating from field condition-related parameters.
However, energy management systems can be improved considerably (Poncet, 2003) due to the maturity of hybrid system modelling techniques and predictive model control, thereby providing the means for efficient modelling and control of complex industrial systems added to growing interest in the total integration of existing information at different levels of an industrial process. Management systems have thus been introduced to this end as more and more applications and artificial intelligence tools have become available, such as artificial neural networks (ANN) and genetic algorithms (GA).
ANN enables modelling complex systems, meaning that a reliable representation of them can be obtained. It also allows models to include logical limitations on systems and equipment (e.g. loss of efficiency for different reasons). Such models simulate short-term dynamics which can also be used for predicting electrical equipment consumption and demand (Consuegra, Gómez and Monteagudo, 2012). Once such black box models have been developed, they can be combined with stochastic search algorithms such as GA to optimise energy consumption (De Armas et al., 2008). Such combination provides a solution enabling increased efficiency considering system operational flexibility and has been successfully used in other types of research (Gómez et al, 2008).
The cement industry presents a typical example of such applications regarding the final phase of production consisting of grinding clinker together with various additives in cement mills (i.e. a ball mill). Various chemical compositions produce different types of cement which are stored separately or packaged before delivery to customers. The mills' energy consumption, which has fundamental importance in the industry's overall consumption, depends on the dose used to produce a certain quality. In this paper, it is reported the modelling neuronal mill in cement industry for its use in consumption forecasting, indicators behaviour analysis and determining the optimal dosage that ensures lower energy consumption, all this to continue the improvement of the existing energy management system.
General information about cement mill energy consumption
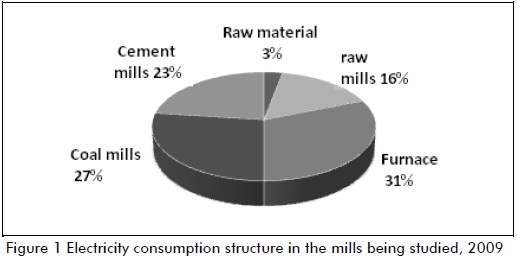
The cement industry requires large amounts of energy in all its forms, and this is the major cost component in the manufacture of cement. Regarding electricity, this represents about 25% of power consumption as reported by Rodríguez (2000). The main consumers of electricity are kilns and cement mills which are driven entirely by large electric motors and represent over 50% of a plant's overall consumption. Some reports state that 5% of the world's energy is used in ball mills so that optimising grinding is very important (Ramírez, 2007). Figure 1 shows a cement factory's power consumption structure.

The mills taken as a case study in this work were tubular ones combined into two chambers with a bucket elevator and dynamic separator (see Figure 2), forming a closed circuit having 100 ton / h capacity for cement production type A and 110 ton / h for the production of type B cement. The material in these mills was triturated by the impact, compression and friction between balls and shields. A mill's ball charge may vary, depending on the qualities and other characteristics of the material being used.

High quality cement grinding in this type of mill mainly depends on the mill load ball, adjusting the separator, the hardness of the material during grinding and the time taken for grinding the material. The technical data regarding this type of mill: 15.8 rpm engine speed, 720 rpm engine power at 2,500 kW, 90 ton / h number of steps, 4 m diameter, 12 m length, 3.84 m effective diameter and 11.29 m effective length.
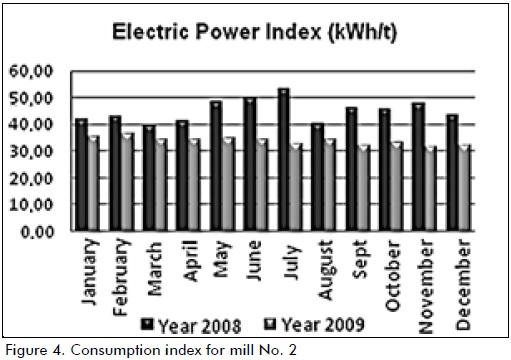
Figures 3 and 4 show the power consumption rates; Figure 4 shows that mill No. 2 always had a higher rate of energy consumption during 2008 due to its poor performance because of clogging in the channels of the chambers, load ball poorly balanced, power failures, etc. Remodelling within their chambers took place in 2009, such as changing the shielding and using cement grinding intensifier (3000 Variocen), thereby improving their behaviour.

It was decided to develop an ANN model for modelling the energy consumption of the mill's main drive, depending on operational variables like the dosage, production and labour time in response to this tool's power for "learning" behaviour from experimental data.
ANN-based cement mill energy consumption model
The models presented in this paper are based on a multilayer network having feed forward with a back-propagation learning algorithm (Granados, 2010). Two ANNs were used for modelling, one for each cement mill, taking 2009 field variables normalised to their maximum value. The data were associated with cement production and power consumption. The parameters for forming an ANN were measured in the company. It should be stated that these mills were driven by high power electric motors whose rpm were fixed, working at full load, as partial load work would make them inefficient.
As choice criterion, network design takes the number of neurons in the first and last layers, being the same number of input and output variables, respectively. The number of neurons in the hidden layer was selected in accordance with network behaviour during training and this is what determines ANN final architecture. Unfortunately, there is no known way of determining the number of intermediate layers (hidden) in advance or the number of neurons in them, thereby requiring a trial and error approach; the number of neurons for the ANN intermediate layers was chosen by this type of test, involving several training sessions by changing the number of neurons, keeping time constant and selecting the number of neurons achieving minimum mid square error (MSE) during training.
The first and second layer neuron transfer function was tansig of last layer neurons (i.e. purelin), i.e. network structured with five neurons in the first layer (layer 1) corresponding to input variables: clinker, gypsum, pozzolan, working time and cement production. The intermediate layer had 25 neurons for mill No. 1 and 20 neurons for mill No. 2. The last layer in both networks had a single neuron for energy (output variable). ANNs were designed and trained using Matlab R2009a neural networks toolbox (Figure 5 shows overall architecture).

Only 60% of the data was used for training ANN (Matlab); 20% of the remaining 40% was used for validation and 20% for testing. Training was done with errors of the order of 10-3 for both networks for training data, validation set and testing, meaning that the networks were able to respond, even with small errors for input data which had not been trained.
Only 60% of the data was used for training ANN (Matlab); 20% of the remaining 40% was used for validation and 20% for testing. Training was done with errors of the order of 10-3 for both networks for training data, validation set and testing, meaning that the networks were able to respond, even with small errors for input data which had not been trained.
Matlab ANN allowed post-workout analysis to verify network generalisation capability. This analysis concerned regression between network output and the corresponding targets. A correlation coefficient of one meant that the network faithfully reproduced the behaviour of an object or process being simulated. Figures 6 and 7 show the regression between the models' returned output and the objectives to be achieved for all data sets used and the training, validation and test data sets, separately.
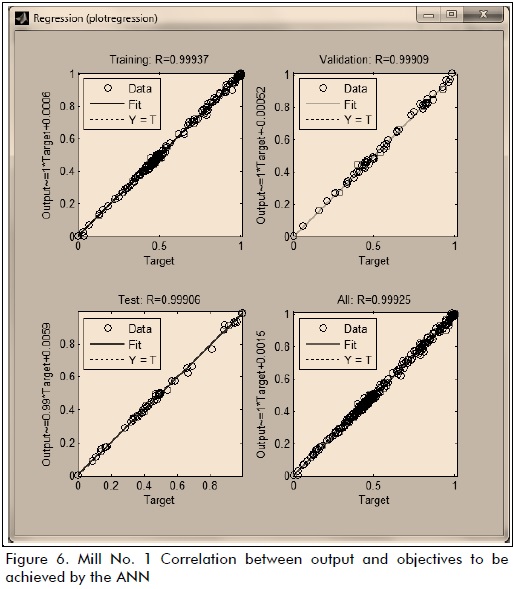

The results corroborated network behaviour in all cases; they corresponded to the values taken as targets, having higher than 0.99 correlation coefficients. This test verified the quality of the obtained model being able to accurately reproduce these cement mills' electrical energy consumption.
Statistical analysis of model errors
The aforementioned regression analysis showed the designed network's generalisation ability, i.e. how good a network was at giving satisfactory results with data sets not used in training. Besides, the magnitude of error if you used this network would have to be known as virtual sensor energy consumption of the mill or for predicting such consumption.
Taking this into account, the network was simulated and values for expressing the results in magnitudes of daily energy consumption (kWh) were not normalised. Absolute error was determined as the difference between network simulation and the real value of energy obtained from reading mill feeder meters.
The distribution law which fit errors to both models was adjusted to a normal distribution (Figure 8). Mill 1 distribution parameters were μ and σ = 10.7 kWh and kWh = 563.36 and mill 2 had μ = σ = -2.38 kWh and 507.91 kWh. Both the most likely error value of μ, as its standard deviation σ for both distributions was 24,606 kWh and 23,114 kWh for mills 1 and 2, respectively, ensuring that the models had good accuracy if average daily consumption were considered.

Forecast of the mills' energy consumption
Neural models of energy consumption for mills 1 and 2 were useful forecasting tools. Measurement data for both teams during January and February 2010 were compared, with predicted consumption by ANN simulation for the same period of time. Figures 9 to 12 give the results of the comparison, showing the correspondence between curve profile values predicted by the model and actual measurements.

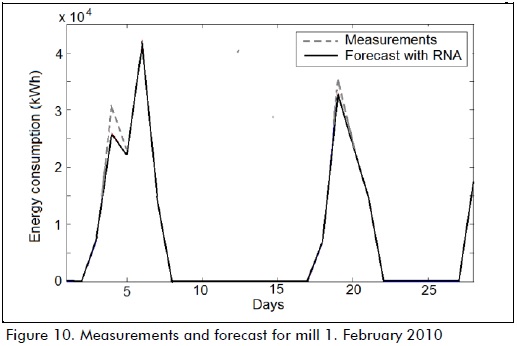
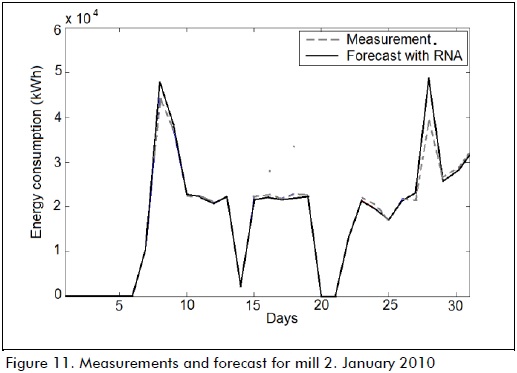

The ANN models so obtained represented an additional tool for experts in the energy field, as they afforded scientifically-based consumption planning. These models could give accurate predictions of expected daily consumption in this area, knowing production-related data, and analyse deviations occurring as a diagnostic indicator. They could also predict short-term consumption estimated working time for given production and dosing before power interruptions or breaks, for various reasons.
The mills' main drive consumption behaviour index
Even though the resulting models suitably reproduced both mills' energy consumption, it is proposed that the consumption rate graph cf production for both types of cement be used for obtaining a typical dosage. Typical dosage for these productions would thus be:
for cement type A: 5% pozzolan, 5% gypsum and 90% clinker; and
for cement type B: 20% pozzolan, 5% gypsum and 75% clinker.
Figure 13 shows consumption rate curves for production, taking the ANN model for both mills into account and types of cement mill with the above dosages.

The figure shows that there was no marked difference between consumption rates obtained by the model for both types of cement, so this can be considered particular for both production rates, having the following average values: mill 1 = 21.40 kWh / t and mill 2 = 21.95 kWh / t.
Actual daily consumption rates for both mills for January and February 2010 are shown in Figure 14, showing that consumption rate was above 25 kWh / t of the average value obtained by the model using a typical dosage for both mills and for different types of cement, in most cases.


Mill performance and, therefore, their consumption rate depended on their working conditions, so the influence of the dos age regarding mill energy consumption had to be investigated for the existing conditions.
Dosage for minimum energy consumption: case study mill No.1
Figure 15 shows the surface which represented mill daily energy consumption regarding dosage. It can be appreciated that varying allowable dosage ranges led to reducing energy consumption.

A GA was used in combination with a single neuronal mode to obtain optimal dosage to ensure minimum energy consumption for both types of cement. The purpose was to investigate the best percentage vector for dosing products X * minimising energy consumption, varying dosage within permissible values which did not affect product quality. It was mathematically expressed by equation 1:

Fulfilling such restrictions:
for type A cement: X1 ∈ (0.05, 0.06), X2 ∈ (0.03, 0.05) and X3 = 1 - (X1 + X2);
for type B cement: X1 ∈ (0.18, 0.20), X2 ∈ (0.03, 0.05) and X3 = 1 - (X1 + X2);
since X1, X2 and X3 referred to the percentage of pozzolan, gypsum and clinker, respectively.
The potential benefits of working according to the dosage given could be estimated, taking January 2010 production into account and considering only the mill's main drive No. 1. An average $ 0.1583 / kWh energy price, at the applied rate, was used for this analysis. A 0.921 kg CO2/kWh emission rate was used for estimating potential reduction in emissions associated with reduced energy consumption. Table 2 summarises this analysis.

The models so obtained represent an additional tool for experts in the energy field as they allow scientifically-based consumption planning. These models may be used for giving accurate predictions of expected daily consumption in this area and analyse deviations from this as a diagnostic indicator, once production-related data is known.
Conclusions
Electrical energy consumption in a cement industry represents about 25% of its energy consumption, cement mills accounting for the main consumption. Models were developed for the mills' main drive to estimate energy consumption based on neural networks, considering the percentage of raw material used, total production and daily working time as input variables. These models considered actual operating parameters and the mills' actual technical condition and led to satisfactorily simulating main drive consumption, results correlating with experimental data, giving R2 >0.99 for both mills. Consumption model error had Gaussian distribution, with parameters estimating the model's uncertainty, demonstrating high accuracy in both cases.
The ANN were useful for forecasting these mills' electricity consumption, as demonstrated for January and February 2010; the energy management system was improved, showing that this could be properly planned and consumption demand controlled.
It has been shown that the energy consumption rates at both plants were practically independent of the type of cement produced and were influenced by the dosage at which they operated.
This paper has shown that using modern regression models, based on neural networks and intelligent optimisation methods such as GA, could further improve energy management in the cement industry.
References
Consuegra, M., Gómez, J. R., Monteagudo, J. P., Methodology for the efficient control of the input power water pumps for boiler feed TEE Carlos M. Cespedes. Using artificial intelligence., Proceedings of the Pan American Convention of Engineering XXXIII, UPADI 2012. 6th International Mechanical, Electrical and Industrial Engineering Conference, Havana, April, 2012.
De Armas, M. A., Gómez, J. R., Pérez, C., Merino, L., Sepulveda, J., Artificial intelligence applied to the analysis of energy systems with Matlab., 1st ed., Cartagena de Indias, Colombia, Comfenalco Technological University Foundation, 2008.
Gómez, J. R., de Armas, M. A., Navarro, E., Ramos, F., Artificial intelligence applied to the charge distribution in a cogeneration system., Energy Journal, No. 39, July, 2008, pp. 43-50.
Granados, M. E., Modeling neuronal energy consumption Cement Mills Company Cementos Cienfuegos SA., MSC Mechanical Engineering thesis presented at the University "Carlos Rafael Rodríguez" of Cienfuegos, , 2010.
Poncet, A., Production and energy management: optimization up with the latest technology., ABB, No. 3, 2003, pp. 47-48.
Ramírez, V. M., Evaluation of materials used in the manufacture of intermediate wall outlet and a ball mill., Proceedings of the 8th Latin-American Mechanical Engineering Congress, Cusco, October, 2007.
Rodríguez, P., Energy Audit Rama Cement., Havana, Cuba, Ministry of Economy and Planning, 2000.