Detection and location of surfaces in a 3D
environment through a single transducer
and ultrasonic spherical caps
Detección y localización de superficies en un ambiente 3D
a través de un solo sensor y casquetes esféricos ultrasónicos
Fabio T. Moreno-Ortiz 1, Eduardo Castillo-Castañeda 2, and Antonio Hernández-Zavala 3
1 M.Sc. in Instrumentation and Control, Universidad Autónoma de Querétaro, Mexico. Affiliaton: Professor, Universidad Tecnológica de Querétaro, Mexico. E-mail: famoreno@uteq.edu.mx
2 Ph.D. in Automatic Control, Grenoble Institute of Technology, France. Affiliation: Professor, Centro de Investigación en Ciencia Aplicada y Tecnología Avanzada (CICATA) Querétaro, Instituto Politécnico Nacional, Mexico. E-mail: ecastilloca@ipn.mx.
3 Ph.D. in Computer Architecture, Centro de Investigación en Computación, Instituto Politécnico Nacional, Mexico. Affiliation: Professor, Centro de Investigación en Ciencia Aplicada y Tecnología Avanzada (CICATA) Querétaro, Instituto Politécnico Nacional, Mexico. Corresponding Author.E-mail: anhernandezz@ipn.mx
How to cite: Moreno-Ortiz, F. T., Castillo-Castañeda, E., Hernández-Zavala A., (2017). Detection and location of surfaces in a 3D environment through a single transducer and ultrasonic spherical caps. Ingeniería e Investigación, 37(3), 37-44.
DOI:10.15446/ing.investig.v37n3.59508.
ABSTRACT
In this paper, an ultrasonic arc map method for flat mapping is extended to three-dimensional space replacing the circumference arcs by spherical caps. An enclosed environment is scanned by employing a single ultrasonic device. The range, position, and orientation of the transducer are used to digitize the uncertainty caps and place them in a three-dimensional map. Through the spatial voting method, the generated voxels are elected in order to distinguish those which mark the true position of an obstacle and discard those that are produced by cross talk, noise, fake ranges, and angular resolution. The results show that it is possible to obtain sufficient information to build a three-dimensional map for navigation by employing inexpensive sensors and a low power data processing.
Keywords: Ultrasonic arc map, sonar resolution, SLAM, Bresenham algorithm, voxelized spherical cap, beam pattern, spatial voting.
RESUMEN
En este artículo, un método de mapa de arcos ultrasónicos para mapeo plano es extendido al espacio tridimensional, remplazando los arcos de circunferencia por casquetes esféricos. Un ambiente cerrado es explorado empleando solo un dispositivo ultrasónico. La distancia, posición y orientación del transductor son utilizadas para digitalizar casquetes de incertidumbre y colocarlos en un mapa tridimensional. A través del método de votación espacial, los voxeles generados son elegidos con el propósito de distinguir aquellos que marcan la posición real de un obstáculo y descartar aquellos producidos por diafonía, ruido, lecturas falsas y la resolución angular. Los resultados muestran que es posible obtener suficiente información para construir un mapa tridimensional para navegación mediante el empleo de sensores de bajo costo y un procesamiento de datos de baja potencia.
Palabras clave: Mapa de arco ultrasónico, resolución del sonar, SLAM, algoritmo de Bresenham, casquete esférico voxelizado, patrón de dispersión, votación espacial.
Received: August 10th 2016
Accepted: July 31st 2017
Introduction
Ultrasound is an acoustic method used to measure distances and locate objects. It is widely employed in medicine, oceanography and non-destructive tests to produce images. In robotics, sonar is used to detect obstacles and make maps. Mobile robots are equipped with sonar arrays to explore unknown environments in which they are capable of doing autonomous motion. In the last decade, ultrasound has been displaced by optical methods like LASER systems, infrared scanners or digital cameras (Jaramillo, Prieto, & Boulanger, 2007). Compared with light waves, one of the most important disadvantages of ultrasound is its wide beam pattern; however, the inexpensive sensors, the low power that computer requires in data process (Restrepo G., Loaiza Correa, & Caicedo B., 2006) and the sound wave property to travel through foggy air or muddy water make sonar a very good option to provide information for autonomous navigation in robotics.
The most common use of sonar is pulse-wave (Xiaole & Lichen, 2012) and the ultrasound transducer is typically modeled by a flat piston enclosed in an infinite surface baffle (Kinsler, Frey, Coppens, & Sanders, 2008). The transducer emits a pulse inside a beam pattern and the measurement has two important uncertainty sources (Hansen, 2012; Murino & Trucco, 2000; Przybyla, et al., 2012; Shi, Chen, Lin, Xie, & Chen, 2012): (a) Range resolution δR, inability to distinguish two objects in the same direction line but at different distances, and (b) angular resolution δβ, inability to distinguish two objects at the same distance but different orientations or angular positions (Figure 1).
Using a single transducer, the pulse-echo method can provide the distance from the sensor to an obstacle but it cannot provide the position with the same accuracy. Normally, the range resolution (δR) is much smaller than the angular resolution (δβ) and it is difficult to exactly locate obstacles and differentiate between planes, edges and corners (Barshan & Kuc, 1990; Restrepo Girón, Loaiza Correa, & Caicedo Bravo, 2009). When a single transmitter-receiver is used, the angular resolution is defined by the divergence angle of the beam pattern in the far zone.

Source: Authors
The width beam angle θ0 is a function of the wave-length λ and the transmitter radius α, and is given by Barshan & Kuc (1990) and Bozma & Kuc (1991) as it follows in Equation (1):
 (1)
(1)
In order to reduce the uncertainty of where obstacles are located, some authors have proposed to divide the plane into a grid where the square side has the same size of the range resolution and the localization uncertainty is represented by an arc. Probabilistic and statistical (Borenstein & Koren, 1991; Cañas & García-Alegre, 1999; Elfes, 1987; Lee, Cho, Chung, & Lee, Y., 2006; Lee, Lee, Y., Kölsch, & Chung, 2013; Lim & Cho, 1992; Moravec & Elfes, 1985), fuzzy logic (Gasós & Martín, 1996; Noykov & Roumenin, 2007), neural networks Kang, An, Kim, & Oh, 2010; Thrun, 1998, and ultrasonic arc map (UAM) (Barshan B., 2007) are used to build a mesh map where each square has an occupancy mark. The probabilistic and statistical methodologies have been extended to three dimensions to build a spatial map for underwater navigation in (Auran & Silven, 1996; Fairfield, Kantor, & Wettergreen, 2007). In Ribas, Ridao, & Neira (2010) the authors build 3D maps by stacking flat ultrasonic arc maps.
This paper presents an extension of a UAM flat methodology to three dimensions by employing a simple transducer in the air. To do that it is necessary to estimate the location of the obstacles inside the uncertainty spherical cap caused by the angular resolution instead of the circumference arc.
Methods and instruments
To build a 3D obstacle map, the method proposed in this paper, uses the measured ranges R and the beam angle θ0 to make digitized uncertainty caps. Knowing the position (x,y,z) and orientation (ϕ,θ,ψ) of the sonar, the uncertainty caps are placed into a 3D mesh map. Through a UAM method, the fake points are discarded and finally a 3D obstacle map is produced (Figure 2).
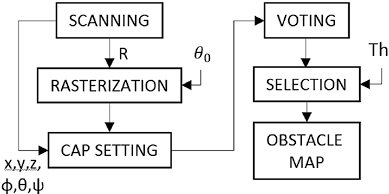
Figure 2. Method of building a 3D obstacle map suggested in this paper.
Source: Authors
Cap rasterization
The process to digitize images is called rasterization and its basic units are the pixel in the plane and the voxel in the space. These units are very useful in digital systems due to their integer representation and easy arithmetic process. The computer graphics algorithms are the most used to rasterize and in this paper they are employed to digitize the uncertainty of the position of the obstacle.
In the 3D space, the localization uncertainty could be represented by a spherical cap (Figure 3). This cap has a thickness equivalent to the range resolution and its base radius r and height h are determined by the measured range R and the beam angle θ0 through the well-known expressions (2) and (3):
 (2)
(2)
 (3)
(3)
By employing the Bresenham algorithm for plotting circles (Bresenham, 1977) it is possible to rasterize the sphere by dividing it in circular slides and then digitizing those circles (Montani & Scopigno, 2009). This algorithm should be modified because it produces gaps (Roget & Sitaraman, 2013) and the number of absentee voxels increases as a quadratic dependence of r (Bera, Bhowmick, & Bhattach, 2014).

Figure 3. Spherical cap dimensions.
Source: Authors
If the size of the cubic voxel side equates to the range resolution δR, then the measured range R is an integer multiple of δR and it should be used as the integer radius of the rasterized spherical cap. The other required input is the width beam angle θ0,usually provided by the manufacturer of the transducer. The cap is built by making a disk on the plane XY where each concentric circumference is a slice of the cap. The height (z) and radius of each slice (rc) are calculated using the circle algorithm (Figure 4); in each iteration these values are modified to follow a circumferential arc on the YZ plane. Each slice over the XY plane is made by using again the circle algorithm (Figure 5) where the coordinates are calculated for a quadrant and the voxels are assigned by symmetry (Figure 6).
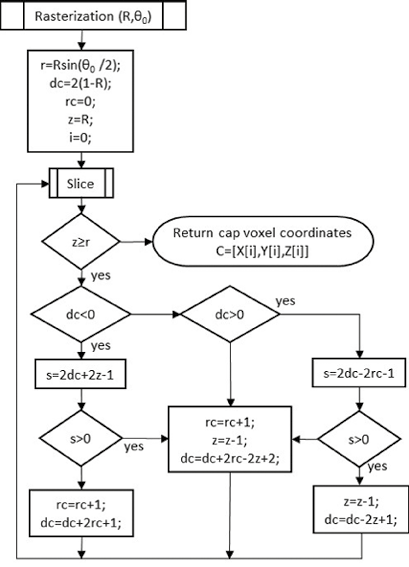
Figure 4. Algorithm to calculate the height (z) and the radius (rc) of the slices.
Source: Authors

Figure 5. Algorithm to do a slice.
Source: Authors
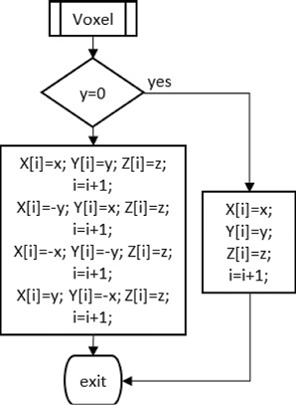
Figure 6. Algorithm to reproduce voxels by symmetry.
Source: Authors
In this manner, a fully digitized cap is made over a 3D space, with its origin at (0,0,0), centered and symmetric on the Z axis and with no gaps (Figure 7). The side of each voxel in the cap is the size of range resolution. According to the methodologies for building mesh maps, the cap could be moved through transformation matrices to any place in space and a weight could be assigned to the voxels as described below.

Figure 7. Voxelized uncertainty spherical cap (R = 20, θ0 = 60º).
Source: Authors
UAM
The UAM methods were developed on robotics to solve issues concerning the detection of edges, corners, curved surfaces, and thin objects for map-building purposes. Simple pulse-echo sonar devices are employed to scan the environment and the measured ranges are obtained through the time of flight.
In order to build a map, the measured range, the orientation and position of the transducer are used to estimate an uncertainty arc. Each arc is rasterized and placed on a mesh map. The real reflection points are usually “touched” by several arcs and those that cross each of them reinforce the point on the map where an obstacle is really located. Some UAM techniques are spatial voting (Barshan B. , 1999), morphological processing (Baskent & Barshan, 1999), triangulation based fusion (Wijk & Christensen, 2000), arc-transversal median (Choset , Nagatani, & Lazar, 2003) and directional maximum (Barshan B., 2007).
The spatial voting algorithm discards the false points produced by noise, crosstalk, specular reflection and the angular resolution. In order to achieve the above, this paper uses spherical caps instead of circumference arcs, as follows: first, each measured range produces an uncertainty cap located on a mesh map through a transformation matrix T using the position (x,y,z) and orientation (ϕ,θ,ψ) of the transducer (Figure 8). When a particular point on the map is reached by a cap, a value of 1 is assigned to it. Each time that a cap reaches this point, its value is added by 1 (Figure 9), then the number of votes matches the number of caps that crossed this particular point. Finally, those points that have a number of votes higher than a threshold (Th) are elected as the location of an obstacle (Figure 10).

Figure 8. Cap setting procedure.
Source: Authors
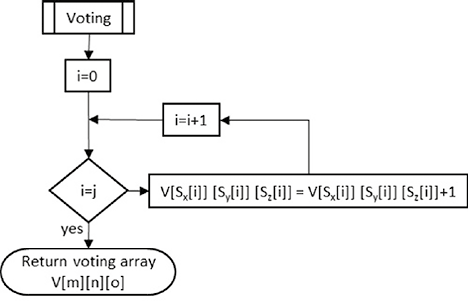
Figure 9. Voting procedure.
Source: Authors

Figure 10. Selection procedure.
Source: Authors
Instruments
In order to scan the 3D environment, a kind of theodolite was built. This “theodolite” consists of a single pulse-echo transducer mounted on a mechanism with two degrees of freedom (Figure 11). The mechanism is capable of rotating 360 degrees in the vertical axis and 180 degrees in the horizontal axis. The ultrasonic transducer is the SRF02, it measures distance in integer centimeters (δR = 1 cm) and according to the manufacturer (Devantech Limited, 2012) it transmits an 8 cycle 40 kHz burst per ranging and has a wide beam angle of 60 degrees at -6 dB and 124 cm of range detection (δβ ≈ 0,5 R). The use of a wide beam pattern allows the evaluation of the robustness of the proposed method against the disadvantage of angular resolution. The device transfers 16-bit unsigned result from the latest ranging through a serial protocol. The ranging lasts up to 65 ms, the minimum measurement range varies from 15 to 18 cm and the maximum measurement range is 249 cm. The transducer and motors were driven by a microcontroller ATMEGA328P, linked to a virtual instrument running on a PC to do the data acquisition and movement control.
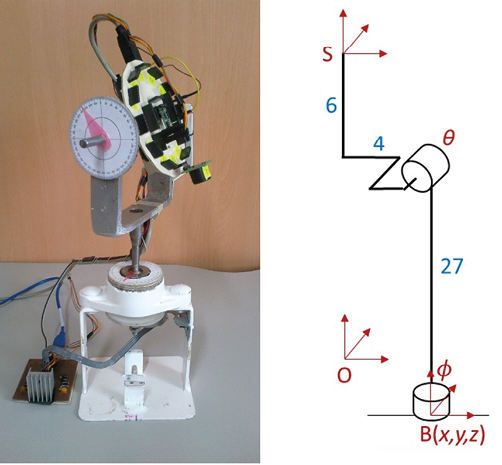
Figure 11. SONAR scanner “Theodolite” (left) and model (right).
Source: Authors
Experiments and results
In order to evaluate the proposed method, a small enclosure space was scanned in the corner of a room under a desk. The space limits were two room walls, two fences, the room floor and the desk table (Figure 12). The distance between the walls and the fences in front of them was 140 cm, the height between the room floor and the table desk was 73 cm, and the length of the desk table from the wall to the border side was 59 cm. Inside the closed space, the “theodolite” was placed on a mesh board (XY plane) and moved to different positions that were separated by 10 cm. At each position, the transducer was oriented every 30 degrees in both rotation axes, enough to allow consecutive caps to cross themselves whenever the transducer detected a same plane. A single range measurement was taken per each posture and a new posture was set every 100 ms.

Source: Authors
Data processing was as follows: only ranges from 0 to 255 cm were accepted. Then, a spherical cap was computed for each range. After that, each generated cap was placed in space by using the position of the “theodolite” (x, y, z), the orientation of the vertical axis (ϕ) and the horizontal axis (θ) through the following transformation matrix (Barrientos, Peñín, Balaguer, & Aracil, 2007) given by Equation (4):
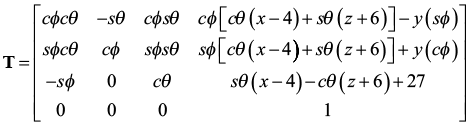 (4)
(4)
Then, an uncertainty cloud containing all the possible positions of the reflected points was produced. Finally, by applying the spatial voting, the true voxels were obtained and the fake points were discarded.
The raw data set produced a cloud containing 30 503 points where it was very hard to distinguish the surfaces by eyesight (Figure 13). After the spatial voting, the resulting 96 046 elected voxels produced clouds where it was possible to distinguish clusters associated to the desk table, the walls, the fences and even the chest of drawers (Figure 14 and Figure 15).
Discussion
Using the proposed method, it is possible to locate the obstacles in a more effective way than using cells as in (Auran & Silven, 1996). This is because the angular resolution is divided into cubic voxels (δR × δβ × δβ size, 1 cm3 in this case) for all the scanned space instead of cells (δR × δβ × δβ size) where the volume of each cell increases with the distance (approx. 0,25R2 in this case). Secondly, the computational cost of the proposed method is lower than the Bayesian method used in (Fairfield, Kantor, & Wettergreen, 2007), because in the proposed method only the cap is rasterized and it is not necessary to compute all the uncertainty cone and store all the weights of the non-occupancy voxels. Further, the spatial voting method results in a mean absolute error of only a third and takes 10 % of the processing time than the Bayesian method on a flat space (Barshan B., 2007). Thirdly, the spatial voting method produces dense clouds of points clustered near the actual location of surfaces, it is easy to implement and has good performance when building 3D obstacle maps.

Figure 13. Points cloud from the raw ranges.
Source: Authors
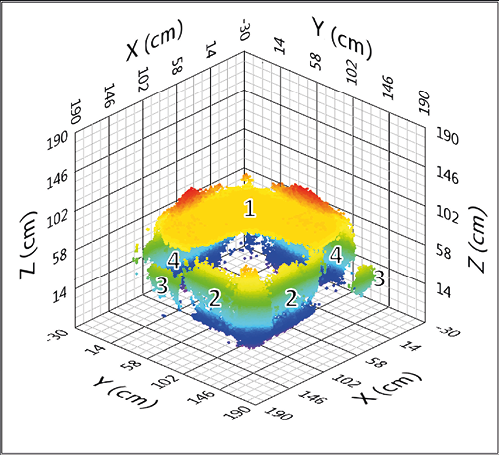
Figure 14. Clusters of points after processing: 1 desk table, 2 fences; 3 chests of drawers, 4 walls.
Source: Authors
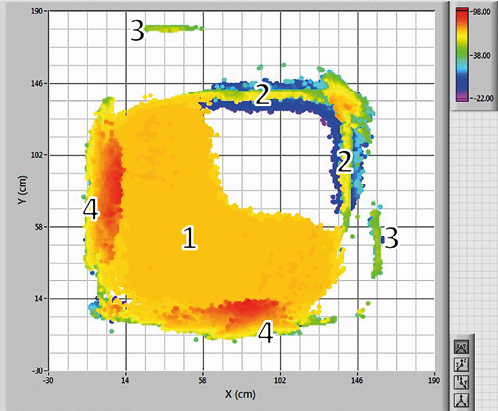
Figure 15. Clusters of points over XY plane. 1 desk table, 2 fences; 3 chests of drawers, 4 walls.
Source: Authors
In spite of the wide beam pattern angle of the SRF02 (60 degrees), an uncertainty cap radius of 50 % of the measured range, and other strong uncertainty sources like mechanic backlash and vibrations, the method provides acceptable clusters of points to represent the obstacle position in space. The algorithms are easy to embed in a digital system, however, the amount of memory that is necessary for data processing constitutes the principal limitation.
Future research may include scanning large closed spaces on small drones in order to make tridimensional maps from sonar and navigation data, embedding the algorithm in a digital system to develop a whole navigation instrument, and processing the resultant map through image reconstruction algorithms in order to obtain a virtual image from the real environment.
Conclusions
By voxelizing the uncertainty spherical cap, it is possible to extend the 2D mesh map methods to the 3D space. The experiment demonstrates that it is possible to distinguish surfaces in three-dimensional environments by using a single pulse-echo transducer. It may be possible to improve the resolution on other wave based systems by applying the proposed method. Applying the UAM techniques, the robots could do simultaneous localization and mapping (SLAM) and autonomous navigation in three dimensions by using inexpensive sensors, low computational cost, small integrated systems, and all the ultrasound advantages.
Acknowledgements
This work was supported in Mexico by the Consejo Nacional de Ciencia y Tecnología (CONACyT) and the Instituto Politécnico Nacional (IPN).
References
Auran, P., & Silven, O. (1996). Underwater sonar range sensing and 3d image formation Control Engineering Practice, 4(3), 393–400. DOI:10.1016/0967-0661(96)00017-2
Barrientos, A., Peñín, L., Balaguer, C., & Aracil, R. (2007). Fundamentos de Robótica 2nd. Ed.. Madrid, Spain: McGraw-Hill/Interamericana de España, S.A.U.
Barshan, B. (Dec., 1999). Ultrasonic surface profile determination by spatial voting. (IEEE, Ed.) Electronics Letters, 35(25), 2232-2234. DOI:10.1049/el:19991477
Barshan, B. (2007). Directional Processing of Ultrasonic Arc Maps and its Comparison with Existing Techniques. The International Journal of Robotics Research, 26(8), 797-820. DOI:10.1177/0278364907078888
Barshan, B., & Kuc, R. (Jun de 1990). Differentiating sonar reflections from corners and planes by employing an intelligent sensor. (IEEE, Ed.) IEEE Transactions on Pattern Analysis and Machine Intelligence, 12(6), 560-569. DOI:10.1109/34.56192
Baskent, D., & Barshan, B. (Aug de 1999). Surface Profile Determination from Multiple Sonar Data Using Morphological Processing. The International Journal of Robotics Research, 18(8), 788-808. DOI:10.1177/02783649922066565
Bera, S., Bhowmick, P., & Bhattach, B. (2014). A Digital-Geometric Algorithm for Generating a Complete Spherical Surface in Z3. In Applied Algorithms, 49-61. Springer.
Borenstein, J., & Koren, Y. (Aug.,1991). Histogramic in-motion mapping for mobile robot obstacle avoidance. (IEEE, Ed.) IEEE Transactions on Robotics and Automation, 7(4), 535-539. DOI:10.1109/70.86083
Bozma, O., & Kuc, R. (1991). Building a sonar map in a specular environment using a single mobile sensor. IEEE Transactions on Pattern Analysis and Machine Intelligence, 13(12), 1260-1269. DOI:10.1109/34.107000
Bresenham, J. (1977). A Linear Algorithm for Incremental Digital Display of Circular Arcs. Communications of the ACM, 20(2), 100-106. DOI:10.1145/359423.359432
Cañas, J. M., & García-Alegre, M. C. (1999). Real time EM segmentation of occupancy grid for robots navigation. In Proceedings of IJCAI-99 Workshop Adaptive Spatial Representations of Dynamic Environments, 75-79. DOI:10.1.1.42.2076
Choset , H., Nagatani, K., & Lazar, N. (2003). The arc-transversal median algorithm: a geometric approach to increasing ultrasonic sensor azimuth accuracy. IEEE Transactions on Robotics and Automation, 19(3), 513-522. DOI:10.1109/TRA.2003.810580
Devantech Limited. (2012). SRF02 Ultrasonic range finder, Technical Specification. (Robot Electronics) Retrieved from: http://www.robot-electronics.co.uk/htm/srf02tech.htm
Elfes, A. (Jun., 1987). Sonar-based real-world mapping and navigation. (IEEE, Ed.) IEEE Journal of Robotics and Automation, 3(3), 249-265. DOI:10.1109/JRA.1987.1087096
Fairfield, N., Kantor, G., & Wettergreen, D. (2007). Real-Time SLAM with Octree Evidence Grids for Exploration in Underwater Tunnels. Journal of Field Robotics, 24(1-2), 3-21. DOI: 10.1002/rob.20165
Gasós, J., & Martín, A. (Dec., 1996). A fuzzy approach to build sonar maps for mobile robots. (Elsevier, Ed.) Computers in Industry, 32(2), 151–167. DOI:10.1016/S0166-3615(96)00064-4
Hansen, R. E. (Sept., 2012). Introduction to Sonar. Retrieved September 26, 2013, from: http://www.uio.no/studier/emner/matnat/ifi/INF-GEO4310/h12/undervisningsmateriale/sonar_introduction_2012_compressed.pdf
Jaramillo, A., Prieto, F., & Boulanger, P. (2007). Inspección de piezas 3D: revisión de la literatura. Ingeniería e Investigación, 27(3), 118-126. DOI:10.15446/ing.investig
Kang, J.-G., An, S.-Y., Kim, S., & Oh, S.-Y. (2010). Sonar-Based Simultaneous Localization and Mapping Using a Neuro-Evolutionary Optimization. Advanced Robotics, 24(8-9), 1257-1289. DOI:10.1163/016918610X501435
Kinsler, L. E., Frey, A. R., Coppens, A. B., & Sanders, J. V. (2008). Fundamentos de Acústica. Mexico: Limusa.
Lee, K., Lee, S.-J., Kölsch, M., & Chung, W. K. (Oct., 2013). Enhanced maximum likelihood grid map with reprocessing incorrect sonar measurements. Autonomous Robots, 35(2-3), 123-141. DOI:10.1007/s10514-013-9340-5
Lee, S.-J., Cho, D.-W., Chung, W.-K., & Lee, Y. (2006). Evaluation of features through grid association for building a sonar map. In IEEE (Ed.), Proceedings. 2006 IEEE International Conference on Robotics and Automation, 2006. ICRA 2006., 2615 - 2620. Orlando, FL. DOI:10.1109/ROBOT.2006.1642096
Lim, J. H., & Cho, D. W. (1992). Physically based sensor modeling for a sonar map in a specular environment. In IEEE (Ed.), Proceedings. 1992 IEEE International Conference on Robotics and Automation, 1992. , 2, 1714-1719. DOI:10.1109/ROBOT.1992.220131
Montani, C., & Scopigno, R. (2009). Spheres-To-Voxels Conversion. In A. S. Glassner (Ed.), Graphics Gems, 327-334. Academic Press. Retrieved from: http://tog.acm.org/resources/GraphicsGems/
Moravec, H. P., & Elfes, A. (1985). High resolution maps from wide angle sonar. In IEEE (Ed.), Proceedings. 1985 IEEE International Conference on Robotics and Automation., 2, 116-121. St. Louis. DOI:10.1109/ROBOT.1985.1087316
Murino, V., & Trucco, A. (Dec., 2000). Three-dimensional image generation and processing in underwater acoustic vision. Proceedings of the IEEE, 88(16), 1903-1946. DOI:10.1109/5.899059
Noykov, S., & Roumenin, C. (Feb., 2007). Occupancy grids building by sonar and mobile robot. Robotics and Autonomous Systems, 55(2), 162–175. DOI:10.1016/j.robot.2006.06.004
Przybyla, R., Shelton, S., Guedes, A., Krigel, R., Horsley, D., & Boser, B. (Apr 4, 2012). In-air Ultrasonic Rangefinding and Angle Estimation. (University of California, Berkeley, CA, USA). Retrieved Oct 28, 2013, from: http://rjprzy.com/publications/przybyla_HH2012.pdf
Restrepo G., A., Loaiza Correa, H., & Caicedo B., E. (2006). Control and serial acquisition of ultrasonic signals with MATLAB. Ingeniería e Investigación, 26(1), 111-115. DOI:10.15446/ing.investig
Restrepo Girón, A. D., Loaiza Correa, H., & Caicedo Bravo, E. F. (Nov de 2009). Revisión comparativa de técnicas de reconocimiento de formas 2D con ultrasonido en un ambiente estructurado. (U.N. Colombia, Ed.) Avances en Sistemas e Informática, 6(3), 15-32. Retrieved from: http://revistas.unal.edu.co/index.php/avances/article/view/20452
Ribas, D., Ridao, P., & Neira, J. (2010). Underwater SLAM for Structured Environments Using an Imaging Sonar (Vol. 65). Springer Berlin Heidelberg. DOI:10.1007/978-3-642-14040-2
Roget, B., & Sitaraman, J. (2013). Wall Distance Search Algorithm Using Voxelized Marching Spheres. Journal of Computational Physics, 241, 76-94. DOI:10.1016/j.jcp.2013.01.035
Shi, G., Chen, C., Lin, J., Xie, X., & Chen, X. (Oct., 2012). Narrowband ultrasonic detection with high range resolution: separating echoes via compressed sensing and singular value decomposition. (IEEE, Ed.) IEEE Transactions on Ultrasonics, Ferroelectrics and Frequency Control, 59(10), 2237-2253. DOI:10.1109/TUFFC.2012.2449
Thrun, S. (Feb de 1998). Learning metric-topological maps for indoor mobile robot navigation. Artificial Intelligence, 99(1), 21-71. doi:10.1016/S0004-3702(97)00078-7
Wijk, O., & Christensen, H. (2000). Localization and navigation of a mobile robot using natural point landmarks extracted from sonar data. Robotics and Autonomous Systems, 31(1-2), 31-42. DOI:10.1016/S0921-8890(99)00085-8
Xiaole, Y., & Lichen, G. (2012). Time-delay Estimation of Ultrasonic Echoes Based on the Physical Model Matching. In IEEE (Ed.), 8th IEEE International Conference on Automation Science and Engineering. Seoul: 8th IEEE International Conference on Automation Science and Engineering. DOI:10.1109/CoASE.2012.6386333
