Introduction
Physical growth, in terms of weight, height and body mass index (BMI), is considered a parameter that reflects the pattern of growth and development in a community.1,2
Weight-for-age, height-for-age and BMI-for-age percentiles provide essential information to infer the nutritional and health status of children and adolescents.3-5 The real value of growth curves for weight, height and BMI is that they help determine the degree to which the physiological needs of children and adolescents are being met during their growth and motor development process,6 that is, anthropometric measurement is an early method and a suitable data source for assessing growth in this population.7,8
Growth reference values are consistent with the stages of human development, which are different for each biological sex.9 They can be used to assess general health status and in sports (e.g., monitoring physical adaptations and changes during a season).10
This prescriptive approach explicitly recognizes that growth reference values are often used as reference standards, i.e., as tools to make value judgments about the pediatric population of a given community or region. Therefore, child growth charts are among the instruments usually used to individually assess the nutritional and health status of children and adolescents, as well as the overall well-being of the communities in which they live.11-13
In Colombia, there are few studies on the reference values for weight, height and BMI in children and adolescents, and they focus on two aspects related to health (overweight and obesity and association between physical condition and cardiovascular risk).14 Taking into account the foregoing, the objective of this study was to construct weight-for-age, height-for-age and BMI-for-age reference growth curves of children and adolescents (2-18 years) from the department of Huila, Colombia.
Materials and methods
Study type
Cross-sectional analytical study.
Data analyzed
To construct the weight-for-age (kg), height-for-age (cm) and BMI-for-age (kg/m2) curves, data from 130 599 children and adolescents between 2 and 18 years (males, n=65 467; females, n=65 132) and users of public health institutions in the 37 municipalities of Huila, Colombia, were used. This sample comprises children and adolescents, both from the rural and urban areas of Huila and from low and middle socioeconomic levels registered between 2009 and 2016 in the System for the Identification of Potential Beneficiaries of Social Programs. It should be noted that the majority of this population is mestizo, and a small percentage is from indigenous communities. The data were provided by the Ministry of Health of the department of Huila as reported in the authorization letter to use the data, file number 2017sal00002074-1 of February 22, 2017. The distribution of participants by age group and sex is described in Table 1.
Table 1. Distribution of the sample by age and sex.
|
Age
(years)
|
Sex
|
Total
|
|
Male
|
Female
|
|
2.0
|
94
|
80
|
174
|
|
2.5
|
58
|
56
|
114
|
|
3.0
|
53
|
74
|
127
|
|
3.5
|
64
|
66
|
130
|
|
4.0
|
58
|
66
|
124
|
|
4.5
|
59
|
57
|
116
|
|
5.0
|
4 656
|
4 527
|
9 183
|
|
5.5
|
9 740
|
9 394
|
19 134
|
|
6.0
|
9 635
|
9 137
|
18 772
|
|
6.5
|
8 961
|
8 421
|
17 382
|
|
7.0
|
8 234
|
7 777
|
16 011
|
|
7.5
|
4 096
|
4 154
|
8 250
|
|
8.0
|
4 752
|
4 755
|
9 507
|
|
8.5
|
3 502
|
3 373
|
6 875
|
|
9.0
|
3 978
|
3 823
|
7 801
|
|
9.5
|
2 582
|
2 624
|
5 206
|
|
10.0
|
1 538
|
1 432
|
2 970
|
|
10.5
|
529
|
544
|
1 073
|
|
11.0
|
356
|
407
|
763
|
|
11.5
|
222
|
306
|
528
|
|
12.0
|
186
|
284
|
470
|
|
12.5
|
160
|
259
|
419
|
|
13.0
|
191
|
239
|
430
|
|
13.5
|
116
|
239
|
355
|
|
14.0
|
241
|
412
|
653
|
|
14.5
|
330
|
481
|
811
|
|
15.0
|
191
|
340
|
531
|
|
15.5
|
132
|
312
|
444
|
|
16.0
|
157
|
282
|
439
|
|
16.5
|
129
|
266
|
395
|
|
17.0
|
180
|
350
|
530
|
|
17.5
|
199
|
375
|
574
|
|
18.0
|
88
|
220
|
308
|
|
Total
|
65 467
|
65 132
|
130 599
|
Source: Own elaboration.
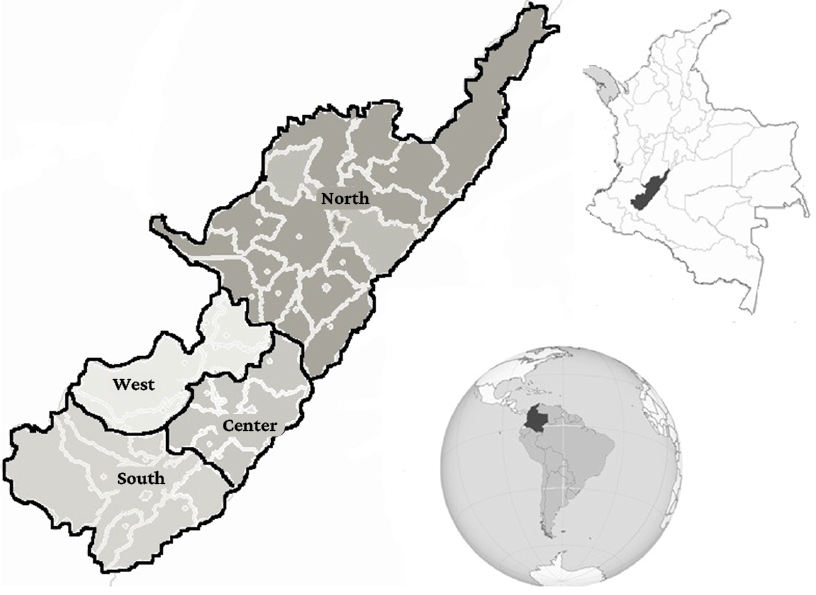
Geographical location of the population
The department of Huila is located in southern Colombia and comprises 37 municipalities grouped into four regions (center, north, west, and south) (Figure 1). Huila is characterized by a variety of climates, and temperatures change depending on altitude. According to the census carried out by the National Administrative Department of Statistics (DANE),15 its population was 1 011 418 inhabitants in 2005, of whom 697 093 lived in the municipal seats and 476 785 in the rest of the territory. Ethnically, the population is divided into mestizos (97.75%), Afro-descendants (1.17%), and indigenous peoples (1.05%).
Figure 1. Geographical characterization of the department of Huila, Colombia.
Source: Own elaboration.
Statistical analysis
The weight-for-age (kg), height-for-age (cm) and BMI-for-age (kg/m2) percentiles for each established age range (every 6 months) were determined using the LMS method. In addition, Box-Cox transformations were used to fit the data to a normal distribution.16 The L, M and S values were smoothed for each age and sex range,17 and the percentiles considered appropriate (3rd, 10th, 25th, 50th, 75th, 90th and 97th) were selected as specific reference values for each age and sex range. The construction of the percentile curves was performed in the LMSchartmaker Pro software (version 2.54; The Institute of Child Health, London, UK) using three curves representing asymmetry (L curve), median (M curve) and coefficient of variation (S curve).
Ethical considerations
This study was carried out in accordance with the ethical principles for conducting biomedical studies involving human subjects established in the Declaration of Helsinki18 and the scientific, technical and administrative standards in health research of Resolution 8430 of 1993 issued by the Colombian Ministry of Health.19 In addition, it was approved by the Research Ethics Committee of the Fundación del Caribe para la Investigación Biomédica - BIOS by means of Minutes 0127 of July 31, 2015.
Results
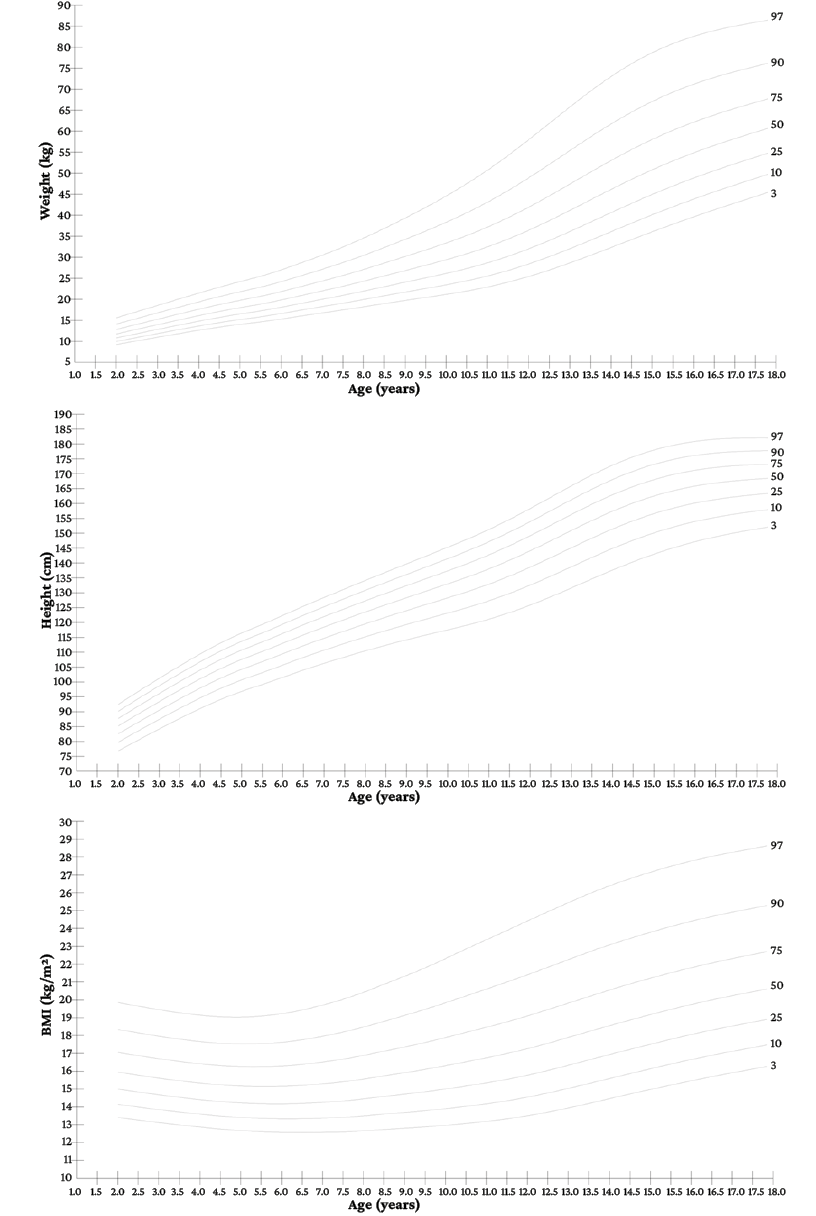
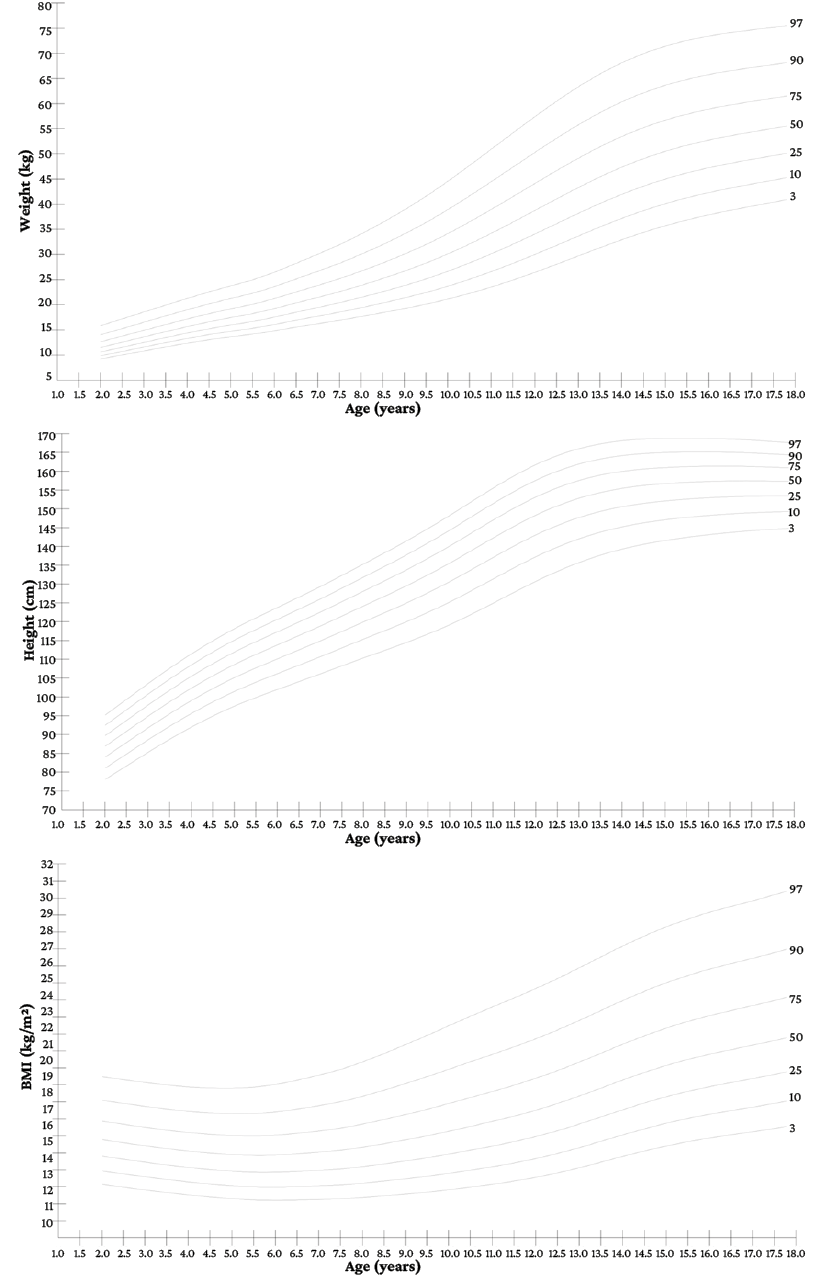
The distribution of for weight-for-age, height-for-age and BMI-for-age percentiles by age and sex is presented in Tables 2, 3 and 4. In all cases, it was found that: (i) the values showed an increase as age increased; (ii) a good normalization adjustment of the data was obtained, as shown by the proximity between expected and adjusted values, and (iii) the weight-for-age and height-for-age curves show the expected sigmoidal growth representation patterns. The reference percentile curves are presented in Figures 2 and 3.
Figure 2. Weight-for-age (kg), height-for-age (cm) and body mass index-for-age (kg/m2) percentile curves for male children and adolescents between 2 and 18 years of age from Huila, Colombia.
Source: Own elaboration.
Figure 3. Weight-for-age (kg), height-for-age (cm) and body mass index-for-age (kg/m2) percentile curves for female children and adolescents between 2 and 18 years of age from Huila, Colombia.
Source: Own elaboration.
Regarding weight, the following was observed in males: (i) in the 97th percentile, the greatest increase occurs at age 13, while in the 50th, 75th and 90th percentiles, it occurs at age 13.5 (between 2.56kg and 3.27kg), and in the 3rd, 10th and 25th percentiles at age 14 (between 1.95kg and 2.11kg); (ii) in the 50th percentile, the increase remains above 2kg between the ages of 12 and 15.5, with the maximum increase (2.56kg) at age 13.5; (iii) in the 90th and 97th percentiles, increases above 3kg are observed between ages 11.5 and 13.5; and finally (iv) at the age of 18 years, increases >1kg are observed in the 3rd, 10th, 25th, 50th and 75th percentiles, and <1kg in the 90th and 97th percentiles (Figure 2 and Table 2).
On the other hand, regarding the female sex, the following was found: (i) in the 50th, 75th, 90th and 97th percentiles, the greatest increase occurs at the ages of 12 and 13 (between 2.3kg and 3.3kg), while in the 3rd, 10th and 25th percentiles, it occurs at the ages of 12.5 and 13 (between 1.68kg and 2.07kg), and from then on, this increase declines until the age of 18 years in all percentiles; (ii) in the 50th percentile, the increase remains above 2kg between 10.5 and 13.5 years, with the maximum increase (2.3kg) at 12 years; (iii) in the 97th percentile, increases above 3kg occur between 9.5 and 12.5 years; and finally, (iv) increases are <1kg in all percentiles between the ages of 16 and 18 years (Figure 3 and Table 2).
Concerning height-for-age, the following was observed in males: (i) in all percentiles, the greatest increase occurs between ages 13 and 13.5 (between 3.15cm and 3.93cm); (ii) in the 50th percentile, the increase remains above 3cm between the ages of 12 and 14, with the maximum increase (3.58cm) occurring at 13 years of age; and (iii) there are increases <1cm from age 15.5 in the 97th percentile, age 16 in the 50th, 75th and 90th percentiles, age 16.5 years in the 10th and 25th percentiles, and age 17 in the 3rd percentile (Figure 2 and Table 3).
With regard to the female sex, the following was found: (i) in the 3rd, 10th, 25th and 50th percentiles, the greatest increase was observed at age 11 (between 3.11cm and 3cm), while in the 75th, 90th and 97th percentiles it occurs at age 10.5 (between 3.49cm and 3.67cm); (ii) in the 50th percentile, the increase remains above 3cm between ages 9.5 and 11.5, with the maximum increase (3.39cm) at 11 years of age; and (iii) there are increases <1cm starting at age 13.5 in the 50th, 75th, 90th and 97th percentiles, starting at age 14 years in the 10th and 25th percentiles, and starting at age 14.5 in the 3rd percentile (Figure 3 and Table 3).
With respect to BMI, the following was found in males: (i) in all percentiles, the increases do not exceed 1kg/m2; (ii) in the 90th and 95th percentiles, the increases occur from the age of 5, in the 75th percentile from the age of 5.5, in the 10th, 25th and 50th percentiles from the age of 6, and in the 3rd percentile from the age of 6.5; (iii) in the 50th percentile, there are increases greater than 0.30kg/m2 between the ages of 12.5 and 14.5; and finally, (iv) the greatest increases occur at 10 and 13.5 years in the 97th percentile, at 12.5 and 13 years in the 50th, 75th and 90th percentiles, and at 13.5 and 14 years in the 3rd, 10th and 25th percentiles (Figure 2 and Table 4).
As for the female sex, the following was found: (i) in all percentiles, the increases do not exceed 1kg/m2; (ii) there are increases in the 90th and 97th percentiles from the age of 5, in the 25th, 50th and 75th percentiles from the age of 5.5, and in the 3rd and 10th percentiles from the age of 6; (iii) in all percentiles, the greatest increase occurs between 13 and 14 years; and (vi) in the 50th percentile, the increases are >0.40kg/m2 between 13 and 15 years (Figure 3 and Table 4).
Table 2. Distribution weight-for-age (kg) percentiles in children and adolescents between 2 and 18 years of age from Huila, Colombia.
|
Age
(years)
|
Male
|
Female
|
|
L
|
S
|
3
|
10
|
25
|
50 (M)
|
75
|
90
|
97
|
L
|
S
|
3
|
10
|
25
|
50 (M)
|
75
|
90
|
97
|
|
2.0
|
-0.71
|
0.13
|
9.48
|
10.15
|
10.91
|
11.87
|
12.99
|
14.16
|
15.50
|
-0.99
|
0.12
|
9.33
|
9.99
|
10.75
|
11.64
|
12.68
|
13.94
|
15.46
|
|
2.5
|
-0.71
|
0.13
|
10.37
|
11.10
|
11.92
|
12.98
|
14.20
|
15.48
|
16.95
|
-0.95
|
0.13
|
10.14
|
10.87
|
11.72
|
12.69
|
13.85
|
15.22
|
16.89
|
|
3.0
|
-0.71
|
0.13
|
11.25
|
12.03
|
12.93
|
14.08
|
15.40
|
16.79
|
18.39
|
-0.90
|
0.13
|
10.95
|
11.75
|
12.68
|
13.75
|
15.02
|
16.52
|
18.33
|
|
3.5
|
-0.71
|
0.13
|
12.11
|
12.96
|
13.93
|
15.17
|
16.60
|
18.10
|
19.83
|
-0.86
|
0.13
|
11.73
|
12.61
|
13.62
|
14.80
|
16.17
|
17.81
|
19.77
|
|
4.0
|
-0.71
|
0.13
|
12.94
|
13.85
|
14.90
|
16.23
|
17.78
|
19.40
|
21.26
|
-0.81
|
0.13
|
12.47
|
13.43
|
14.53
|
15.80
|
17.29
|
19.06
|
21.19
|
|
4.5
|
-0.71
|
0.13
|
13.71
|
14.69
|
15.81
|
17.23
|
18.89
|
20.64
|
22.65
|
-0.78
|
0.13
|
13.15
|
14.19
|
15.37
|
16.75
|
18.35
|
20.26
|
22.55
|
|
5.0
|
-0.71
|
0.13
|
14.40
|
15.44
|
16.63
|
18.15
|
19.92
|
21.79
|
23.95
|
-0.74
|
0.14
|
13.75
|
14.85
|
16.12
|
17.60
|
19.32
|
21.37
|
23.82
|
|
5.5
|
-0.71
|
0.14
|
15.01
|
16.11
|
17.37
|
18.99
|
20.89
|
22.89
|
25.21
|
-0.72
|
0.14
|
14.28
|
15.46
|
16.82
|
18.40
|
20.25
|
22.44
|
25.08
|
|
6.0
|
-0.71
|
0.14
|
15.71
|
16.89
|
18.24
|
19.98
|
22.02
|
24.19
|
26.71
|
-0.69
|
0.14
|
14.95
|
16.22
|
17.68
|
19.39
|
21.39
|
23.77
|
26.64
|
|
6.5
|
-0.71
|
0.14
|
16.48
|
17.74
|
19.20
|
21.08
|
23.29
|
25.65
|
28.41
|
-0.67
|
0.15
|
15.70
|
17.07
|
18.66
|
20.52
|
22.71
|
25.31
|
28.46
|
|
7.0
|
-0.71
|
0.15
|
17.22
|
18.57
|
20.14
|
22.17
|
24.57
|
27.15
|
30.18
|
-0.65
|
0.15
|
16.39
|
17.88
|
19.60
|
21.62
|
24.01
|
26.86
|
30.31
|
|
7.5
|
-0.71
|
0.15
|
17.95
|
19.40
|
21.09
|
23.29
|
25.91
|
28.73
|
32.07
|
-0.62
|
0.16
|
17.10
|
18.71
|
20.58
|
22.77
|
25.37
|
28.49
|
32.28
|
|
8.0
|
-0.71
|
0.16
|
18.72
|
20.29
|
22.11
|
24.50
|
27.35
|
30.45
|
34.15
|
-0.59
|
0.16
|
17.86
|
19.60
|
21.64
|
24.03
|
26.87
|
30.29
|
34.45
|
|
8.5
|
-0.71
|
0.16
|
19.52
|
21.20
|
23.17
|
25.76
|
28.89
|
32.30
|
36.41
|
-0.55
|
0.17
|
18.67
|
20.57
|
22.79
|
25.40
|
28.52
|
32.26
|
36.82
|
|
9.0
|
-0.71
|
0.17
|
20.30
|
22.10
|
24.23
|
27.04
|
30.45
|
34.21
|
38.77
|
-0.50
|
0.17
|
19.52
|
21.59
|
24.02
|
26.88
|
30.29
|
34.39
|
39.39
|
|
9.5
|
-0.71
|
0.18
|
21.05
|
22.99
|
25.28
|
28.32
|
32.05
|
36.19
|
41.26
|
-0.45
|
0.18
|
20.45
|
22.72
|
25.38
|
28.51
|
32.24
|
36.73
|
42.18
|
|
10.0
|
-0.71
|
0.18
|
21.83
|
23.90
|
26.37
|
29.67
|
33.73
|
38.29
|
43.93
|
-0.40
|
0.18
|
21.52
|
24.00
|
26.91
|
30.35
|
34.43
|
39.32
|
45.25
|
|
10.5
|
-0.71
|
0.19
|
22.69
|
24.91
|
27.56
|
31.12
|
35.55
|
40.55
|
46.80
|
-0.35
|
0.19
|
22.72
|
25.44
|
28.62
|
32.36
|
36.80
|
42.10
|
48.49
|
|
11.0
|
-0.71
|
0.19
|
23.70
|
26.07
|
28.92
|
32.77
|
37.58
|
43.06
|
49.96
|
-0.31
|
0.19
|
24.05
|
27.01
|
30.45
|
34.50
|
39.29
|
44.97
|
51.79
|
|
11.5
|
-0.71
|
0.20
|
24.91
|
27.45
|
30.51
|
34.66
|
39.88
|
45.84
|
53.41
|
-0.27
|
0.19
|
25.50
|
28.69
|
32.40
|
36.74
|
41.84
|
47.88
|
55.07
|
|
12.0
|
-0.71
|
0.20
|
26.33
|
29.05
|
32.33
|
36.79
|
42.42
|
48.88
|
57.11
|
-0.23
|
0.19
|
27.06
|
30.47
|
34.42
|
39.04
|
44.43
|
50.78
|
58.28
|
|
12.5
|
-0.71
|
0.20
|
27.95
|
30.85
|
34.36
|
39.14
|
45.17
|
52.11
|
60.96
|
-0.21
|
0.19
|
28.70
|
32.31
|
36.49
|
41.34
|
46.98
|
53.58
|
61.34
|
|
13.0
|
-0.71
|
0.20
|
29.73
|
32.82
|
36.55
|
41.62
|
48.04
|
55.42
|
64.83
|
-0.19
|
0.19
|
30.38
|
34.17
|
38.54
|
43.58
|
49.43
|
56.22
|
64.16
|
|
13.5
|
-0.71
|
0.20
|
31.63
|
34.89
|
38.83
|
44.18
|
50.94
|
58.69
|
68.55
|
-0.17
|
0.18
|
32.05
|
35.98
|
40.50
|
45.70
|
51.69
|
58.62
|
66.67
|
|
14.0
|
-0.71
|
0.20
|
33.58
|
37.00
|
41.12
|
46.71
|
53.74
|
61.78
|
71.97
|
-0.16
|
0.18
|
33.63
|
37.68
|
42.31
|
47.61
|
53.70
|
60.72
|
68.81
|
|
14.5
|
-0.71
|
0.19
|
35.52
|
39.08
|
43.35
|
49.13
|
56.36
|
64.59
|
74.95
|
-0.15
|
0.17
|
35.06
|
39.20
|
43.91
|
49.28
|
55.42
|
62.47
|
70.57
|
|
15.0
|
-0.71
|
0.19
|
37.41
|
41.08
|
45.47
|
51.38
|
58.73
|
67.04
|
77.43
|
-0.15
|
0.17
|
36.34
|
40.53
|
45.29
|
50.70
|
56.86
|
63.90
|
71.97
|
|
15.5
|
-0.71
|
0.18
|
39.23
|
42.98
|
47.45
|
53.43
|
60.83
|
69.13
|
79.42
|
-0.15
|
0.17
|
37.46
|
41.68
|
46.46
|
51.88
|
58.04
|
65.06
|
73.06
|
|
16.0
|
-0.71
|
0.18
|
40.95
|
44.76
|
49.27
|
55.28
|
62.66
|
70.87
|
80.97
|
-0.15
|
0.16
|
38.41
|
42.66
|
47.45
|
52.86
|
59.00
|
65.97
|
73.89
|
|
16.5
|
-0.71
|
0.17
|
42.58
|
46.41
|
50.94
|
56.93
|
64.23
|
72.29
|
82.11
|
-0.15
|
0.16
|
39.25
|
43.50
|
48.28
|
53.68
|
59.78
|
66.69
|
74.53
|
|
17.0
|
-0.71
|
0.17
|
44.12
|
47.96
|
52.47
|
58.41
|
65.59
|
73.46
|
82.96
|
-0.15
|
0.16
|
40.00
|
44.25
|
49.03
|
54.40
|
60.46
|
67.30
|
75.05
|
|
17.5
|
-0.71
|
0.16
|
45.60
|
49.43
|
53.92
|
59.78
|
66.82
|
74.47
|
83.61
|
-0.15
|
0.15
|
40.73
|
44.98
|
49.74
|
55.08
|
61.10
|
67.88
|
75.54
|
|
18.0
|
-0.71
|
0.15
|
47.07
|
50.88
|
55.32
|
61.10
|
67.98
|
75.40
|
84.19
|
-0.15
|
0.15
|
41.46
|
45.70
|
50.45
|
55.76
|
61.74
|
68.45
|
76.03
|
Source: Own elaboration.
Table 3. Distribution height-for-age (cm) percentiles in children and adolescents between 2 and 18 years of age from Huila, Colombia.
|
Age
(years)
|
Male
|
Female
|
|
L
|
S
|
3
|
10
|
25
|
50 (M)
|
75
|
90
|
97
|
L
|
S
|
3
|
10
|
25
|
50 (M)
|
75
|
90
|
97
|
|
2.0
|
2.72
|
0.05
|
74.51
|
78.04
|
81.32
|
84.38
|
87.27
|
90.00
|
92.59
|
1.12
|
0.05
|
80.16
|
82.82
|
85.50
|
88.47
|
91.43
|
94.08
|
96.69
|
|
2.5
|
2.77
|
0.05
|
78.75
|
82.38
|
85.74
|
88.88
|
91.84
|
94.64
|
97.29
|
1.34
|
0.05
|
83.55
|
86.33
|
89.11
|
92.17
|
95.19
|
97.89
|
100.52
|
|
3.0
|
2.83
|
0.05
|
82.93
|
86.63
|
90.07
|
93.28
|
96.30
|
99.16
|
101.88
|
1.55
|
0.05
|
86.90
|
89.80
|
92.68
|
95.83
|
98.91
|
101.65
|
104.31
|
|
3.5
|
2.88
|
0.05
|
86.94
|
90.72
|
94.22
|
97.49
|
100.57
|
103.48
|
106.24
|
1.76
|
0.05
|
90.19
|
93.20
|
96.18
|
99.41
|
102.56
|
105.34
|
108.03
|
|
4.0
|
2.93
|
0.05
|
90.70
|
94.54
|
98.10
|
101.42
|
104.55
|
107.50
|
110.31
|
1.96
|
0.05
|
93.34
|
96.47
|
99.55
|
102.87
|
106.08
|
108.90
|
111.62
|
|
4.5
|
2.97
|
0.05
|
94.13
|
98.02
|
101.62
|
104.99
|
108.16
|
111.16
|
114.00
|
2.14
|
0.05
|
96.28
|
99.54
|
102.72
|
106.13
|
109.41
|
112.28
|
115.03
|
|
5.0
|
3.01
|
0.05
|
97.11
|
101.05
|
104.70
|
108.12
|
111.33
|
114.36
|
117.24
|
2.30
|
0.05
|
98.96
|
102.34
|
105.63
|
109.13
|
112.49
|
115.41
|
118.20
|
|
5.5
|
3.04
|
0.05
|
99.68
|
103.68
|
107.38
|
110.84
|
114.10
|
117.17
|
120.09
|
2.44
|
0.05
|
101.34
|
104.85
|
108.25
|
111.85
|
115.30
|
118.27
|
121.11
|
|
6.0
|
3.05
|
0.05
|
102.25
|
106.32
|
110.09
|
113.62
|
116.94
|
120.07
|
123.04
|
2.56
|
0.05
|
103.54
|
107.19
|
110.71
|
114.42
|
117.95
|
121.00
|
123.89
|
|
6.5
|
3.05
|
0.05
|
104.80
|
108.97
|
112.84
|
116.45
|
119.85
|
123.06
|
126.11
|
2.67
|
0.05
|
105.70
|
109.50
|
113.14
|
116.97
|
120.60
|
123.72
|
126.67
|
|
7.0
|
3.04
|
0.05
|
107.15
|
111.44
|
115.42
|
119.14
|
122.64
|
125.94
|
129.07
|
2.75
|
0.05
|
107.88
|
111.83
|
115.61
|
119.56
|
123.30
|
126.50
|
129.53
|
|
7.5
|
3.02
|
0.05
|
109.35
|
113.79
|
117.91
|
121.75
|
125.36
|
128.77
|
132.01
|
2.83
|
0.05
|
110.09
|
114.22
|
118.14
|
122.23
|
126.09
|
129.39
|
132.50
|
|
8.0
|
3.00
|
0.05
|
111.45
|
116.05
|
120.32
|
124.30
|
128.04
|
131.57
|
134.93
|
2.89
|
0.05
|
112.29
|
116.61
|
120.69
|
124.94
|
128.93
|
132.33
|
135.53
|
|
8.5
|
2.98
|
0.05
|
113.40
|
118.18
|
122.61
|
126.75
|
130.63
|
134.30
|
137.78
|
2.95
|
0.05
|
114.47
|
118.98
|
123.23
|
127.65
|
131.78
|
135.30
|
138.60
|
|
9.0
|
2.95
|
0.05
|
115.25
|
120.23
|
124.85
|
129.15
|
133.19
|
137.00
|
140.62
|
3.01
|
0.05
|
116.72
|
121.44
|
125.87
|
130.46
|
134.74
|
138.37
|
141.78
|
|
9.5
|
2.94
|
0.05
|
117.02
|
122.24
|
127.06
|
131.55
|
135.75
|
139.72
|
143.49
|
3.06
|
0.05
|
119.16
|
124.09
|
128.70
|
133.46
|
137.89
|
141.64
|
145.15
|
|
10.0
|
2.94
|
0.05
|
118.75
|
124.22
|
129.26
|
133.95
|
138.34
|
142.47
|
146.39
|
3.11
|
0.05
|
121.86
|
126.98
|
131.76
|
136.67
|
141.24
|
145.10
|
148.70
|
|
10.5
|
2.94
|
0.05
|
120.52
|
126.26
|
131.53
|
136.42
|
140.99
|
145.29
|
149.36
|
3.15
|
0.05
|
124.82
|
130.10
|
135.01
|
140.05
|
144.73
|
148.68
|
152.37
|
|
11.0
|
2.96
|
0.05
|
122.50
|
128.51
|
134.01
|
139.11
|
143.86
|
148.33
|
152.54
|
3.18
|
0.05
|
127.93
|
133.30
|
138.31
|
143.44
|
148.20
|
152.21
|
155.96
|
|
11.5
|
2.97
|
0.05
|
124.80
|
131.08
|
136.81
|
142.10
|
147.03
|
151.66
|
156.02
|
3.21
|
0.05
|
131.02
|
136.44
|
141.48
|
146.66
|
151.45
|
155.50
|
159.29
|
|
12.0
|
2.99
|
0.05
|
127.42
|
133.95
|
139.90
|
145.38
|
150.48
|
155.26
|
159.77
|
3.22
|
0.05
|
133.94
|
139.34
|
144.37
|
149.53
|
154.33
|
158.38
|
162.16
|
|
12.5
|
3.01
|
0.05
|
130.33
|
137.08
|
143.22
|
148.88
|
154.13
|
159.05
|
163.68
|
3.23
|
0.05
|
136.55
|
141.86
|
146.82
|
151.93
|
156.68
|
160.69
|
164.45
|
|
13.0
|
3.03
|
0.05
|
133.43
|
140.36
|
146.66
|
152.46
|
157.84
|
162.87
|
167.61
|
3.23
|
0.05
|
138.76
|
143.94
|
148.80
|
153.80
|
158.47
|
162.43
|
166.14
|
|
13.5
|
3.05
|
0.05
|
136.58
|
143.63
|
150.03
|
155.92
|
161.39
|
166.50
|
171.31
|
3.22
|
0.05
|
140.55
|
145.57
|
150.29
|
155.17
|
159.74
|
163.62
|
167.25
|
|
14.0
|
3.07
|
0.05
|
139.59
|
146.69
|
153.14
|
159.07
|
164.57
|
169.72
|
174.57
|
3.21
|
0.04
|
141.93
|
146.79
|
151.37
|
156.12
|
160.57
|
164.36
|
167.92
|
|
14.5
|
3.09
|
0.05
|
142.38
|
149.44
|
155.87
|
161.78
|
167.27
|
172.41
|
177.25
|
3.20
|
0.04
|
142.97
|
147.67
|
152.12
|
156.74
|
161.08
|
164.78
|
168.27
|
|
15.0
|
3.12
|
0.05
|
144.89
|
151.85
|
158.19
|
164.04
|
169.47
|
174.56
|
179.36
|
3.19
|
0.04
|
143.77
|
148.33
|
152.65
|
157.15
|
161.40
|
165.01
|
168.42
|
|
15.5
|
3.14
|
0.05
|
147.09
|
153.88
|
160.09
|
165.83
|
171.16
|
176.17
|
180.88
|
3.18
|
0.04
|
144.43
|
148.85
|
153.06
|
157.46
|
161.60
|
165.14
|
168.48
|
|
16.0
|
3.16
|
0.05
|
148.95
|
155.53
|
161.56
|
167.14
|
172.35
|
177.23
|
181.84
|
3.18
|
0.04
|
144.97
|
149.27
|
153.37
|
157.66
|
161.72
|
165.18
|
168.46
|
|
16.5
|
3.19
|
0.05
|
150.45
|
156.77
|
162.59
|
167.98
|
173.02
|
177.76
|
182.23
|
3.18
|
0.04
|
145.41
|
149.59
|
153.59
|
157.78
|
161.74
|
165.13
|
168.34
|
|
17.0
|
3.21
|
0.04
|
151.62
|
157.66
|
163.24
|
168.42
|
173.27
|
177.84
|
182.16
|
3.18
|
0.04
|
145.74
|
149.81
|
153.70
|
157.79
|
161.65
|
164.97
|
168.11
|
|
17.5
|
3.23
|
0.04
|
152.55
|
158.30
|
163.62
|
168.57
|
173.22
|
177.61
|
181.77
|
3.19
|
0.04
|
145.98
|
149.93
|
153.71
|
157.69
|
161.46
|
164.70
|
167.76
|
|
18.0
|
3.26
|
0.04
|
153.35
|
158.80
|
163.86
|
168.58
|
173.03
|
177.23
|
181.21
|
3.19
|
0.04
|
146.17
|
150.00
|
153.67
|
157.54
|
161.21
|
164.36
|
167.35
|
Source: Own elaboration.
Table 4. Distribution of body mass index-for-age (kg/m2) percentiles in children and adolescents between 2 and 18 years of age in Huila, Colombia.
|
Age
(years)
|
Male
|
Female
|
|
L
|
S
|
3
|
10
|
25
|
50 (M)
|
75
|
90
|
97
|
L
|
S
|
3
|
10
|
25
|
50 (M)
|
75
|
90
|
97
|
|
2.0
|
-1.18
|
0.10
|
13.51
|
14.19
|
14.96
|
15.93
|
17.06
|
18.23
|
19.57
|
-0.78
|
0.10
|
13.27
|
13.99
|
14.78
|
15.76
|
16.87
|
17.99
|
19.23
|
|
2.5
|
-1.18
|
0.10
|
13.37
|
14.04
|
14.81
|
15.77
|
16.88
|
18.04
|
19.37
|
-0.80
|
0.10
|
13.11
|
13.81
|
14.61
|
15.59
|
16.69
|
17.81
|
19.06
|
|
3.0
|
-1.18
|
0.10
|
13.23
|
13.90
|
14.66
|
15.61
|
16.72
|
17.86
|
19.18
|
-0.82
|
0.10
|
12.95
|
13.65
|
14.44
|
15.41
|
16.52
|
17.64
|
18.90
|
|
3.5
|
-1.18
|
0.10
|
13.11
|
13.77
|
14.52
|
15.47
|
16.57
|
17.71
|
19.02
|
-0.85
|
0.10
|
12.79
|
13.49
|
14.28
|
15.25
|
16.36
|
17.49
|
18.75
|
|
4.0
|
-1.18
|
0.10
|
12.99
|
13.65
|
14.40
|
15.35
|
16.44
|
17.58
|
18.89
|
-0.87
|
0.10
|
12.66
|
13.35
|
14.13
|
15.11
|
16.22
|
17.36
|
18.64
|
|
4.5
|
-1.18
|
0.10
|
12.89
|
13.55
|
14.30
|
15.25
|
16.35
|
17.49
|
18.81
|
-0.90
|
0.10
|
12.54
|
13.23
|
14.02
|
15.00
|
16.12
|
17.27
|
18.58
|
|
5.0
|
-1.18
|
0.10
|
12.81
|
13.48
|
14.23
|
15.19
|
16.29
|
17.45
|
18.79
|
-0.93
|
0.11
|
12.44
|
13.14
|
13.93
|
14.92
|
16.05
|
17.23
|
18.56
|
|
5.5
|
-1.18
|
0.10
|
12.76
|
13.43
|
14.19
|
15.16
|
16.29
|
17.47
|
18.84
|
-0.97
|
0.11
|
12.37
|
13.07
|
13.87
|
14.87
|
16.03
|
17.23
|
18.61
|
|
6.0
|
-1.18
|
0.10
|
12.72
|
13.40
|
14.18
|
15.17
|
16.32
|
17.54
|
18.95
|
-1.01
|
0.11
|
12.35
|
13.06
|
13.87
|
14.89
|
16.08
|
17.32
|
18.75
|
|
6.5
|
-1.18
|
0.11
|
12.71
|
13.41
|
14.21
|
15.23
|
16.42
|
17.68
|
19.15
|
-1.04
|
0.11
|
12.37
|
13.09
|
13.92
|
14.97
|
16.19
|
17.48
|
18.98
|
|
7.0
|
-1.18
|
0.11
|
12.73
|
13.44
|
14.27
|
15.32
|
16.55
|
17.87
|
19.42
|
-1.07
|
0.11
|
12.40
|
13.14
|
13.98
|
15.06
|
16.33
|
17.68
|
19.26
|
|
7.5
|
-1.18
|
0.11
|
12.76
|
13.49
|
14.34
|
15.43
|
16.72
|
18.10
|
19.74
|
-1.09
|
0.12
|
12.44
|
13.20
|
14.06
|
15.18
|
16.50
|
17.92
|
19.59
|
|
8.0
|
-1.18
|
0.12
|
12.82
|
13.58
|
14.46
|
15.59
|
16.94
|
18.39
|
20.12
|
-1.11
|
0.12
|
12.52
|
13.30
|
14.20
|
15.36
|
16.74
|
18.23
|
20.00
|
|
8.5
|
-1.18
|
0.12
|
12.90
|
13.68
|
14.59
|
15.77
|
17.18
|
18.71
|
20.54
|
-1.11
|
0.13
|
12.62
|
13.43
|
14.36
|
15.57
|
17.02
|
18.59
|
20.47
|
|
9.0
|
-1.18
|
0.12
|
12.97
|
13.78
|
14.72
|
15.95
|
17.42
|
19.03
|
20.97
|
-1.11
|
0.13
|
12.73
|
13.56
|
14.53
|
15.79
|
17.31
|
18.97
|
20.98
|
|
9.5
|
-1.18
|
0.13
|
13.05
|
13.88
|
14.86
|
16.13
|
17.67
|
19.36
|
21.43
|
-1.10
|
0.13
|
12.86
|
13.72
|
14.72
|
16.04
|
17.63
|
19.38
|
21.50
|
|
10.0
|
-1.18
|
0.13
|
13.14
|
14.00
|
15.01
|
16.34
|
17.95
|
19.74
|
21.92
|
-1.08
|
0.14
|
13.01
|
13.90
|
14.95
|
16.32
|
17.99
|
19.82
|
22.06
|
|
10.5
|
-1.18
|
0.14
|
13.25
|
14.14
|
15.19
|
16.56
|
18.25
|
20.12
|
22.44
|
-1.06
|
0.14
|
13.17
|
14.10
|
15.18
|
16.61
|
18.34
|
20.26
|
22.60
|
|
11.0
|
-1.18
|
0.14
|
13.38
|
14.29
|
15.37
|
16.79
|
18.54
|
20.50
|
22.94
|
-1.03
|
0.14
|
13.35
|
14.30
|
15.42
|
16.90
|
18.70
|
20.68
|
23.11
|
|
11.5
|
-1.18
|
0.14
|
13.52
|
14.46
|
15.57
|
17.04
|
18.85
|
20.89
|
23.44
|
-1.00
|
0.14
|
13.54
|
14.52
|
15.68
|
17.21
|
19.07
|
21.11
|
23.62
|
|
12.0
|
-1.18
|
0.14
|
13.71
|
14.67
|
15.80
|
17.31
|
19.18
|
21.29
|
23.94
|
-0.96
|
0.15
|
13.76
|
14.78
|
15.98
|
17.55
|
19.47
|
21.57
|
24.14
|
|
12.5
|
-1.18
|
0.14
|
13.92
|
14.91
|
16.07
|
17.62
|
19.54
|
21.71
|
24.44
|
-0.93
|
0.15
|
14.03
|
15.08
|
16.32
|
17.94
|
19.91
|
22.07
|
24.70
|
|
13.0
|
-1.18
|
0.14
|
14.17
|
15.17
|
16.36
|
17.95
|
19.91
|
22.13
|
24.93
|
-0.89
|
0.15
|
14.34
|
15.43
|
16.70
|
18.38
|
20.40
|
22.62
|
25.30
|
|
13.5
|
-1.18
|
0.14
|
14.43
|
15.45
|
16.67
|
18.28
|
20.28
|
22.54
|
25.40
|
-0.86
|
0.15
|
14.68
|
15.80
|
17.12
|
18.85
|
20.93
|
23.20
|
25.93
|
|
14.0
|
-1.18
|
0.14
|
14.70
|
15.74
|
16.97
|
18.61
|
20.64
|
22.93
|
25.82
|
-0.83
|
0.15
|
15.02
|
16.19
|
17.55
|
19.32
|
21.45
|
23.77
|
26.55
|
|
14.5
|
-1.18
|
0.14
|
14.96
|
16.01
|
17.26
|
18.92
|
20.97
|
23.28
|
26.20
|
-0.80
|
0.15
|
15.35
|
16.55
|
17.95
|
19.76
|
21.94
|
24.31
|
27.13
|
|
15.0
|
-1.18
|
0.14
|
15.22
|
16.28
|
17.54
|
19.21
|
21.28
|
23.60
|
26.53
|
-0.77
|
0.15
|
15.65
|
16.88
|
18.31
|
20.17
|
22.39
|
24.79
|
27.64
|
|
15.5
|
-1.18
|
0.14
|
15.47
|
16.54
|
17.81
|
19.49
|
21.57
|
23.90
|
26.83
|
-0.75
|
0.15
|
15.91
|
17.16
|
18.62
|
20.52
|
22.77
|
25.21
|
28.09
|
|
16.0
|
-1.18
|
0.14
|
15.71
|
16.79
|
18.07
|
19.76
|
21.85
|
24.18
|
27.10
|
-0.72
|
0.15
|
16.13
|
17.41
|
18.89
|
20.81
|
23.10
|
25.56
|
28.47
|
|
16.5
|
-1.18
|
0.14
|
15.94
|
17.03
|
18.31
|
20.01
|
22.10
|
24.43
|
27.34
|
-0.70
|
0.15
|
16.31
|
17.62
|
19.12
|
21.08
|
23.39
|
25.88
|
28.80
|
|
17.0
|
-1.18
|
0.14
|
16.15
|
17.24
|
18.53
|
20.23
|
22.32
|
24.65
|
27.54
|
-0.68
|
0.15
|
16.50
|
17.82
|
19.35
|
21.33
|
23.67
|
26.17
|
29.12
|
|
17.5
|
-1.18
|
0.14
|
16.35
|
17.44
|
18.74
|
20.44
|
22.53
|
24.85
|
27.72
|
-0.66
|
0.15
|
16.69
|
18.04
|
19.59
|
21.60
|
23.97
|
26.50
|
29.46
|
|
18.0
|
-1.18
|
0.13
|
16.54
|
17.64
|
18.94
|
20.65
|
22.73
|
25.04
|
27.90
|
-0.64
|
0.15
|
16.90
|
18.27
|
19.85
|
21.88
|
24.29
|
26.84
|
29.82
|
Source: Own elaboration.
Discussion
In this article, reference growth curves were constructed for weight-for-age, height-for-age and BMI-for-age for children and adolescents (2-18 years) from the department of Huila, Colombia (data from the 37 municipalities).
The present study found that in males and according to the 50th percentile: (i) weight gain is >2kg between 12 and 15.5 years of age (with the greatest increase at 13.5 years: 2.56kg); (ii) height increase is >3cm between 12 and 14 years of age (with the greatest increase at 13 years: 3.58cm) and <1cm from age 16.5 years, and (iii) the increase in BMI begins at age 6, being >0.30kg/m2 between 12.5 and 14.5 years of age. Finally, the weight, height and BMI of males at 18 years in the 50th percentile were 61.10kg, 168.58cm and 20.65kg/m², respectively.
Compared with data from Colombian populations, some of them thoroughly reported in the systematic review by López-Laiseca and Massuça,14 in the present study and according to the 50th percentile, in 16- and 17-year-old males: (i) weight (55.28kg and 58.41kg, respectively) is below that reported for this population in Bogotá (16 years: 57.3kg; 17 years: 60.7kg),20 and Medellín (median weight of 59.9kg at age 16),21 but above the median weight reported for males aged 17 years from Argelia, Cauca (57.6kg);22 (ii) height (167.14cm and 168.42cm) was higher than that reported for Bogotá (16 years: 166cm; 17 years: 168cm)20 and Argelia, Cauca (17 years: 167cm),22 although it was lower than that described in Medellín for age 16 (170.1cm)21; and (iii) BMI (19.76kg/m2 and 20.23kg/m2) was lower than that reported in this population in Bogotá (16 years: 20.8kg/m2; 17 years: 21.6kg/m2).20
On the other hand, compared to the international population data described by López-Laiseca and Massuça,14 in the present study, according to the 50th percentile, in males aged 17 and 18:
a. Weight (58.41kg and 61.10kg, respectively) is higher than that reported in Peruvian male adolescents (median weight at 17 years: 57.4kg),23 similar to the median weight for both ages in this population in Saudi Arabia (58.5kg and 61.2kg, respectively),24 and below the median weight reported for this population in Argentina (17 years: 63.3kg),23 Brazil (17 years: 66.1kg),25 USA (71kg and 78.3kg),26 Spain (68.9kg and 71.2kg),27 Portugal (17 years: 66.23kg),28 Italy (67.3kg and 68.7kg),29 Greece (73.2kg and 77kg),30 Germany (69.44kg and 70.77kg),31 Poland (67.2kg and 70kg),32 Bahrain (63.2kg y 64.9kg),33 Hong Kong (61.5kg and 62.3kg)34 and South Korea (65.9kg and 65.2kg).35
b. Height (168.42cm and 168.58cm, respectively) is higher than that reported in male adolescents in Peru (median height at 17 years: 163.2cm),23 similar to the median height for both ages in this population in Saudi Arabia (167.4cm and 168.8cm, respectively),24 and below the median height reported for this population in Argentina (17 years: 171.7cm),23 Brazil (174.2cm),25 USA (176.1cm and 176.8cm),26 Spain (175.5cm and 177.6cm),27 Portugal (17 years: 172cm),28 Italy (175.3cm and 176cm),29 Greece (178.3cm and 180.2cm),30 Germany (174.28cm and 175.14cm),31 Poland (178.1cm and 178.5cm),32 Bahrain (171cm and 171cm),33 Hong Kong (171.9cm and 171.7cm)34 and South Korea (173.8cm and 173.2cm).35
c. BMI (20.23kg/m2 and 20.65kg/m2, respectively) is lower than the median BMI reported for male adolescents of this age in Brazil (17 years: 21.7kg/m2),25 USA (23.3kg/m2 and 25.1kg/m2),26 Spain (22.3kg/m2 and 22.6kg/m2),27 Portugal (17 years: 22.75kg/m2),28 Italy (21.9kg/m2 and 22.0kg/m2),29
Greece (23.02kg/m2 and 23.59kg/m2),30 Germany (22.86kg/m2 and 23.07kg/m2),31 Poland (21.1kg/m2 and 21.7kg/m2),32 Bahrain (21.6kg/m2 and 21.8kg/m2),33 Saudi Arabia (20.9kg/m2 and 21.4kg/m2),24 Hong Kong (20.8kg/m2 and 21.1kg/m2)34 and South Korea (21.7kg/m2 and 21.8kg/m2).35
Moreover, the present study found the following regarding the reference value (50th percentile) for weight, height, and BMI in males:
a. Weight: (i) at 5 years of age (18.15kg), it was lower than the international reference values established by the Centers for Disease Control and Prevention (CDC, -0.33kg)36,37 and the World Health Organization (WHO, -0.15kg),38 and the value reported for this age in a Colombian population by Durán et al.39 in a study of 27 209 Colombian children and adolescents (0-20 years) (-0.75kg); (ii) at 7 years of age (22.17kg), it was lower than the values reported by the CDC (-0.99kg)36,37 and the WHO (-0.73kg);40 (iii) at 12 years of age (36.79kg), it was lower than the values reported for Colombia (-5.31kg)39 and by the CDC (-3.88kg),36,37 and (iv) at 18 years of age (61.10kg), it was lower than values reported in the Colombian population (-2.90kg)39 and by the CDC (-6.18kg).36,37
b. Height: (i) at 5 years of age (108.12cm), it was lower than the international reference values reported by the CDC (-1.05cm),36,37 the WHO (-1.88cm),38 and the reference values for the Colombian population (-0.98cm);39 (ii) at 7 years of age (119.14cm), it was lower than the values described in the Colombian pediatric population (-2.76cm)39 and the international reference values reported by the CDC (-2.89cm)36,37 and the WHO (-2.56cm);40 (iii) at 12 years of age (145.38cm), it was also lower than the values reported by Duran et al.39 in the Colombian population (-3.62cm), the CDC (-3.92cm)36,37 and the WHO (-3.72cm),40 and these differences were persistent until age 17; finally, (iv) at age 18 (168.58cm), it was lower than the values reported by the CDC (-7.6cm)36,37 and the WHO (-7.52cm).40
c. BMI: (i) at 5 years of age (15.19kg/m²), it was similar to the international reference values (WHO: 0.01kg/m²; CDC: -0.22kg/m²);36-38 (ii) at age 7 years (15.32kg/m²), it was lower than the value reported in the Colombian population (-1.38kg/m²),39 but similar to the international reference values reported by the CDC (-0.12kg/m²)36,37 and the WHO (-0.11kg/m²);40 (iii) at age 12 years (17.31kg/m²), it was lower than the value reported in the Colombian population (-1.49kg/m²)39 and similar to those reported by the WHO (-0.19kg/m²)40 and the CDC (-0.5kg/m²);36,37 and (iv) at 18 years of age (20.65kg/m²), it was lower than the values reported by the WHO (-1.05kg/m²)40 and the CDC (-1.24kg/m²).36,37
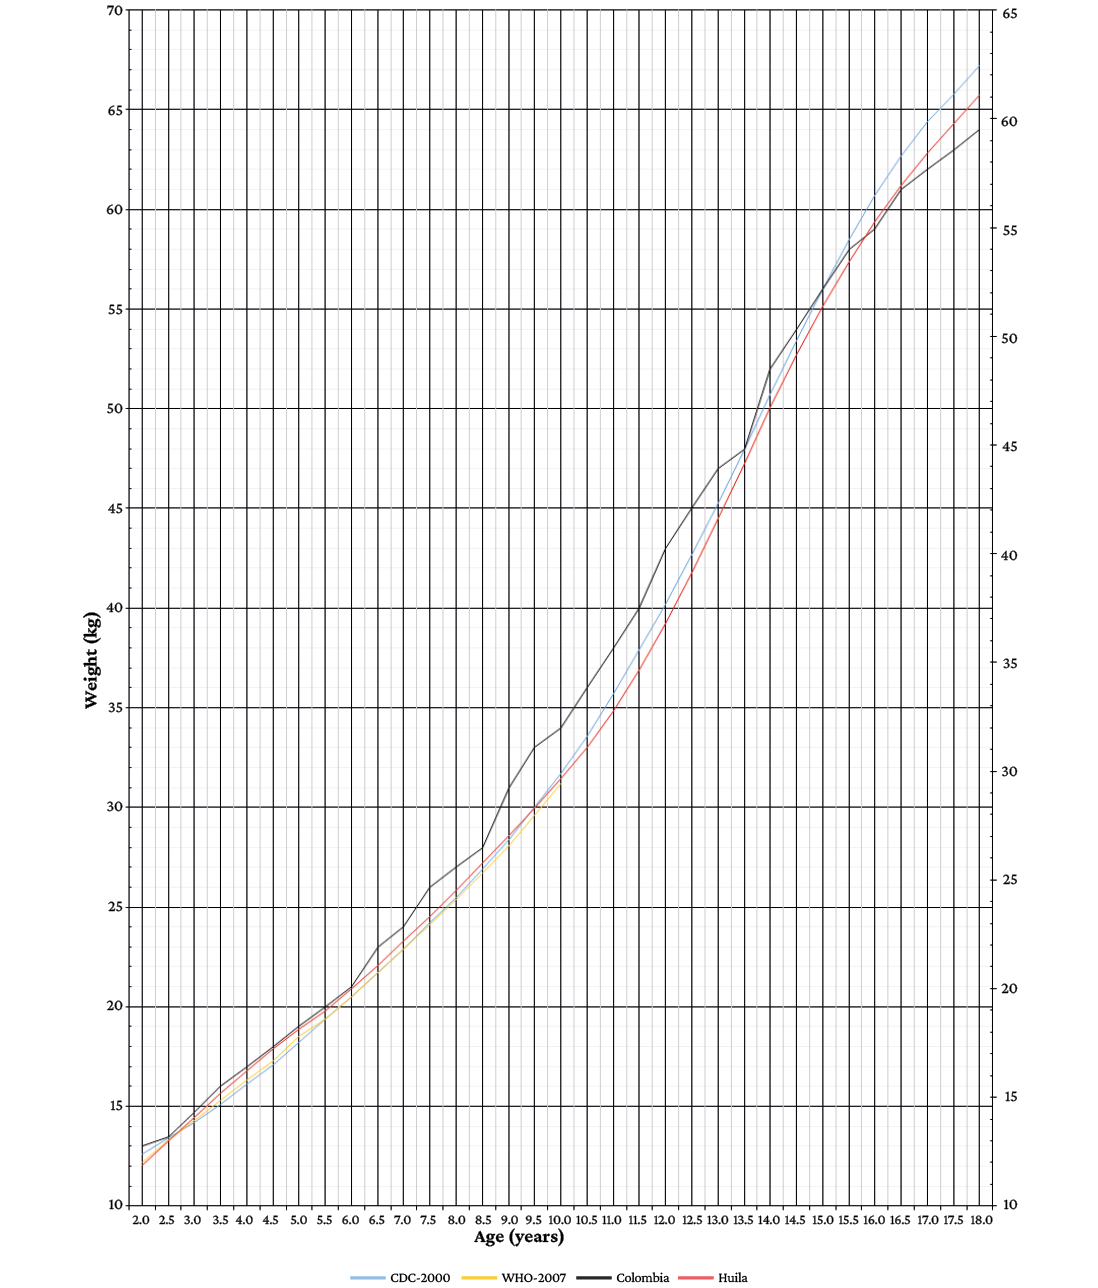
The percentile curves (50th percentile) of the reference values for weight, height and BMI in male children and adolescents reported by the CDC,36,37 the WHO (weight values up to 10 years),38,40 Duran et al. (Colombian population),39 and the present study (Huila, Colombia) are presented in Figures 4a, 4b and 4c, respectively.
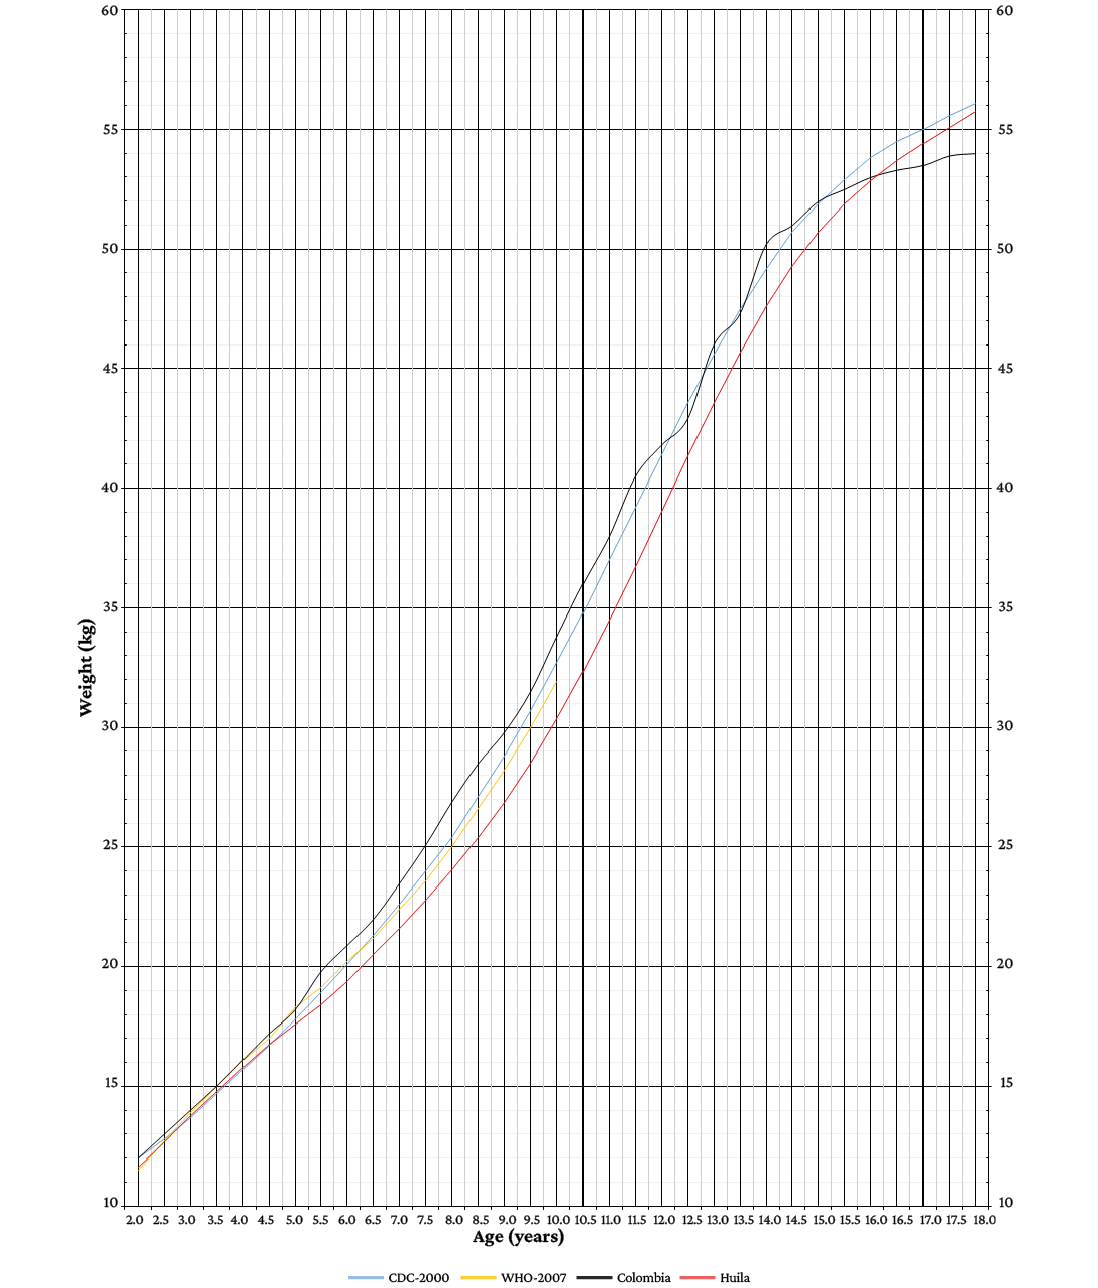
Figure 4a. Weight-for-age (kg) percentile curves (50th percentile) in male children and adolescents according to the international reference values of the Centers for Disease Control and Prevention36,37 and the World Health Organization,38,40 the values described for this population in Colombia,39 and those reported in the present study (children and adolescents from Huila, Colombia).
Source: Own elaboration.
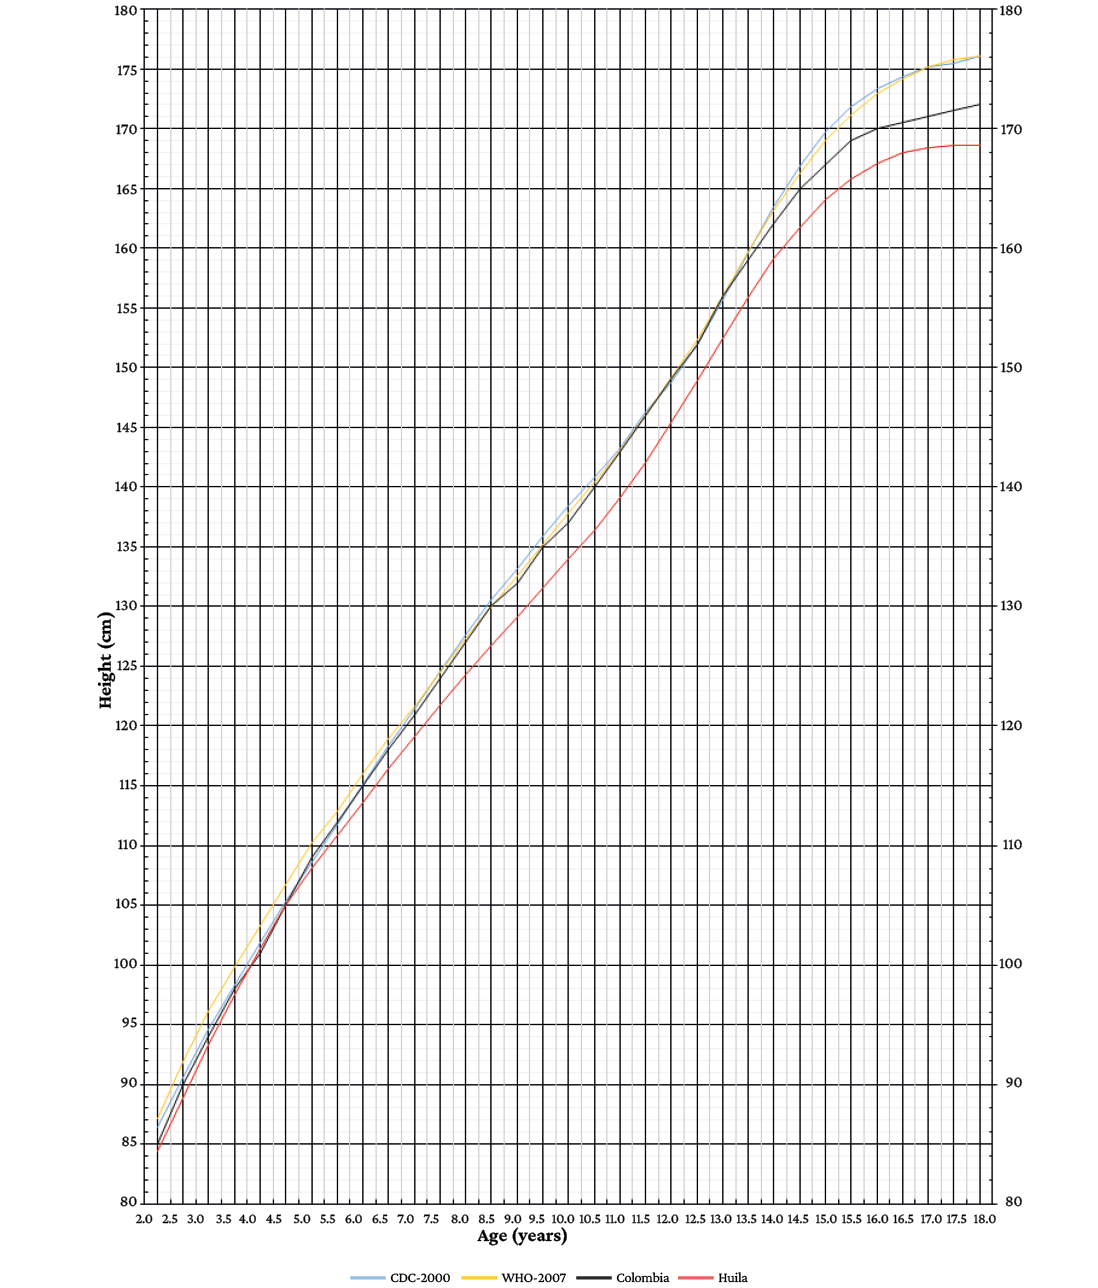
Figure 4b. Height-for-age (kg) percentile curves (50th percentile) in male children and adolescents according to the international reference values of the Centers for Disease Control and Prevention36,37 and the World Health Organization,38,40 the values described for this population in Colombia,39 and those reported in the present study (children and adolescents from Huila, Colombia).
Source: Own elaboration.
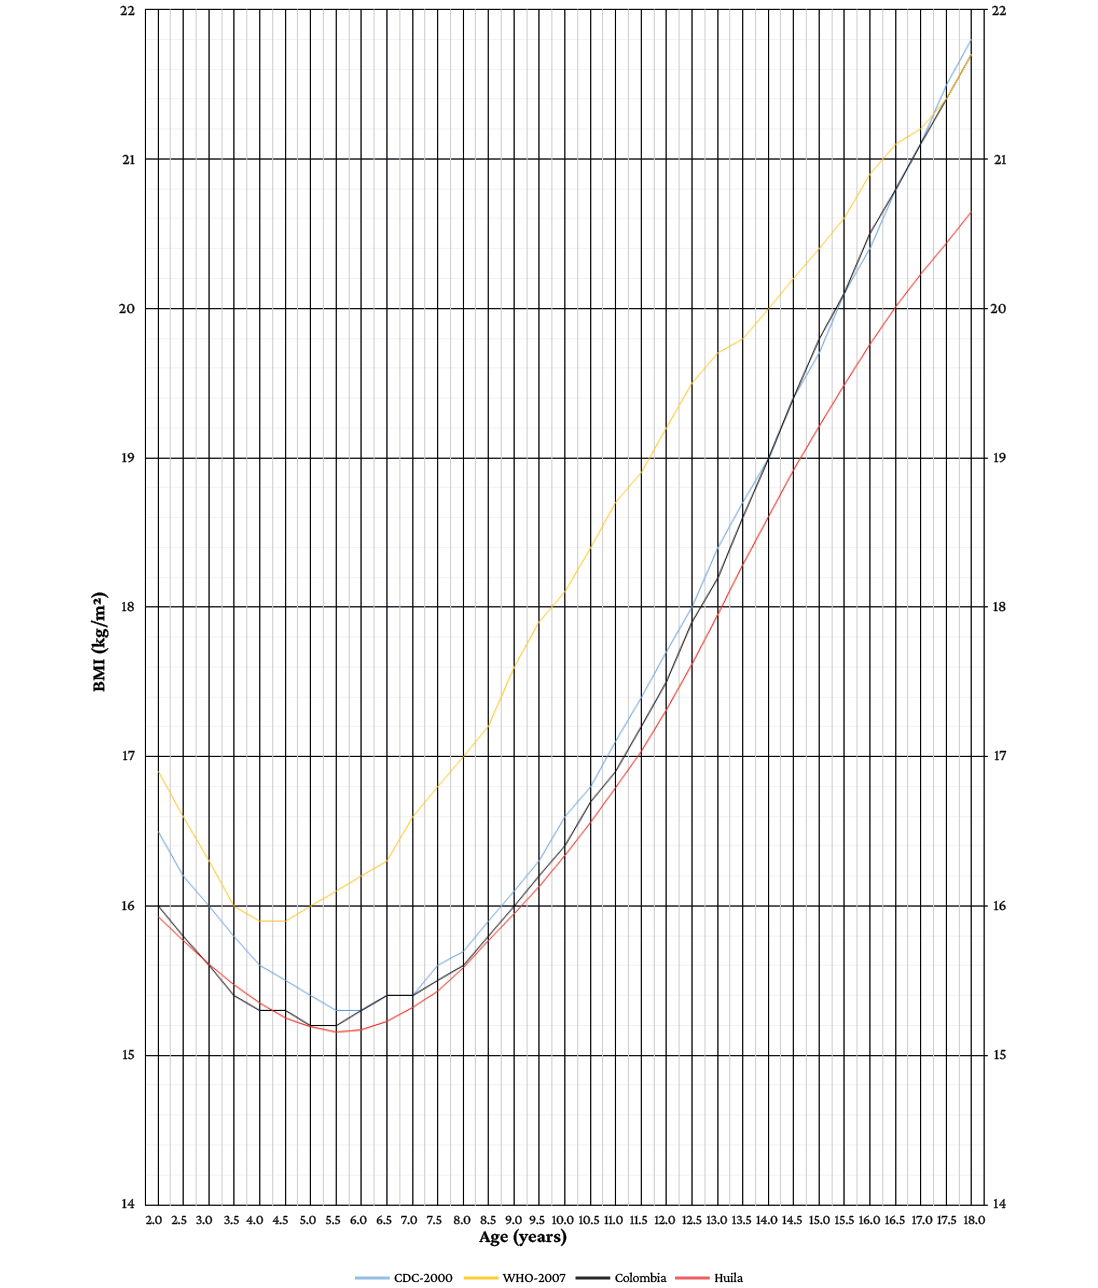
Figure 4c. Body mass index-for-age (kg/m2) percentile curves (50th percentile) in male children and adolescents according to the international reference values of the Centers for Disease Control and Prevention36,37 and the World Health Organization,38,40 the values described for this population in Colombia,39 and those reported in the present study (children and adolescents from Huila, Colombia).
Source: Own elaboration.
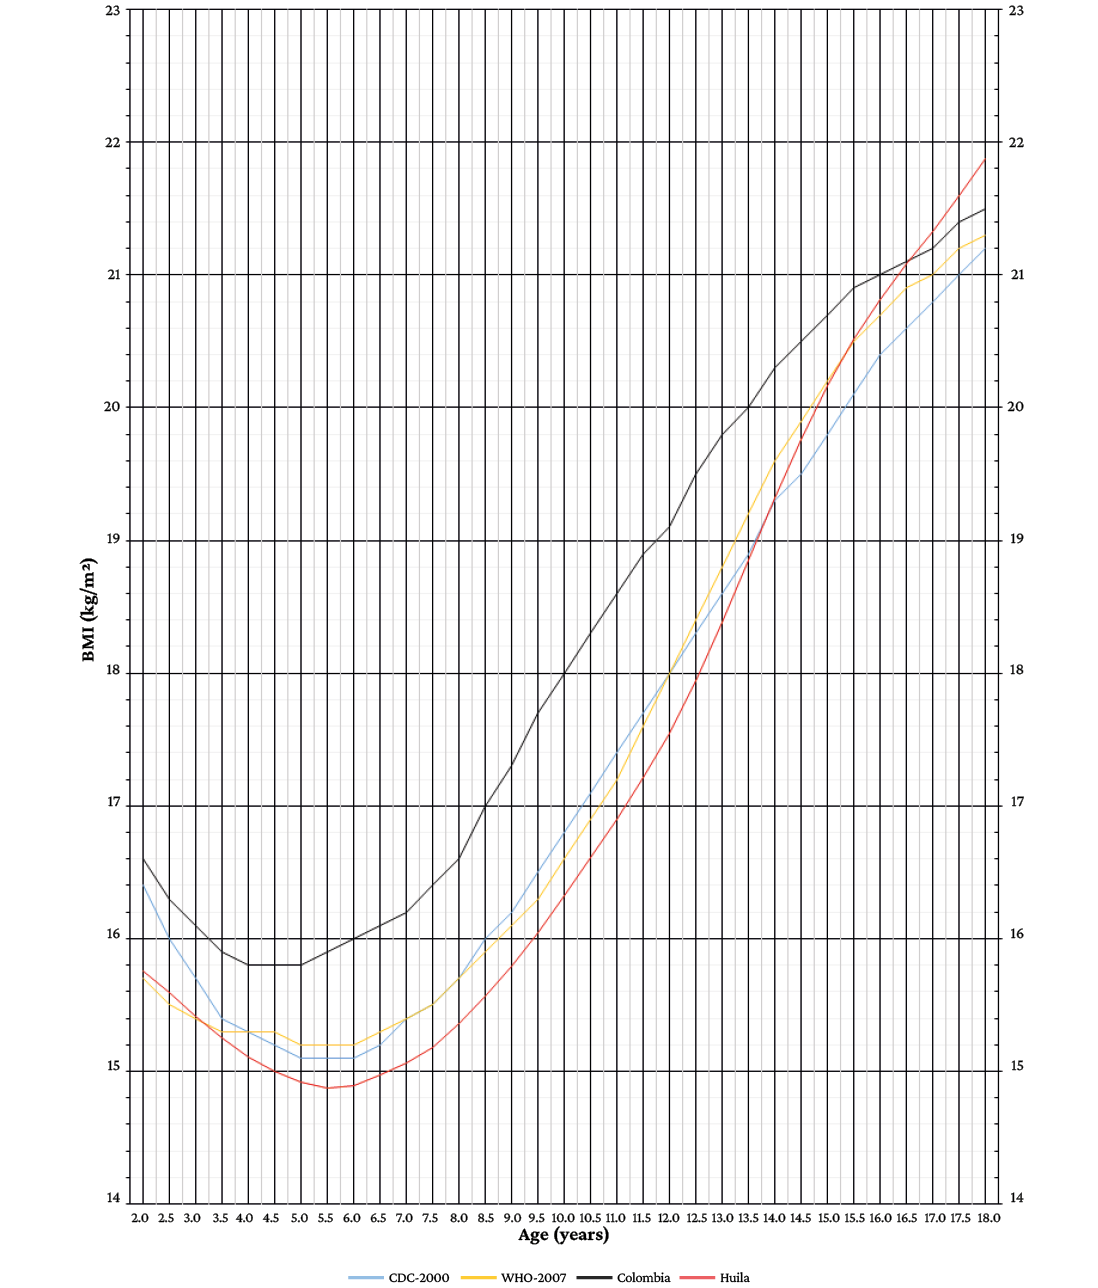
In the case of females, according to the 50th percentile, it was observed that: (i) weight gain is >2kg between 10.5 and 13.5 years of age (with the greatest increase at 12 years: 2.3kg); (ii) height increase is >3cm between 9.5 and 11.5 years of age (with the greatest increase at 11 years: 3.39cm) and <1cm from the age of 14 years; and (iii) the increase in BMI is >0.40kg/m2 from 13 to 15 years of age. Finally, in the 50th percentile, the weight, height and BMI of females at 18 years were 55.76kg, 157.64cm and 21.88kg/m²,
respectively.
Compared to data from Colombian populations, in the present study, according to the 50th percentile, in women aged 17 years: (i) weight (54.40kg) is below the value at reported for this population in Bogotá (55.8kg), 20 but similar to that reported in Argelia, Cauca (54.6kg);22 (ii) height (157.79cm) is similar to the value described for this population in Bogotá (157cm),20 but higher than that reported in Argelia, Cauca (156cm),22 and (iii) BMI (21.33kg/m2) is lower than that reported for women of this age in Bogotá (22.6kg/m2).20
In addition, after comparing the 50th percentile values of females aged 16, 17 and 18 years obtained in the present study with international population data, it was observed that:
a. Weight (52.86kg, 54.40kg and 55.76kg, respectively) is above the median weight reported for this population in Argentina (16 years: 52.5kg; 17 years: 53.1kg),22 Peru (16 years: 51.6kg; 17 years: 52.5kg),23 Saudi Arabia (16 years: 52kg; 17 years: 53.2kg; 18 years: 53.6kg),24 and Hong Kong (16 years: 50.7kg; 17 years: 51.4kg; 18 years: 51.3Kg).34 In contrast, weight is below the value reported in Brazil (16 years: 57.7kg; 17 years: 57.1kg),25 USA (16 years: 58.7kg; 17 years: 60.8kg; 18 years: 58.6kg),26 Spain (16 years: 55.8kg; 17 years: 56.1kg; 18 years: 56.6kg),27 Portugal (16 years: 59.28kg; 17 years: 61.46kg),28 Italy (16 years: 55.6kg; 17 years: 55.8kg; 18 years: 55.9kg),29 Greece (16 years: 58.6kg; 17 years: 59.7kg),30 Germany (16 years: 57.17kg; 17 years: 57.15kg; 18 years: 56.62kg),31 Poland (16 years: 54.7kg; 17 years: 55.8kg; 18 years: 56.1kg)32 and Bahrain (16 years: 56.7kg; 17 years: 57.6kg; 18 years: 57.2kg).33 In the case of South Korea, it is lower at the ages of 16 and 17 (54.7kg and 56.7kg), although it is higher at age 18 (53.9kg).35
b. Height (157.66cm, 157.79cm and 157.54cm, respectively) is higher than the values reported for this population in Peru (16 years: 153cm; 17 years: 152.9cm),23 Bahrain (16 years: 156.6cm; 17 years: 156.3cm; 18 years: 156.6cm),33 and Saudi Arabia (16 years: 155.1cm; 17 years: 155.5cm; 18 years: 155.8cm),24 but lower than the median height described for this population in Argentina (16 years: 160.5cm; 17 years: 160.7cm),23 Brazil (16 years: 163.6cm; 17 years: 162.5cm),25 USA (16 years: 161.4cm; 17 years: 164.0cm; 18 years: 163cm),26 Spain (16 years: 163.8cm; 17 years: 162.6cm; 18 years: 164.2cm),27 Portugal (16 years: 164cm; 17 years: 166cm),28 Italy (16 years: 162cm; 17 years: 162.3cm; 18 years: 162.5cm),29 Greece (16 years: 164.4cm; 17 years: 164.9cm; 18 years: 165.3cm),30 Germany (16 years: 159.9cm; 17 years: 160.04cm; 18 years: 160.1cm),31 Poland (16 years: 164.5cm; 17 years: 164.7cm; 18 years: 165.1cm),32 Hong Kong (16 years: 158.3cm; 17 years: 158.9cm; 18 years: 158.6cm)34 and South Korea (16 years: 159.8cm; 17 years: 161.6cm; 18 years: 161.1cm).
c. BMI (20.81kg/m2, 21.33kg/m2 and 21.88kg/m2, respectively) is lower than the median BMI reported for this population in Argentina (16 years: 21.6kg/m2),23 Peru (16 years: 22kg/m2),23 Portugal (16 years: 22.07kg/m2; 17 years: 22.47kg/m2),28 Greece (16 years: 21.83kg/m2; 17 years: 22.14kg/m2; 18 years: 22.42kg/m2),30 Germany (16 years: 22.37kg/m2; 17 years: 22.28kg/m2; 18 years: 22.09kg/m2),31 Bahrain (16 years: 23.1kg/m2; 17 years: 23.3kg/m2; 18 years: 23.3kg/m2),33 Saudi Arabia (16 years: 21.5kg/m2; 17 years: 21.9kg/m2; 18 years: 22kg/m2),24 Brazil (16 years: 21.4kg/m2; 17 years: 21.6kg/m2),25 USA (16 years: 22.1kg/m2; 17 years: 22.5kg/m2),26 Italy (16 years: 21kg/m2),29 and South Korea (16 years: 21.4kg/m2; 17 years: 21.7kg/m2).35 On the contrary, it is higher than the values reported in Spain (17 years: 21.2kg/m2; 18 years: 21kg/m2),27 South Korea (18 years: 20.7kg/m2),35 Italy (17 years: 21.1kg/m2; 18 years: 21.1kg/m2),29 Poland (16 years: 20.2kg/m2; 17 years: 20.5kg/m2; 18 years: 20.6kg/m2)32 and Hong Kong (16 years: 20.2kg/m2; 17 years: 20.3kg/m2; 18 years: 20.4kg/m2).34 In addition, it is exactly the same than the values reported for adolescents at 16 years of age in Spain (20.8kg/m2)27 and 18 years of age in the USA (21.8kg/m2).26
Furthermore, the present study found the following regarding the reference values (50th percentile) for weight, height and BMI in female children and adolescents:
a. Weight: (i) at 5 years of age (17.60kg), it was lower than the international reference values established by the CDC (-0.42kg)36,37 and the WHO (-0.61kg),38 as well as the value reported for this population in Colombia (-0.9kg);39 (ii) at 7 years of age (21.62kg), it was lower than the values reported by the CDC (-1.24kg)36,37 and the WHO (-0.78kg);40 (iii) at age 10 years (30.35kg), it was lower than the values reported for Colombia (-3.05kg)40 and by the CDC (-2.71kg)36,37 and the WHO (-1.55kg);40 finally, (iv) at age 18 years (55.76kg) it was lower than the value reported by the CDC (-0.46kg),36,37 but higher than that reported in the Colombian population (+1.76kg).39
b. Height: (i) at 5 years of age (109.13cm) it was similar to the values reported by Durán et al.39 in the Colombian population (+0.63cm) and the international reference values described by the CDC (-0.04cm)36,37 and the WHO (-0.27cm);38 (ii) at 7 years of age (119.56cm) it was lower than that reported in Colombia (-0.74cm)39 and the international reference values reported by the CDC (-2.2cm)36,37 and the WHO (-1.24cm);40 (iii) at 10 years of age (136.67cm) it was also lower than the values reported in the Colombian population (-1.36cm)39 and by the CDC (-1.54cm)36,37 and the WHO (-1.93cm);40 finally, (iv) at 18 years of age (157.64cm) it was lower than the values reported by the CDC (-5.49cm)36,37 and the WHO (-5.46cm).40
c. BMI: (i) at 5 years (14.92kg/m²), it was similar to the international reference values reported by the CDC (-0.23kg/m²)36,37 and the WHO (-0.38kg/m²);38 (ii) at 7 years of age (15.06kg/m²),
it was similar to the BMI reported in the Colombian population (-0.84kg/m²) and by the CDC (-0.39kg/m²)36,37 and the WHO (-0.34kg/m²);40 (iii) at 10 years of age (16.32kg/m²), it was similar to the values reported by the CDC (-0.48kg/m2)36,37 and the WHO (-0.28kg/m²),40 although lower than the BMI reported in the Colombian population (-1.08kg/m²);39 and (iv) at 18 years of age (21.88kg/m²), it was similar to the values reported by the CDC (+0.61kg/m²)36,37 and the WHO (+0.58kg/m²).40
The percentile curves (50th percentile) of the reference values for weight, height and BMI in female children and adolescents reported by the CDC,36,37 the WHO (weight values up to 10 years),38,40 Duran et al. (Colombian population),39 and the present study (Huila, Colombia) are presented in Figures 5a, 5b and 5c, respectively.
Figure 5a. Weight-for-age (kg) percentile curves (50th percentile) in female children and adolescents according to the international reference values of the Centers for Disease Control and Prevention36,37 and the World Health Organization,38,40 the values described for this population in Colombia,39 and those reported in the present study (children and adolescents from Huila, Colombia).
Source: Own elaboration.
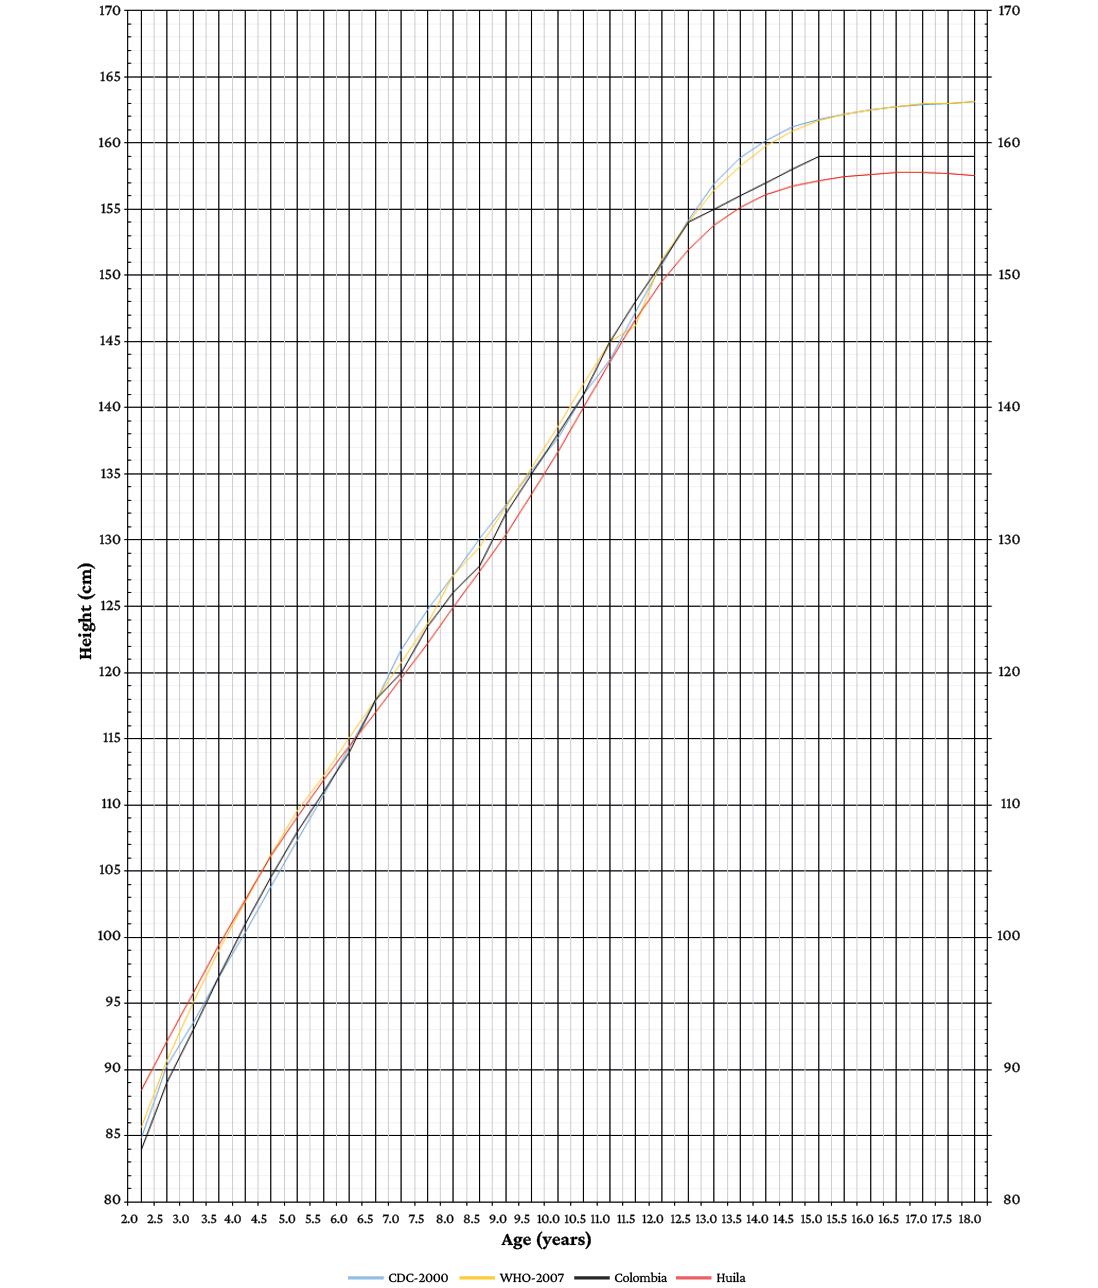
Figure 5b. Height-for-age (kg) percentile curves (50th percentile) in female children and adolescents according to the international reference values of the Centers for Disease Control and Prevention36,37 and the World Health Organization,38,40 the values described for this population in Colombia,39 and those reported in the present study (children and adolescents from Huila, Colombia).
Source: Own elaboration.
Figure 5c. Body mass index-for-age (kg/m2) percentile curves (50th percentile) in female children and adolescents according to the international reference values of the Centers for Disease Control and Prevention36,37 and the World Health Organization,38,40 the values described for this population in Colombia,39 and those reported in the present study (children and adolescents from Huila, Colombia).
Source: Own elaboration.
The growth standard published by the WHO,40 which includes international reference values for BMI-for-age, height-for-age and weight-for-age for the population between 5 and 19 years of age, was officially adopted in Colombia by means of Resolution 2121 of 2010. 41 Consequently, the values established in this study for children and adolescents in Huila, Colombia are compared with the values reported internationally.
With regard to height-for-age, the reference values in the present study for both sexes were lower than those reported in the Colombian population39 and by the CDC36,37 and the WHO38,40 for all ages, except for girls at 5 years.
Longitudinal measurements of a child’s growth (weight and height) are a dynamic indicator of their overall health.42 In general, the present study found that the weight and height of children and adolescents in Huila increases with age (except for height at 17.5 and age 18 years in females, where a small decrease was observed), a constant growth pattern that can be a reflection of proper nutrition.4,43
Finally, it is important to point out two limitations of the present study that generate a bias that, to some extent, restricts the extrapolation of the results to the general population of the country, namely: (i) the research was carried out with a sample of children and adolescents of medium and low socioeconomic levels including (as reported in the methodology) a certain percentage of indigenous individuals (although the percentage is not so high), and (ii) the sample was not homogeneously distributed for each of the age groups (mainly those between 2-5 years and 11-18 years).
Furthermore, although this is the first study on anatomical growth (basic morphology) in the department of Huila, Colombia, presenting a detailed description of weight, height and BMI with current and representative data for this population (2-18 years), further studies will allow validating or improving the results reported here.
Conclusions
This study characterized the morphological profile of children and adolescents in Huila, Colombia, establishing reference values for weight, height and BMI. Based on these data, reference weight-for-age, height-for-age and BMI-for age percentile curves are proposed, highlighting the variability of the basic morphological profile between boys and girls.
Thus, in the 50th percentile, it was observed that: (i) in males, weight, height and BMI increased the most between the ages of 13 and 14, 2 and 3, and 13 and 14, respectively, and (ii) in females, weight, height and BMI increased the most between 12 and 13 years, 2 and 3 years, and 13 and 14 years, respectively.
Finally, weight-for-age and height-for-age reference values of children and adolescents in Huila (Colombia) are below the international reference values established by the CDC and the WHO, as well as the reference values described by growth studies developed in European countries and in Colombia (except for height at 5 years and weight at 18 years in females, where values were similar and higher, respectively).
Conflicts of interest
None stated by the authors.
Funding
Fellow of the Red Euroamericana de Actividad Física, Educación y Salud (REAFES) and the Faculty of Physical Education and Sports, Lusophone University of Humanities and Technologies, Lisbon, Portugal.
Acknowledgments
To the Ministries of Health of the municipality of Neiva and the department of Huila, Colombia, for providing the data used in this study.
References
1.Díaz-Bonilla E, Torres-Galvis CL, Gómez-Campos R, de Arruda M, Pacheco-Carrillo J, Cossio-Bolaños M. Weight, height and body mass index of children and adolescents living at moderate altitude in Colombia. Arch Argent Pediatr. 2018;116(2):e241-50. https://doi.org/fq5g.
2.Heo J, Krishna A, Perkins JM, Lee HY, Lee JK, Subramanian SV, et al. Community Determinants of Physical Growth and Cognitive Development among Indian Children in Early Childhood: A Multivariate Multilevel Analysis. Int J Environ Res Public Health. 2019;17(1):182. https://doi.org/k53c.
3.Dong Y, Jan C, Ma Y, Dong B, Zou Z, Yang Y, et al. Economic development and the nutritional status of Chinese school-aged children and adolescents from 1995 to 2014: an analysis of five successive national surveys. Lancet Diabetes Endocrinol. 2019;7(4):288-99. https://doi.org/gq8fq6. Erratum in: Lancet Diabetes Endocrinol. 2019;7(5):e5.
4.Grummer-Strawn LM, Garza C, Johnson CL. Childhood growth charts. Pediatrics. 2002;109(1):141-2. https://doi.org/b3hpcr.
5.Huiracocha-Tutiven L, Orellana-Paucar A, Abril-Ulloa V, Huiracocha-Tutiven M, Palacios-Santana G, Blume S. Child Development and Nutritional Status in Ecuador. Glob Pediatr Health. 2019;6:2333794X18821946. https://doi.org/k53d.
6.de Onis M. Growth curves for school age children and adolescents. Indian Pediatr. 2009;46(6):463-5.
7.Aminorroaya A, Amini M, Naghdi H, Zadeh AH. Growth charts of heights and weights of male children and adolescents of Isfahan, Iran. J Health, Popul Nutr. 2003;21(4):341-6.
8.Heude B, Scherdel P, Werner A, Le Guern M, Gelbert N, Walther D, et al. A big-data approach to producing descriptive anthropometric references: a feasibility and validation study of paediatric growth charts. Lancet Digit Health. 2019;1(8):e413-23. https://doi.org/k53f.
9.Cameron N, Schell L, editors. Human growth and development. 3rd ed. Academic Press; 2021.
10.Stanforth PR, Crim BN, Stanforth D, Stults-Kolehmainen MA. Body composition changes among female NCAA division 1 athletes across the competitive season and over a multiyear time frame. J Strength Cond Res. 2014;28(2):300-7. https://doi.org/k53g.
11.Hruschka DJ. One size does not fit all. How universal standards for normal height can hide deprivation and create false paradoxes. Am J Hum Biol. 2021;33(5):e23552. https://doi.org/k53j.
12.Thompson AL. What is normal, healthy growth? Global health, human biology, and parental perspectives. Am J Hum Biol. 2021;33(5):e23597. https://doi.org/k53k.
13.World Health Organization (WHO). Physical Status: the Use and Interpretation of Anthropometry: Report of a WHO expert Committee. Geneva: Who Technical Report Series 854; 1995 [cited 2023 Nov 15]. Available from: https://bit.ly/3FYGkan.
14.López-Laiseca JD, Massuça LM. Reference values for height, weight, and body mass index of children and adolescents aged 2 to 18. A systematic review with an emphasis on the Colombian population. Rev Fac Med. 2021;69(1):e300. https://doi.org/k53m.
15.Colombia. Departamento Administrativo Nacional de Estadística (DANE). Censo general 2005. República de Colombia. Huila. Bogotá D.C.: DANE; [cited 2022 Jul 12]. Available from: https://bit.ly/3T0bJ3Z.
16.Cole TJ, Green PJ. Smoothing reference centile curves: the LMS method and penalized likelihood. Stat Med. 1992;11(10):1305-19. https://doi.org/fcppg8.
17.lmsChartMaker Pro 2.3. Cambridge, UK: Medical Research Council; 2006.
18.World Medical Association (WMA). WMA Declaration of Helsinki - Ethical principles for medical research involving human subjects. Fortaleza: 64th WMA General Assembly; 2013 [cited 2022 Mar 21]. Available from: https://bit.ly/3sCX2Ji.
19.Colombia. Ministerio de Salud. Resolución 8430 de 1993 (octubre 4): Por la cual se establecen las normas científicas, técnicas y administrativas para la investigación en salud. Bogotá D.C.; october 4 1993 [cited 2022 Jul 12]. Available from: https://bit.ly/3G1JvOr.
20.Escobar-Cardozo GD, Correa-Bautista JE, González-Jiménez E, Schmidt-RioValle J, Ramírez-Vélez R. Percentiles de grasa corporal por bioimpedancia eléctrica en niños y adolescentes de Bogotá, Colombia: estudio FUPRECOL. Arch Argent Pediatr. 2016;114(2):2-3. https://doi.org/k53n.
21.Uscátegui-Peñuela RM, Pérez-Giraldo JA, Aristizábal-Rivera JC, Camacho-Pérez JA. Exceso de peso y su relación con presión arterial alta en escolares y adolescentes de Medellín, Colombia. ALAN. 2003;53(4):376-82.
22.Ortega-Bonilla RA, Chito-Trujillo DM. Valoración del estado nutricional de la población escolar del municipio de Argelia, Colombia. Rev. Salud Pública. 2014;16(4):547-59. https://doi.org/frk2.
23.Bustamante A, Freitas D, Pan H, Katzmarzyk PT, Maia J. Centile curves and reference values for height, body mass, body mass index and waist circumference of Peruvian children and adolescents. Int J Environ Res Public Health. 2015;12(3):2905-22. https://doi.org/f68dnh.
24.El Mouzan M, Salloum AA, Omer AA, Alqurashi M, Herbish AA. Growth reference for Saudi school-age children and adolescents: LMS parameters and percentiles. Ann Saudi Med. 2016;36(4):265-8. https://doi.org/frk5.
25.Silva DA, Pelegrini A, Petroski EL, Gaya AC. Comparison between the growth of Brazilian children and adolescents and the reference growth charts: data from a Brazilian project. J Pediatr. 2010;86(2):115-20. https://doi.org/b97x95.
26.Fryar CD, Gu Q, Ogden CL. Anthropometric reference data for children and adults: United States, 2007-2010. Vital Health Stat 11. 2012;(252):1-48.
27.López-de Lara D, Santiago-Paniagua P, Tapia-Ruiz M, Rodríguez-Mesa MD, Gracia-Bouthelier R, Carrascosa-Lezcano A. Valoración del peso, talla e IMC en niños, adolescentes y adultos jóvenes de la Comunidad Autónoma de Madrid. Anales de Pediatría. 2010;73(6):305-19. https://doi.org/bsb3kh.
28.Chaves R, Baxter-Jones A, Souza M, Santos D, Maia J. Height, weight, body composition, and waist circumference references for 7- to 17-year-old children from rural Portugal. Homo. 2015;66(3):264-77. https://doi.org/frk4.
29.Cacciari E, Milani S, Balsamo A, Spada E, Bona G, Cavallo L, et al. Italian cross-sectional growth charts for height, weight and BMI (2 to 20 yr). J Endocrinol Invest. 2006;29(7):581-93. https://doi.org/gfgmgn.
30.Tambalis KD, Panagiotakos DB, Psarra G, Daskalakis S, Kavouras SA, Geladas N, et al. Physical fitness normative values for 6-18-year-old Greek boys and girls, using the empirical distribution and the lambda, mu, and sigma statistical method. Eur J Sport Sci. 2016;16(6):736-46. https://doi.org/k55q.
31.Redlefsen T, Commentz J, Meigen C, Hermanussen M. Reference values for height, weight and body mass index of German born Turkish children. Anthropol Anz. 2007;65(3):236-74.
32.Kulaga Z, Litwin M, Tkaczyk M, Różdżyńska A, Barwicka K, Grajda A, et al. The height-, weight-, and BMI-for-age of Polish school-aged children and adolescents relative to international and local growth references. BMC Public Health. 2010;4:10:109. https://doi.org/cnrb4f.
33.Gharib NM, Shah P. Anthropometry and body composition of school children in Bahrain. Ann Saudi Med. 2009;29(4):258-69. https://doi.org/fss26x.
34.Sung RY, So HK, Choi KC, Nelson EA, Li AM, Yin JA, et al. Waist circumference and waist-to-height ratio of Hong Kong Chinese children. BMC Public Health. 2008;8:324. https://doi.org/dznfm3.
35.Kim K, Hong S, Kim EY. Reference Values of Skeletal Muscle Mass for Korean Children and Adolescents Using Data from the Korean National Health and Nutrition Examination Survey 2009-2011. PLoS One. 2016;11(4):e0153383. https://doi.org/f8z2fd.
36.Kuczmarski RJ, Ogden CL, Grummer-Strawn LM, Flegal KM, Guo SS, Wei R, et al. CDC growth charts: United States. Adv Data. 2000;(314):1-27.
37.Center for Disease Control and Prevention (CDC). Growth Charts – Data Tables. Atlanta: CDC; 2009 [cited 2022 Apr 14]. Available from: https://bit.ly/47fHR7V.
38.World Health Organization (WHO). Child growth standards. Geneve: WHO; [cited 2022 Jun 15]. Available from: https://bit.ly/49AtYmh.
39.Durán P, Merker A, Briceño G, Colón E, Line D, Abad V, et al. Colombian reference growth curves for height, weight, body mass index and head circumference. Acta Paediatr. 2016;105(3):e116-25. https://doi.org/f3vc7j.
40.World Health Organization (WHO). Growth reference data for 5-19 years. Geneve: WHO; [cited 2022 Apr 14]. Available from: https://bit.ly/46iY3Um.
41.Colombia. Ministerio de la Protección Social. Resolución 2121 de 2010 (junio 9): Por la cual se adoptan los Patrones de Crecimiento publicados por la Organización Mundial de la Salud, OMS, en el 2006 y 2007 para los niños, niñas y adolescentes de 0 a 18 años de edad y se dictan otras disposiciones. Bogotá D.C.: Diario Oficial 47744; June 18 2010.
42.Bogin B. Patterns of human growth. Cambridge: Cambridge University Press; 2020.
43.Jacobs M. Adolescent BMI: The Importance of Intrinsic and Extrinsic Factors. The Open Public Health Journal. 2018;11(1):147-61. https://doi.org/k55w.