Publicado
Urban sprawl prediction in Batna City, Eastern Algeria, Using the SLEUTH model
Predicción de la expansión urbana en la Ciudad de Batna, este de Argelia, utilizando el modelo SLEUTH
Prévision de l'étalement urbain dans la ville de Batna, dans l'est de l'Algérie, à l'aide du modèle SLEUTH
Previsão de expansão urbana em Batna City, leste da Argélia, usando o modelo SLEUTH
DOI:
https://doi.org/10.15446/bitacora.v33n3.106226Palabras clave:
GIS, urbanization, urban planning (en)Ciudad de Batna, SIG, Urbanización, Ordenamiento urbano (es)
SIG, urbanisation, planification urbaine (fr)
SIG, urbanização, planejamento urbano (pt)
Descargas
As a developing country, Algeria has experienced urban extensions, often poorly managed, which have generated numerous social, urban, and economic problems. In this context, this work aims to present an integrated approach combining spatial modeling, geographic remote sensing, and geographic information system to plan sustainable urban growth and mitigate the aforementioned issues. This work introduces urban sprawl simulation using the SLEUTH model, based on the cellular automata method. SLEUTH, implemented with a open-source code, facilates the simulation and prediction of urban sprawl. Applied to the Batna metropolitan area, SLEUTH is calibrated using four chronological series of data extracted from satellite images spanning from 1986 to 2020, with approximately 2,000 hectares transformed into urban land, representing an increase of about 180%. Future scenarios simulations were conducted for a 50-year period up to 2072, revealing two growth stages of urbanized areas. Beyond 2048, population density experiences a constant increase, marking the point at which Batna city reaches its urbanization limits. These findings highlight the necessity for urban planners to prepare an appropriate urban policy within a suitable timeframe. The integration of the SLEUTH model into the decision-making process is recommended to enhance urban policy management.
Como país en desarrollo, Argelia ha experimentado extensiones urbanas, a menudo mal gestionadas, que han generado numerosos problemas sociales, urbanos y económicos. En este contexto, este trabajo tiene como objetivo presentar un enfoque integrado que combina la modelización espacial, la teledetección geográfica y el sistema de información geográfica para planificar un crecimiento urbano sostenible y mitigar los problemas mencionados anteriormente. Este trabajo introduce la simulación del esparcimiento urbano utilizando el modelo SLEUTH, basado en el método de autómatas celulares. SLEUTH, implementado con un código de fuente abierta, facilita la simulación y predicción del esparcimiento urbano. Se realizaron simulaciones de escenarios futuros para un período de 50 años hasta 2072, revelando dos etapas de crecimiento de áreas urbanizadas. Más allá de 2048, la densidad de población experimenta un aumento constante, marcando el punto en el que la ciudad de Batna alcanza sus límites de urbanización. Estos hallazgos resaltan la necesidad de que los urbanistas preparen una política urbana adecuada en un plazo adecuado. Se recomienda la integración del modelo SLEUTH en el proceso de toma de decisiones para mejorar la gestión de la política urbana.
En tant que pays en voie de développement, l'Algérie a connu des extensions urbaines souvent mal gérées, générant de nombreux problèmes sociaux, urbains et économiques. Dans ce contexte, ce travail vise à présenter une approche intégrée combinant la modélisation spatiale, la télédétection géographique et les systèmes d'information géographique pour planifier une croissance urbaine durable et atténuer les problèmes susmentionnés. Ce travail introduit la simulation de l'étalement urbain en utilisant le modèle SLEUTH, basé sur la méthode des automates cellulaires. SLEUTH, mis en œuvre avec un code open source, facilite la simulation et la prédiction de l'étalement urbain. Appliqué à la région métropolitaine de Batna, SLEUTH est calibré à l'aide de quatre séries chronologiques de données extraites d'images satellitaires s'étendant de 1986 à 2020, environ 2,000 hectares ont étés transformés en terres urbaines, soit une augmentation d'environ 180%. Des simulations de scénarios futurs ont été menées pour une période de 50 ans jusqu'à 2072, révélant deux phases de croissance des zones urbanisées. Ces résultats soulignent la nécessité pour les urbanistes de préparer une politique urbaine appropriée dans un délai adéquat. L'intégration du modèle SLEUTH dans le processus de prise de décision est recommandée pour améliorer la gestion de la politique urbaine.
Como um país em desenvolvimento, a Argélia tem experimentado extensões urbanas, muitas vezes mal administradas, que geraram inúmeros problemas sociais, urbanos e econômicos. Nesse contexto, este trabalho tem como objetivo apresentar uma abordagem integrada que combina modelagem espacial, sensoriamento remoto geográfico e sistema de informações geográficas para planejar um crescimento urbano sustentável e mitigar os problemas mencionados anteriormente. Este trabalho introduz a simulação de expansão urbana usando o modelo SLEUTH, baseado no método de autômatos celulares. O SLEUTH, implementado com um código aberto, facilita a simulação e a previsão da expansão urbana. Foram conduzidas simulações de cenários futuros para um período de 50 anos até 2072, revelando duas etapas de crescimento de áreas urbanizadas. Além de 2048, a densidade populacional experimenta um aumento constante, marcando o ponto em que a cidade de Batna atinge seus limites de urbanização. Essas descobertas destacam a necessidade de planejadores urbanos prepararem uma política urbana adequada dentro de um prazo adequado. A integração do modelo SLEUTH no processo de tomada de decisão é recomendada para aprimorar a gestão de políticas urbanas.


Urban sprawl prediction in Batna City, Eastern Algeria, Using the SLEUTH model
Predicción de la expansión urbana en la Ciudad de Batna, este de Argelia, utilizando el modelo SLEUTH
Prévision de l'étalement urbain dans la ville de Batna, dans l'est de l'Algérie, à l'aide du modèle SLEUTH
Previsão de expansão urbana em Batna City, leste da Argélia, usando o modelo SLEUTH
Khaled Hersous
Faculty of Earth Sciences, Geography and Territorial Planning, University of Bab Ezouar, Algiers/Institute of Urban Management and Techniques, University of M'sila, Algeria khaled.
khaled.hersouss@gmail.com
https://orcid.org/0000-0003-0385-4610
Souiher Nouari
Faculty of Earth Sciences, Geography and Territorial Planning, University of Bab Ezouar, Algiers
souihernouari@gmail.com
https://orcid.org/0000-0001-5781-1013
Farouk Mezali
Corresponding author. Faculty of Technology, University of M’sila, Algeria
mezali_farouk@yahoo.fr
https://orcid.org/0009-0008-4160-0690
Rahim Aguejdad
CNRS, Montpellier, France
rahim.aguejdad@cnrs.fr
https://orcid.org/0000-0001-6753-5331/
Cómo citar este artículo:
Hersous, K., Nouari, S., Mezali, F. & Aguejdad, R. (2022). Urban sprawl prediction in Batna City, Eastern Algeria, Using the SLEUTH model. Bitácora Urbano Territorial, 33(III): https://doi.org/10.15446/bitacora.v33n3.106226
Fuente: Autoría propia
Recibido: 05/12/2022
Aprobado: 10/06/2023
ISSN electrónico 2027-145X. ISSN impreso 0124-7913. Universidad Nacional de Colombia, Bogotá
(3) 2023: 29-44
Autores
02_106226
Abstract
As a developing country, Algeria has experienced urban extensions, often poorly managed, which have generated numerous social, urban, and economic problems. In this context, this work aims to present an integrated approach combining spatial modeling, geographic remote sensing, and geographic information system to plan sustainable urban growth and mitigate the aforementioned issues. This work introduces urban sprawl simulation using the SLEUTH model, based on the cellular automata method. SLEUTH, implemented with a open-source code, facilates the simulation and prediction of urban sprawl. Applied to the Batna metropolitan area, SLEUTH is calibrated using four chronological series of data extracted from satellite images spanning from 1986 to 2020, with approximately 2,000 hectares transformed into urban land, representing an increase of about 180%. Future scenarios simulations were conducted for a 50-year period up to 2072, revealing two growth stages of urbanized areas. Beyond 2048, population density experiences a constant increase, marking the point at which Batna city reaches its urbanization limits. These findings highlight the necessity for urban planners to prepare an appropriate urban policy within a suitable timeframe. The integration of the SLEUTH model into the decision-making process is recommended to enhance urban policy management.
Keywords: Batna city, GIS, urbanization, urban planning
Resumen
Como país en desarrollo, Argelia ha experimentado extensiones urbanas, a menudo mal gestionadas, que han generado numerosos problemas sociales, urbanos y económicos. En este contexto, este trabajo tiene como objetivo presentar un enfoque integrado que combina la modelización espacial, la teledetección geográfica y el sistema de información geográfica para planificar un crecimiento urbano sostenible y mitigar los problemas mencionados anteriormente. Este trabajo introduce la simulación del esparcimiento urbano utilizando el modelo SLEUTH, basado en el método de autómatas celulares. SLEUTH, implementado con un código de fuente abierta, facilita la simulación y predicción del esparcimiento urbano. Se realizaron simulaciones de escenarios futuros para un período de 50 años hasta 2072, revelando dos etapas de crecimiento de áreas urbanizadas. Más allá de 2048, la densidad de población experimenta un aumento constante, marcando el punto en el que la ciudad de Batna alcanza sus límites de urbanización. Estos hallazgos resaltan la necesidad de que los urbanistas preparen una política urbana adecuada en un plazo adecuado. Se recomienda la integración del modelo SLEUTH en el proceso de toma de decisiones para mejorar la gestión de la política urbana.
Palabras clave: Ciudad de Batna, SIG, Urbanización, Ordenamiento urbano
Résumé
En tant que pays en voie de développement, l'Algérie a connu des extensions urbaines souvent mal gérées, générant de nombreux problèmes sociaux, urbains et économiques. Dans ce contexte, ce travail vise à présenter une approche intégrée combinant la modélisation spatiale, la télédétection géographique et les systèmes d'information géographique pour planifier une croissance urbaine durable et atténuer les problèmes susmentionnés. Ce travail introduit la simulation de l'étalement urbain en utilisant le modèle SLEUTH, basé sur la méthode des automates cellulaires. SLEUTH, mis en œuvre avec un code open source, facilite la simulation et la prédiction de l'étalement urbain. Appliqué à la région métropolitaine de Batna, SLEUTH est calibré à l'aide de quatre séries chronologiques de données extraites d'images satellitaires s'étendant de 1986 à 2020, environ 2,000 hectares ont étés transformés en terres urbaines, soit une augmentation d'environ 180%. Des simulations de scénarios futurs ont été menées pour une période de 50 ans jusqu'à 2072, révélant deux phases de croissance des zones urbanisées. Ces résultats soulignent la nécessité pour les urbanistes de préparer une politique urbaine appropriée dans un délai adéquat. L'intégration du modèle SLEUTH dans le processus de prise de décision est recommandée pour améliorer la gestion de la politique urbaine.
Mots-clés: Ville de Batna, SIG, urbanisation, planification urbaine
Resumo
Como um país em desenvolvimento, a Argélia tem experimentado extensões urbanas, muitas vezes mal administradas, que geraram inúmeros problemas sociais, urbanos e econômicos. Nesse contexto, este trabalho tem como objetivo apresentar uma abordagem integrada que combina modelagem espacial, sensoriamento remoto geográfico e sistema de informações geográficas para planejar um crescimento urbano sustentável e mitigar os problemas mencionados anteriormente. Este trabalho introduz a simulação de expansão urbana usando o modelo SLEUTH, baseado no método de autômatos celulares. O SLEUTH, implementado com um código aberto, facilita a simulação e a previsão da expansão urbana. Foram conduzidas simulações de cenários futuros para um período de 50 anos até 2072, revelando duas etapas de crescimento de áreas urbanizadas. Além de 2048, a densidade populacional experimenta um aumento constante, marcando o ponto em que a cidade de Batna atinge seus limites de urbanização. Essas descobertas destacam a necessidade de planejadores urbanos prepararem uma política urbana adequada dentro de um prazo adequado. A integração do modelo SLEUTH no processo de tomada de decisão é recomendada para aprimorar a gestão de políticas urbanas.
Palavras-chave: Cidade de Batna, SIG, urbanização, planejamento urbano

The process of urbanization is a universal phenomenon occurring worldwide, with 55% of the world’s population currently residing in urban areas. Projections suggest that this figure is expected to rise to 68% by 2050 (Nations, 2019). The allure of urban lifestyle and substantial investments in infrastructures and public amenities drive this urban growth. Developing countries have experienced rapid population growth in their cities, often surpassing the capacity of states and governments to effectively plan housing programs and infrastructure development, leading to hasty decision-making under the pressures of social and economic crises (Drakakis-Smith, 1995; Shi, 2021).
Algerian cities, under the pressure of the housing crisis, have relied on collective housing policies to accommodate the greatest number of demands (Bellal, 2009). However, the issue of land scarcity has contributed to urban expansion, resulting in the formation of urban cores with spatial discontinuities. Among the notable inland cities in Algeria, Batna which has benefited from several government housing programs to achieve a balance with the coastal strip, and it has expanded in all directions (territoire, 1992). This expansion promoted the idea to study and model urban growth expansion using an open-source program.
The management of urban sprawl and its inherent problems, particularly on land use, consumption of space, and natural resources, requires a rationalization of planning and anticipation policies (Peiser, 2001). In this perspective, modern urban managers must equip themselves with advanced tools that leverage technology, such as Geographic Information Systems (GIS), remote sensing, and mathematical modeling. In this context, the SLEUTH model is used to model and monitor the phenomenon over time (Sudhira, 2004).
Geographical Information System techniques applied to remote sensing data, play a crucial role in mapping, monitoring, measuring, analysing, and modeling urban sprawl. Remote Sensing provides detailed spatial and temporal information on urban morphology, infrastructure, and land cover/land use patterns (Bhatta, 2010).
The SLEUTH model is a cellular automaton (CA) model for urban growth and land-use change that has been applied in the geographic simulation of future planning scenarios. This model was originally developed by Keith Clarke at the University of California, Santa Barbara, the model aims to calculate values and growth coefficients that faithfully reproduce historical urban growth over specific periods based on input data. The input data includes slope, land use, exclusion, urban extent over time, transportation, and hillshade background used for visualization.
This model has been widely used and tested in several cities around the world, including North America, China, Europe, and India. The beginning of the application was in several American cities, it’s firstly to simulate the San Francisco Bay Area urban extension (Clarke, 1997) and the Washington area Baltimore (Clarke, 1998). Applications within the United States multiplied thereafter, not only in the field of urbanization but also in aspects of land use change, flood risk, biodiversity, habitat, fire monitoring, etc. (Chaudhuri, 2013). After five years, it was the honor of Lisbon in Portugal to be the first to test the model outside the United States(Silva, 2002). Outside the United States, China is the country with the largest number of SLEUTH applications, particularly in big cities with very a rapid urban growth (Chaudhuri, 2013; Jat, 2008). The experience expanded to include many cities of various other countries such as Brazil, Mexico, South Africa, Spain, India, and Thailand, and Iran. In the Arab world, SLEUTH has been applied in cities such as Muscat (Oman), Egypt, and lately in Casablanca (Morocco).
SLEUTH is very popular in academic circles, and the number of its users is constantly growing, this is due to its open access, and its relative ease of implementation and calculation, it is an Open source software, written in C programming language and running on the UNIX or LINUX operating system (Clarke, 2004).
This work was carried out in several phases, starting with a comprehensive analysis of the study area, followed by data collection and preparation for implementation within the SLEUTH model. Finally, the analysis and evaluation of the prediction results within the framework of urban space management and a reorientation of urban development policies. To the best of our knowledge, the application of this model on urban expansion in Algeria has not yet been tested in any city, motivating us to explore its in measuring and quantifying the sprawl over the city of Batna, eastern Algeria, and its potential adoption in city planning.
Despite the credibility of the literature that has significantly improved the predictive ability of urban growth models (UGMs) over several years, the implementation of these models in the process of urban planning and decision-making in Algeria still remains stagnant (Fouad, 2021). Except for a few recent studies that have tried to test these models in the Algerian context but not yet Sleuth model. A study on predictive modeling of urban sprawl in the eastern suburbs of the capital Algiers, using LCM on idrissi software (Atik, 2020), others tried CA–Markov model (Hind et al., 2022). Another study attempted to measure the relationship between LULC characteristic and LST using remote sensing and GIS (Guechi, 2021; Shi & Zhang, 2021), the spatiotemporal monitoring of coastal urbanization dynamics on the bay of Algiers, is approached by (Rabehi et al., 2019).
These studies are part of the perspective geography ,wich is an approach that helps to understand the spatial issues of a region by taking into account the social, economic and environmental dynamics at work there. In Algeria, this approach is of particular importance in the context of the development of the Master Plan for Development and Urbanism PDAU. which is a reference document that defines the orientations and long-term objectives in terms of regional development and urban planning. It makes it possible to plan economic, social and environmental activities while preserving natural resources and improving the quality of life of populations.
Study Area

Batna city is one of the most important agglomerations in the Eastern Highlands region, known for its spatial equilibrium with the coastline, aligning with the objectives of the spatial planning policy (territoire, 1992). It is located admist the Saharan Atlas mountain range in the heart of the Aurès massif, at an average altitude of 950m. The city’s geographical coordinates lie between 6°7’59” and 6°13’31” East longitude and between 35°34’23 and 35°31’26” North latitude.
Batna’s strategic location allows it to serve multiple functions, starting as a colonial camp during the French era and later transforming into a crucial center for trade and economic connections between the northern (the region of Tell) and the southern (the region of the Sahara) parts of Algeria.
The national road n ° (03) connects it to both the governorates of Constantine and Skikda in the North and Tougourt in the South. Accessibility and flattening favored construction and urban sprawl in all directions. According to the general census of housing and population RGPH, the city has more than 400,000 inhabitants and 62,000 housing units (Statistiques, 2012).
Data Source and Methodology
Data source
In this study, the main source of data is the LANDSAT satellite image with a resolution of 30 meters, and SRTM data of the same resolution for obtaining the slope and shading maps. These datasets were freely downloaded from the NASA website (USGS), other vector data were obtained from different sources or digitized from satellite images, supplemented by fieldwork and various interviews. The relevant data used for this study are listed in Table 1 while the complete input map files are illustrated in figure 3. In this study, multi-date Landsat images sufficiently spaced are used, and the images are acquired almost in the same period of the year for change detection, to mitigate issues arising from differences in solar angles, phenological changes in vegetation, and differences in soil moisture. The images were taken during spring to avoid weak solar radiation and plant activity.
Roads networks were digitized from the satellite images, and the parts excluded from the urbanization were obtained from a map delineating the Belezma national park; Mount Belezma, is an prominent massif with rugged relief, narrow valleys and peaks rising up to 2,136 m (djebel Tichaou) and 2,178 m (djebel Refaâ), constitutes the beginning of the Aurès chain. The park was recognized as a biosphere reserve by Unesco in June 2015, these park boundaries were digitized and georeferenced then superimposed with the extent of our study area, to analyze the socio-economic parameters affecting urban growth. Data from the inter-municipal master plan for development and urban planning and demographic statistics were used, such as data from the urban coherence plan of Batna city.
Prepared Data
For this study, four temporal datasets of urban areas from 1986, 2000, 2011, 2020 were used. These images have been rigorously analyzed through a visual interpretation.This allows us to distinguish the different forms of land use, then to carry out a supervised classification (maximum likelihood) using ArcGIS 10.3. These results were validated by the Kappa index which revolves around 0.89-0.92. The model requires a binary classification of urban/non-urban data; urban is given a value of 100, and non-urban is given a value of 0, this layer was converted to raster and exported to GIF format with 30m resolution.
To assess the influence of transport networks on the urban development, SLEUTH requires at least two road layers that change the city’s growth over time. The road networks were digitized from satellite images of 2011 and 2020; Road network images are binary, road/non-road. The road is given a value of 100, and the non-road is given a value of 0. These classified layers were exported as GIF format in 30m resolution.
The slope data was derived from Digital Elevation Model (DEM) data from ASTER. Using Spatial Analyst toolbar in ArcGIS 10.3, percent slope at each pixel was computed percentage grade class intervals (0-5,5-10, 10-20, above 20) have been adopted. The slope is reclassified and exported to GIF format with 30m cell size resolution.
Supervised classification of land use was conducted based on visual interpretation classification; where the SLEUTH model requires at least one layer of land use. Two-layers were prepared between 2011 and 2020 for a complete correspondence with the urban pixels of the urban/non-urban layers with those of the land cover. The land cover layer has been reclassified as urban/non-urban using the reclassify tool in Arctoolbars. The land use layer contains urban, agriculture, forest, and tundra. Their pixel values are chosen following the land cover colorable proposed by the default scenario file of SLEUTH. Hence, pixel values are respectively 1-2- 4 -7 with color values in hexadecimal coding as follows:
Urban: 0X8b2323 (dark red)Agric: 0Xffec8b (pale yellow)
Forest: 0X006400 (green: camarone) Tundra: 0Xeec591
The excluded layer was prepared by digitizing the boundaries of Belzema national park, which intersects with the study extent. This area is considered impossible for urbanization, while the rest of the extent is regarded favorable for urbanization, and the layer was exported in GIF format.
SLEUTH implementation
The SLEUTH model consists of two essential components: the Urban Growth Model (UGM), which is based on cellular automata; and the Deltatron Land Cover Model (LDM) (Caglioni, 2006; Candau, 2000). SLEUTH is reinforced by several mathematical functions that establish several standards and indices to determine the good coefficients of simulation of the scenarios. To control the dynamics of urban growth to be studied, the model is based on the five coefficients: diffusion, breed, spread, slope, and road gravity, which are instrumental in generating four types of growth rules: stochastic growth, new spreading center growth, edge growth and road gravity growth (Silva, 2002). Breed Factor (Coefficient) determines the probability that a new center is generated, detached, or influenced by the route and begins its own growth cycle. The diffusion factor (coefficient) controls the overall depression of growth. The spreading coefficient contains the amount of diffusion expansion that occurs from existing agglomeration, and Slope Resistance influences the likelihood of urban extension on steeper slopes. Road Gravity encourages the development of new settlements near the road network (Clarke, 1998).
The growth rules are applied cell by cell with synchronization of the update at the end of each year, and this constitutes the basis of calculation of the urban growth for the next year. Probable cells for urbanization are randomly selected, and the growth rules examine properties of the cell and its neighbors such as whether they are already urbanized, their slope, and the proximity to roads (Clarke, 1998). After passing the newly urbanized cells the random coefficient tests (Diff, Brd, Sprd, Slp, RG), the second level of growth rules called “self-modification” is applied to address abnormally high or low growth rates beyond certain thresholds or a critical number (Clarke, 2018; Clarke, 1997). The calibration phase which is the most important produces several coefficients and indices, the most significant ones summarized in Table 2.
SLEUTH calibration
Calibration is the most important phase for the SLEUTH model conducted through Monte Carlo simulation, involving three stages: coarse, fine, and final calibration, This phase aims to calculate a set of growth coefficient values that can accurately replicate the historical urban growth in the study area based on input data for the model (Clarke, 1997) and (Clarke, 2004).This operation may take several hours or days, depending on the computer specifications. Calibration phase aims to determine the best fit values for the five growth control parameters, including the coefficients of diffusion, breed and spread, slope resistance, and road gravity, using historical urban extent data. These values of differents coefficients are stored in the table fomat file named « control_stats.log », to determine best fit values for the five coefficient, the table is rearranged in descending order using the Lee Sallee metric, the high and low of top three rankings of each coefficients are choosen as the starting and stopping values for the next calibration step.
The Optimum SLEUTH Metric (OSM) , developed by (Clarke, 1997; Dietzel, 2004), helps select values for the subsequent phase of calibration; in this study, manual selection based on Lee Salle metric was used for choosing values.
In the initial coarse phase of calibration, the entire range (0 - 100) of the five coefficients is explored using large increments (e.g.; for each coefficient, value = 0, 25, 50, 75, 100), and the resolution of the data is 1/4 of its original size (Clarke, 1997; Dietzel, 2004). In this study, the resolution used is 200×189 which is 1/4 of the original resolution, with 3Monte Carlo iterations, the values resulting from this step are shown in Table 3, these selected values are used for the next calibration step.
In fine calibration,1/2 of the original resolution is used and 7 Monte Carlo iterations,with the five coefficients are modified into scenario file with the values taken from coarse calibration results (table 3), following the same process for the final calibration, and the full resolution and 10 Monte Carlo iterations. The different values of different coefficients are shown in table 3.
Prediction Mode
The prediction mode represents the final objective of the SLEUTH model, achieved through excellent calibration to ensure efficient simulation results. The forecasting begins in 2022 and extends until 2072, covering a 50-year period. In the prediction mode, the values of parameters in the “predict scenario file”, are modified according to the values obtained in the final calibration, using file avg.log. The values from the last row in avg.log (STOP_DATE year) representing the diffuse, breed, spread, slp_res, and rd_grav values, then Round float values to integers. For this study, the selected values used to run the prediction mode are presented in table 4.
Results and discussions
To calculate the probable area for urbanization in the final prediction year, the output files were used, including the avg.log file that contains averaged metrics for our run. The “pop” or “area” column in this file provides the total number of urban pixels each year, which was converted to area measurement by multiplying by the area of each pixel (30x 30 = 900 m2). and then converted to hectares.
The methodology adopted in this study made it possible to obtain quantitative estimates to measure changes between different periods (Figure 4). A synthetic map of the spatial perimeter’s development of urban communities in the study area between 1986 and 2020 was obtained. Figure 4.a) depicts the forecasting cumulative map growth for the last year 2072 with the hillshade map as background. The yellow color represents the initial urbanized area, while the red color indicates the cumulative maximum probability of urban growth for 2072. Figures 4b), 4c) 4d), and 4e) provide detailed evolution growth probability during the years 2020, 2030, 2050, 2060, and 2072, calculated through Monte Carloiterations.
The color key for the maps is given in Table 5 with the principle the higher the probability value, the more likely urbanization is. The range of values from 90 to 100 is given by the dark red color on the map and is visually considered as the most likely urbanized area (Figures 4b), 4c) 4d) and 4e).
Observations show that the city’s extension primaly occurs in the direction of least resistance, such as the plains in the east and south-west, avoiding steep slopes. Visually, until the year 2050, considerable buildable land remains available in the plains. The percentage of the total change between 1986 and 2020 was approximately 180%, resulting in an estimated transformation of about 2000 hectares into urban land (figure 5). The table also shows that 1999-2011 witnessed the highest population growth rate, exceeding 50%. Additionally, the same table indicates that the region has an average annual urbanization opening of about 600 ha.
The evolution of Batna’s population between 1966 and 2010 is depicted in figure 5a). The extrapolation of this population in future years using a linear regression equation (Y= 6.07×10³X – 1.19×10⁷, where Y is the estimated population and X is the year) in which the population is estimated. The correlation coefficient (R2=0.9948) of this linear regression is very close to 1, so it can be stated that the evolution of the population in the area follows a linear trend. This estimation is used to calculate the population density of the urbanized surface. Figure 5b) shows the evolution of the urbanized surface, while curve 5c) indicates the percentage evolution of the urbanized surface. Curves 5b) and 5c) are divided into two stages, the first stage between 2020 and 2048, where the evolution is rapid from 18.9% (6196.0ha) to 39.5% (13603.9 ha), and a second stage between the years 2048 and 2072, where the evolution of the urbanized surface remains almost constant from 39.9% (13748.0ha) to 42% (14512.2ha). Figure (d) illustrates the -predicted- evolution of the population density from 2020 until 2072. It can be seen that the density decreases from 58.4 hab/ha to 40 hab/ha between 2020 and 2048. From 2048 onwards, the density increases to the value of 47.5 hab/ha, and this upward trend continues.
The decrease in density indicates that urban area growth is faster than the population growth, which is mainly explained by the changes in social structure, from large families to the nuclear households, serving as an indicator for the capacity of the city and future housing projects. The city’s capacity reaches its limit around 2050 when the urbanized surface stagnates and population growth becomes dominant. To address potential problems arising from incessantly increasing population density, it is essential to implement various proposals such as valorization of empty pockets and industrial or other brownfield sites; rethinking of a model of vertical expansion, particularly in the old city center and working-class neighborhoods; reinforcing urban coherence strategies between the different municipalities of the urban area. These proposals constitute a kind of policy of the city which aims to stem the possible problems. In particular, the difficulties of space consumption and the distance of places of residence from the workplace generates the classic problem of urban mobility.
It should be noted that these proposals are integrated in one way or another into the various government and local authority programs. In our case, we aim to strategically time and expedite these projects to increase the duration of the potentialities of reception and extension of our city.
The use of the model is relatively easy, and the necessary data are affordable,it can be easily integrated into the process of developing the master plan and urban planning but the model does not take into account socio-economic data, and the calibration time is relatively long on a standard computer.
Conclusion
In this work, a follow-up of the urban sprawl of Batna city was carried out using cellular automata - taking advantage of their modeling powers - through the SLEUTH code. This code is executed in three main phases: test mode, calibration mode, and prediction mode. Data was prepared using the GIS tool, including slope, urban, road networks..etc., obtained from LANDSAT and SRTM satellites. The other data were collected through local organizations: populations, study office. After the execution of the code and the exploitation of the results given, the main results found are as follows:
First, regulatory planning tools should use GIS and SLEUTH forecast models to predict sprawl scenarios and prepare for possible problems that can arise from urban expansion. Second, the city of Batna primarily expands along two axes: the East-Southeast axis toward Tazoult and AiounnLassafir, and the Southwest axis toward OuedChaaba. Third, the city’s sprawl will inevitably lead to an urban conurbation with neighboring municipalities, including Tazoult and AiounnLassafir, which are already included in the inter-municipal PDAU. Therefore, it is necessary to rethink and plan the management of municipal space by promoting functional strategies over administrative procedures. Fourth, the urban area is projected to double in size within 20 years, consuming over 600 hectares of bare land. Finally, urban expansion is naturally concentrated in areas with low slopes, a concept known as “geographical determinism”.
References

ATIK, M. A., ABDELKADER; NEDJAI, RACHID; BELAL, BELKACEM. (2020). Modélisation prédictive de l’étalement urbain des grandes métropoles du bassin méditerranéen sur l’espace agricole: application au secteur oriental de l’agglomération algéroise (algérie). Analele Universitatii Bucuresti: Geografie/Annals of the University of Bucharest – Geography Series, ٦٩(١), ١١٧–١٣٨. https://doi.org/١٠.٥٧١٩/aub-g/٦٩.١/٧
BELLAL, T. (٢٠٠٩). Housing supply in Algeria: affordability matters rather than availability. Theoretical and Empirical Researches in Urban Management, ٤(٣(١٢)), ٩٧-١١٤. https://EconPapers.repec.org/RePEc:rom:terumm:v:٤:y:٢٠٠٩:i:١٢:p:٩٧-١١٤
BHATTA, B. (٢٠١٠). Analysis of Urban Growth and Sprawl from Remote Sensing Data. Springer.
CAGLIONI, M. P., MATTIA;RABINO, GIOVANNI A. (٢٠٠٦, ٢٠٠٦//). Urban Sprawl: A Case Study for Project Gigalopolis Using SLEUTH Model. Cellular Automata, Berlin, Heidelberg.
CANDAU, J. R., STEEN; CLARKE, KEITH C. (٢٠٠٠). A coupled cellular automaton model for land use/land cover dynamics. ٤th International conference on integrating gis and environmental modeling (GIS/EM٤).
CHAUDHURI, G. C., KEITH. (٢٠١٣). The SLEUTH Land Use Change Model: A Review. Environmental Resources Research, ١(١), ٨٨-١٠٥. https://doi.org/١٠.٢٢٠٦٩/ijerr.٢٠١٣.١٦٨٨
CLARKE, K. C. (٢٠٠٤). The Limits of Simplicity: Toward GeoComputational Honesty in Urban Modeling. In GeoDynamics. https://doi.org/١٠.١٢٠١/٩٧٨١٤٢٠٠٣٨١٠١
CLARKE, K. C. (٢٠١٨). A Short Presentation of SLEUTH. In M. T. Camacho Olmedo, M. Paegelow, J.-F. Mas, & F. Escobar (Eds.), Geomatic Approaches for Modeling Land Change Scenarios (pp. ٥٢١-٥٢٥). Springer International Publishing. https://doi.org/١٠.١٠٠٧/٩٧٨-٣-٣١٩-٦٠٨٠١-٣_٣٩
CLARKE, K. C. G., LEONARD J. (١٩٩٨). Loose-coupling a cellular automaton model and GIS: long-term urban growth prediction for San Francisco and Washington/Baltimore. International Journal of Geographical Information Science, ١٢(٧), ٦٩٩-٧١٤. https://doi.org/١٠.١٠٨٠/١٣٦٥٨٨١٩٨٢٤١٦١٧
CLARKE, K. C. H., S.;GAYDOS, L. (١٩٩٧). A Self-Modifying Cellular Automaton Model of Historical Urbanization in the San Francisco Bay Area. Environment and Planning B: Planning and Design, ٢٤(٢), ٢٤٧-٢٦١. https://doi.org/١٠.١٠٦٨/b٢٤٠٢٤٧
DIETZEL, C. C., KEITH C. (٢٠٠٤). Replication of spatio-temporal land use patterns at three levels of aggregation by an urban cellular automata. International conference on cellular automata,
DRAKAKIS-SMITH, D. (١٩٩٥). Third World Cities: Sustainable Urban Development, ١. Urban Studies, ٣٢(٤-٥), ٦٥٩-٦٧٧. https://doi.org/١٠.١٠٨٠/٠٠٤٢٠٩٨٩٥٥٠٠١٢٨٢٥
FOUAD, L. S., MAZOUZ; ABDELBASSET, LAROUI; OKBA, BENAMEUR. (٢٠٢١). Introducing Urban Growth Models (UGM) in the Algerian Urban Planning Practice: Advantages and Drawbacks. In R. Rahbarianyazd (Ed.), Contemporary Approaches in Urbanism and Heritage Studies. Cinius Yayınları Publication. https://doi.org/DOI: ١٠.٣٨٠٢٧/N١١ICCAUA٢٠٢١٢٧٢
GUECHI, I. G., HALIMA; ALKAMA, DJAMEL. (٢٠٢١). Relationship between LULC characteristic and LST using remote sensing and GIS, case study Guelma (Algeria). Romanian Journal of Geography/Revue Roumaine de Géographie, 65(2). http://www.rjgeo.ro/issues/revue%20roumaine%2065_2/guechi%20et%20al..pdf
HIND, M., M’HAMMED, S., DJAMAL, A., & ZOUBIDA, N. (٢٠٢٢). Assessment of land use–land cover changes using GIS, remote sensing, and CA–Markov model: a case study of Algiers, Algeria. Applied Geomatics, ١٤(٤), ٨١١-٨٢٥. https://doi.org/١٠.١٠٠٧/s١٢٥١٨-٠٢٢-٠٠٤٧٢-w
JAT, M. K. G., P. K.;KHARE, DEEPAK. (٢٠٠٨). Monitoring and modelling of urban sprawl using remote sensing and GIS techniques. International Journal of Applied Earth Observation and Geoinformation, ١٠(١), ٢٦-٤٣. https://doi.org/https://doi.org/١٠.١٠١٦/j.jag.٢٠٠٧.٠٤.٠٠٢
NATIONS, U. (٢٠١٩). World Urbanization. Prospects: The ٢٠١٨ Revision (٩٧٨-٩٢-١-١٤٨٣١٩-٢). https://population.un.org/wup/publications/Files/WUP٢٠١٨-Report.pdf
PEISER, R. (٢٠٠١). Decomposing urban sprawl. Town planning review, ٧٢(٣), ٢٧٥-٢٩٩. https://www.jstor.org/stable/٤٠١١٢٤٥٥
RABEHI, W., GUERFI, M., MAHI, H., & ROJAS-GARCIA, E. (٢٠١٩). Spatiotemporal Monitoring of Coastal Urbanization Dynamics: Case Study of Algiers’ Bay, Algeria. Journal of the Indian Society of Remote Sensing, ٤٧(١١), ١٩١٧-١٩٣٦. https://doi.org/١٠.١٠٠٧/s١٢٥٢٤-٠١٩-٠١٠٣٧-y
SHI, W., GOODCHILD; M. F., BATTY; M., KWAN; M.-P., & ZHANG, A. (٢٠٢١). Urban Informatics. Springer Singapore. https://doi.org/١٠.١٠٠٧/٩٧٨-٩٨١-١٥-٨٩٨٣-٦
SHI, W., & ZHANG, A. (٢٠٢١). Introduction to Urban Computing. In W. Shi, M. F. Goodchild, M. Batty, M.-P. Kwan, & A. Zhang (Eds.), Urban Informatics (pp. ٧٢٣-٧٢٦). Springer Singapore. https://doi.org/١٠.١٠٠٧/٩٧٨-٩٨١-١٥-٨٩٨٣-٦_٣٩
SILVA, E. A. C., K. C. (٢٠٠٢). Calibration of the SLEUTH urban growth model for Lisbon and Porto, Portugal. Computers, Environment and Urban Systems, ٢٦(٦), ٥٢٥-٥٥٢. https://doi.org/https://doi.org/١٠.١٠١٦/S٠١٩٨-٩٧١٥(٠١)٠٠٠١٤-X
STATISTIQUES, O. N. D. (2012). 5ème recensement général de la population et de l’habitat (RGPH), tableau récapitulatif communal, Commune de Batna.
SUDHIRA, H. S. R., T. V.; JAGADISH, K. S. (٢٠٠٤). Urban sprawl: metrics, dynamics and modelling using GIS. International Journal of Applied Earth Observation and Geoinformation, ٥(١), ٢٩-٣٩. https://doi.org/https://doi.org/١٠.١٠١٦/j.jag.٢٠٠٣.٠٨.٠٠٢
TERRITOIRE, M. D. L. É. E. D. L. A. D. (1992). Demain l’Algérie: Etat du territoire, la reconquête du territoire.
Khaled Hersous
PhD student in geography and regional planning at the Houari Boumedienne University of Science and Technology in Algiers. Assistant professors at the University of M'sila, urban engineering department responsible for several modules (cartography, GIS, role of urban actors), supervisor of several master's theses relating to urban management.
Farouk Mezali
Doctor in Hydraulic Engineering from Ecole Nationale Polytechnique (ENP) of Algiers, assistant professor at the University of M’sila, hydraulic department and institute of management of urban techniques.
Autores
Souiher Nouari
Professor of geography and regional planning at the Houari Boumedienne University of Science and Technology in Algiers. Head of department and responsible for several research, doctorate and master's projects in urban and regional planning.
Rahim Aguejdad
Researcher CNRS - National Center for Scientific Research in France, doctor in remote sensing and urban modeling at the University of Rennes II - Haute Bretagne, author of several articles on urban sprawl, modeling, remote sensing, land use.
Urban sprawl prediction in Batna City, Eastern Algeria, Using the SLEUTH model

Among the notable inland cities in Algeria, Batna which has benefited from several government housing programs to achieve a balance with the coastal strip, and it has expanded in all directions (territoire, 1992). This expansion promoted the idea to study and model urban growth expansion using an open-source program.
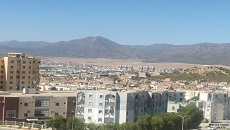
Figure 1. Study area
Source: Map by author.

|
Input layer |
Preparedthrough |
Base format and year |
SLEUTH format |
|
Urban extension |
Supervised classification of the satellite images. Exported to shapefile format for data processing |
|
Raster (GIF) |
|
Transportation network |
Extracted from Open Street Map Data. Prepared On-screen digitization from satellite image |
Vector |
Raster (GIF) |
|
Slope |
DerivedfromDEM SRTM |
Raster |
Raster (GIF) |
|
Hillshade |
Derivedfrom DEM |
Raster |
Raster (GIF) |
|
Excluded |
Belezma parc data |
Raster |
Raster (GIF) |
Table 1. Data requirements for the model
Source: Table by author.
Figure 2. Data and steps for modeling by SLEUTH
Source: Chart by author.

Figure 3. Prepared data for calibration a,b,c,d) Urban layers; e) hillshade layer; f) excluded layer; g, h) roads layer; i, j) landuse layers. All layers are in grayscale mapping.

a) Urban 1986 |

b) Urban 2000 |

d) Urban 2020 |
c) Urban 2011 |

d) Hillshade |

e) Slope |

f) Excluded |

g) Roads 2011 |

h) Roads 2020 |

i) Landuse 2011 |
|
Index |
Description |
|
Compare |
Comparison of the modeled final urban extent tothe real final urban extent |
|
r2 Population |
The least square regression score of modeled urbanization compared with actual urbanization for control years. |
|
Edge r2 |
Least square regression score of modeled urban edge count compared with actual urban edge count for control years. |
|
R2 cluster |
The least square regression score of modeled urban clustering compared with known urban clustering for control years |
|
Leesalee |
A shape index, a measurement of spatial fit between the modeled growth and the known urban extent for control years |
|
Averageslope r2 |
Least square regression of average slop of known urban cells for control years |
|
% Urban |
The percent of available pixels urbanized during simulation compared to the actual urbanized pixels for each control year |
|
X_r2 |
Center of gravity [x]: Least square regression of average x values for modeled urbanized cells compared with average x values of known urban cells for control years |
|
Y_r2 |
Center of gravity [y]: Least square regression of average y values for modeled urbanized cells compared with average y values of known urban cells for control years |
|
Radius |
The average radius of the circle that encloses the simulated urban pixels compared to the actual urban pixels for each control year |
Table 2. Indices for evaluation of the calibration results in the SLEUTH modeling (Silva, 2002).
Source: Table by author.
Table 3. Top three scores of coarse, fine and final calibration according LeeSallee metric
Source: Table by author.
|
Diff |
Brd |
Sprd |
Slp |
RG |
Diff |
Brd |
Sprd |
Slp |
RG |
Diff |
Brd |
Sprd |
Slp |
RG |
|
1 |
1 |
25 |
1 |
100 |
1 |
20 |
45 |
25 |
1 |
1 |
18 |
50 |
20 |
17 |
|
1 |
1 |
25 |
1 |
50 |
1 |
20 |
45 |
25 |
10 |
1 |
18 |
50 |
20 |
1 |
|
1 |
1 |
50 |
25 |
75 |
1 |
20 |
45 |
25 |
20 |
1 |
18 |
50 |
20 |
5 |
|
Top three rankings of coarse calibration |
Top three rankings of fine calibration |
Top three rankings of final calibration |
||||||||||||
|
diffus |
Breed |
spread |
slp_res |
rd_grav |
|
6.72 |
67.19 |
26.88 |
1.00 |
20.04 |
|
7 |
67 |
27 |
1 |
20 |
Table 4. Selected values for prediction mode
Source: Table by author.

a) |

b) |

c) |

d) |

e) |

f) |
Figure 4. Growth urban results for prediction mode: a) Cumulative grayscale map of maximum urban probability (90 to 100 percent) at stop date 2072; b,c,d,e,f) urban growth propability map of years 2020, 2030, 2050, 2060 and 2072.
Source: Renders by author.
|
Low probability color |
Upper probability color |
Hexadecimal color value |
Color name |
|
0 |
1 |
|
transparent |
|
1 |
30 |
0X00ff33 |
green |
|
30 |
70 |
0X006666 |
blue |
|
70 |
80 |
0Xff7F00 |
dark orange |
|
80 |
90 |
0Xff3E96 |
violetred |
|
90 |
100 |
0Xff0033 |
dark red |
Table 5. Ranges values of urban growth color
Source: Table by author.
Figure 5. Evolution of a) population, b) Built-up area, c) percentage urbanized area and d) population density
Source: Graphs by author
|
|
|
|
|
|


Referencias
Atik, M. A., Abdelkader; Nedjai, Rachid; Belal, Belkacem. (2020). Modélisation prédictive de l’étalement urbain des grandes métropoles du bassin méditerranéen sur l’espace agricole: application au secteur oriental de l’agglomération algéroise (algérie). Analele Universitatii Bucuresti: Geografie/Annals of the University of Bucharest – Geography Series, 69(1), 117–138. http://dx.doi.org/10.5719/aub-g/69.1/7
Bellal, T. (2009). Housing supply in Algeria: affordability matters rather than availability. Theoretical and Empirical Researches in Urban Management, 4(3(12)), 97-114. https://EconPapers.repec.org/RePEc:rom:terumm:v:4:y:2009:i:12:p:97-114
Bhatta, B. (2010). Analysis of Urban Growth and Sprawl from Remote Sensing Data. Springer. DOI: https://doi.org/10.1007/978-3-642-05299-6
Caglioni, M. P., Mattia;Rabino, Giovanni A. (2006, 2006//). Urban Sprawl: A Case Study for Project Gigalopolis Using SLEUTH Model. Cellular Automata, Berlin, Heidelberg. DOI: https://doi.org/10.1007/11861201_51
Candau, J. R., Steen; Clarke, Keith C. (2000). A coupled cellular automaton model for land use/land cover dynamics. 4th International conference on integrating gis and environmental modeling (GIS/EM4).
Chaudhuri, G. C., Keith. (2013). The SLEUTH Land Use Change Model: A Review. Environmental Resources Research, 1(1), 88-105. https://doi.org/10.22069/ijerr.2013.1688
Clarke, K. C. (2004). The Limits of Simplicity: Toward GeoComputational Honesty in Urban Modeling. In GeoDynamics. https://doi.org/10.1201/9781420038101
Clarke, K. C. (2018). A Short Presentation of SLEUTH. In M. T. Camacho Olmedo, M. Paegelow, J.-F. Mas, & F. Escobar (Eds.), Geomatic Approaches for Modeling Land Change Scenarios (pp. 521-525). Springer International Publishing. https://doi.org/10.1007/978-3-319-60801-3_39
Clarke, K. C. G., Leonard J. (1998). Loose-coupling a cellular automaton model and GIS: long-term urban growth prediction for San Francisco and Washington/Baltimore. International Journal of Geographical Information Science, 12(7), 699-714. https://doi.org/10.1080/136588198241617
Clarke, K. C. H., S.;Gaydos, L. (1997). A Self-Modifying Cellular Automaton Model of Historical Urbanization in the San Francisco Bay Area. Environment and Planning B: Planning and Design, 24(2), 247-261. https://doi.org/10.1068/b240247
Dietzel, C. C., Keith C. (2004). Replication of spatio-temporal land use patterns at three levels of aggregation by an urban cellular automata. International conference on cellular automata. DOI: https://doi.org/10.1007/978-3-540-30479-1_54
Drakakis-Smith, D. (1995). Third World Cities: Sustainable Urban Development, 1. Urban Studies, 32(4-5), 659-677. https://doi.org/10.1080/00420989550012825
Fouad, L. S., Mazouz; Abdelbasset, Laroui; Okba, Benameur. (2021). Introducing Urban Growth Models (UGM) in the Algerian Urban Planning Practice: Advantages and Drawbacks. In R. Rahbarianyazd (Ed.), Contemporary Approaches in Urbanism and Heritage Studies. Cinius Yayınları Publication. https://doi.org/DOI: 10.38027/N11ICCAUA2021272
Guechi, I. G., Halima; Alkama, Djamel. (2021). Relationship between LULC characteristic and LST using remote sensing and GIS, case study Guelma (Algeria). Romanian Journal of Geography/Revue Roumaine de Géographie, 65(2). http://www.rjgeo.ro/issues/revue%20roumaine%2065_2/guechi%20et%20al..pdf
Hind, M., M’hammed, S., Djamal, A., & Zoubida, N. (2022). Assessment of land use–land cover changes using GIS, remote sensing, and CA–Markov model: a case study of Algiers, Algeria. Applied Geomatics, 14(4), 811-825. https://doi.org/10.1007/s12518-022-00472-w
Jat, M. K. G., P. K.;Khare, Deepak. (2008). Monitoring and modelling of urban sprawl using remote sensing and GIS techniques. International Journal of Applied Earth Observation and Geoinformation, 10(1), 26-43. https://doi.org/https://doi.org/10.1016/j.jag.2007.04.002
Nations, U. (2019). World Urbanization. Prospects: The 2018 Revision (978-92-1-148319-2). https://population.un.org/wup/publications/Files/WUP2018-Report.pdf
Peiser, R. (2001). Decomposing urban sprawl. Town planning review, 72(3), 275-299. https://www.jstor.org/stable/40112455 DOI: https://doi.org/10.3828/tpr.2001.72.3.275
Rabehi, W., Guerfi, M., Mahi, H., & Rojas-Garcia, E. (2019). Spatiotemporal Monitoring of Coastal Urbanization Dynamics: Case Study of Algiers’ Bay, Algeria. Journal of the Indian Society of Remote Sensing, 47(11), 1917-1936. https://doi.org/10.1007/s12524-019-01037-y
Shi, W., Goodchild; M. F., Batty; M., Kwan; M.-P., & Zhang, A. (2021). Urban Informatics. Springer Singapore. https://doi.org/10.1007/978-981-15-8983-6
Shi, W., & Zhang, A. (2021). Introduction to Urban Computing. In W. Shi, M. F. Goodchild, M. Batty, M.-P. Kwan, & A. Zhang (Eds.), Urban Informatics (pp. 723-726). Springer Singapore. https://doi.org/10.1007/978-981-15-8983-6_39
Silva, E. A. C., K. C. (2002). Calibration of the SLEUTH urban growth model for Lisbon and Porto, Portugal. Computers, Environment and Urban Systems, 26(6), 525-552. https://doi.org/https://doi.org/10.1016/S0198-9715(01)00014-X
Statistiques, O. N. d. (2012). 5ème recensement général de la population et de l’habitat (RGPH), tableau récapitulatif communal, Commune de Batna.
Sudhira, H. S. R., T. V.; Jagadish, K. S. (2004). Urban sprawl: metrics, dynamics and modelling using GIS. International Journal of Applied Earth Observation and Geoinformation, 5(1), 29-39. https://doi.org/https://doi.org/10.1016/j.jag.2003.08.002
territoire, M. d. l. é. e. d. l. a. d. (1992). Demain l’Algérie: Etat du territoire, la reconquête du territoire.
Cómo citar
APA
ACM
ACS
ABNT
Chicago
Harvard
IEEE
MLA
Turabian
Vancouver
Descargar cita
CrossRef Cited-by
1. Hafida Tebbi, Hadda Dridi, Abdelmadjid Bouder. (2025). Analytic hierarchy process vs. machine learning: Mapping school suitability in Batna city, Algeria with spatial analysis. Glasnik Srpskog geografskog drustva, 105(2), p.23. https://doi.org/10.2298/GSGD2502023T.
Dimensions
PlumX
Visitas a la página del resumen del artículo
Descargas
Licencia

Esta obra está bajo una licencia internacional Creative Commons Atribución 4.0.
El contenido y las opiniones incluidas en los trabajos publicados por Bitácora Urbano\Territorialson de responsabilidad exclusiva de sus autores para todos los efectos, y no comprometen necesariamente el punto de vista de la Revista. Cualquier restricción legal que afecte los trabajos y su contenido (escrito y/o gráfico) es responsabilidad exclusiva de quienes los firman.Bitácora Urbano\Territorial se reserva el derecho de realizar modificaciones al contenido escrito y/o gráfico de los trabajos que se van a publicar, a fin de adaptarlos específicamente a requerimientos de edición.
Bitácora Urbano\Territorial está publicada bajo Licencia de Atribución de Bienes Comunes Creativos (CC) 4.0 de Creative Commons. El envío de colaboraciones a Bitácora Urbano\Territorial implica que los autores conocen y adhieren a las condiciones establecidas en esa licencia.