Published
Trend analysis to determine hazards related to climate change in the Andean agricultural areas of Cundinamarca and Boyacá
Downloads
Recognizing the threat from climate change that is facing and will face agro ecosystems is the first step in determining adaptation to climate change. One way is through Global Climate Models (GCMs), but their spatial resolution is not best suited for making decisions locally, further reducing scale, seen as a way to resolve the resolution problem, has not yielded the expected results. This study puts forth an exercise in which we study the climatic time series of precipitation and temperature to determine if there are effects of climate change on one of the most important national agricultural areas, using the Mann-Kendall analysis to determine the existence of statistically significant trends, i.e. signs of change in the variables analyzed. It was found that the variable that presents the most significant trends is the average maximum temperature, while precipitation and average minimum temperature do not.
SOILS, PLANT NUTRITION & WATER MANAGEMENT
Trend analysis to determine hazards related to climate change in the Andean agricultural areas of Cundinamarca and Boyacá
Análisis de tendencias para determinar amenazas relacionadas con el cambio del clima en zonas agrícolas altoandinas de Cundinamarca y Boyacá
Andrés J. Peña Q.1, Blanca A. Arce B.2, J. Francisco Boshell V.3,6,María J. Paternina Q.4, Miguel A. Ayarza M. 5 and Edwin O. Rojas B.5
1Agroclimatalogy, Centro Nacional de Investigaciones de Café Cenicafé. Chinchiná (Colombia).2Grazing and Forage Network, Tibaitatá Research Center, Corporación Colombiana de Investigación Agropecuaria (Corpoica). Mosquera (Colombia).
3Department of Agronomy, Faculty of Agronomy, Universidad Nacional de Colombia, Bogota (Colombia).
4Applied Stastistics. Fundación Universitaria Los Libertadores. Bogota (Colombia).
5Climate Change and Agriculture Network, Tibaitatá Research Center, Corporación Colombiana de Investigación Agropecuaria (Corpoica). Mosquera (Colombia).
6Corresponding author. jfboshellv@unal.edu.co Recceived for publication: 31 August, 2010. Accepted for publication: 2 June, 2011.
ABSTRACT
Recognizing the threat from climate change that is facing and will face agroecosystems is the first step in determining adaptation to climate change. One way is through Global Climate Models (GCMs), but their spatial resolution is not best suited for making decisions locally, further reducing scale, seen as a way to resolve the resolution problem, has not yielded the expected results. This study puts forth an exercise in which we study the climatic time series of precipitation and temperature to determine if there are effects of climate change on one of the most important national agricultural areas, using the Mann-Kendall analysis to determine the existence of statistically significant trends, i.e. signs of change in the variables analyzed. It was found that the variable that presents the most significant trends is the average maximum temperature, while precipitation and average minimum temperature do not.
Key words: mathematical models, climate observations, temperature, mountain farming.
RESUMEN
Reconocer la amenaza climática a la que se enfrentan y se enfrentaran los agroecosistemas es el primer paso para determinar las medidas de adaptación frente al cambio climático. Una forma de hacerlo es a través de los Modelos Climáticos Globales (MCG), sin embargo la resolución espacial de éstos no es la más indicada para tomar decisiones a escala local; además, la reducción de escala, vista como una forma de mejorar el problema de resolución, no ha dado los resultados esperados. Se plantea un ejercicio en el que se estudian las series de tiempo climáticas de precipitación y temperatura para determinar si hay efectos del cambio climático en una de las zonas agropecuarias de mayor importancia a nivel nacional. Se plantea el análisis de Mann-Kendall para determinar la existencia de tendencias estadísticamente significativas, es decir señales de cambio en las variables analizadas. Se encontró que la variable que presenta tendencias más significativas es la temperatura máxima media, mientras que la precipitación y la temperatura mínima media no.
Palabras clave: modelos matemáticos, observaciones del clima, temperatura, agricultura de montaña.
Introduction
According to the IPCC (2007), climate change is the variation (statistically significant) in average climatic conditions or in its variability over an extended period, typically decades or longer. Dry seasons becoming more frequent, higher temperatures than usual, very short rainy season in previous dry periods, droughts, floods, among other consequences, attributed to climate change, are considered the main threat to human development in our generation (UNDP, 2007). In addition to natural climate change, related to changes in obliquity, eccentricity and precession (Hays et al., 1976; Imbrie et al., 1984; Herbert and Fischer, 1986), more frequent cyclical phenomena (Pavia et al., 2009) and changes in vegetation cover (McGregor and Nieuwolt, 1998), the emission of greenhouse gases (GHGs), the product of human economic activity and its accumulation in the atmosphere have increased the radiative force (IPCC, 2007) impacting the current climate.
Furthermore, as the atmosphere has no limits or southern zone, GHGs are significant, determinative factors for the global climate and its effects can be modeled at the global level through Global Climate Models (GCMs), which can generate future climate scenarios, based on previously determined emission scenarios (IPCC, 1997). However, their low resolution (Molina et al., 2000) combined with methodological and operational difficulties arising from the reduction of scale (and statistics) has led to a need for assessing the presence of trends within the time series of climatic variables to understand what is happening locally and determine the level of threat and future climate risk. This work takes into account the following five aspects: 1) current climate (2001-2008) measured at some stations located in the Colombian Andes is different to past climae (1970-1980) and the changes could modify the irrigation ... 2010), or accelerate life cycles of poikilothermic organisms, such as insects, weeds and crops, or determine cultivated species altitudinal migration in response to the search for optimal soil and climate (Jarvis and Ramirez, 2009).
2) Because the study area is a region of horticultural and livestock (dairy) importance (Madrid, 2006; ITC, 2009), the effect of climate change on the highlands of Cundinamarca and Boyacá can affect the country's food security. 3) The MCG have very low resolution and therefore do not detect local variations and/or the regional level. 4) Adaptation strategies to climate change should be prioritized by areas and production systems at regional and local levels. 5) It is important and necessary to review the time series of regional-scale climate variables to determine any trends in them. Those areas that recorded the most significant trends represent a major threat to agricultural production activities; therefore, there should be prioritized actions and strategies of adaptation. It is worth noting that, although in this paper we propose a qualitative scenario, as the product of an empirical (statistical) analysis, this does not ensure a reduction in uncertainty regarding the MCG, but because local settings are an important factor for decision makers (Alcamo et al., 2006) and can improve the identification of adaptation measures against these threats primarily by farmers.
Materials and methods
Study area
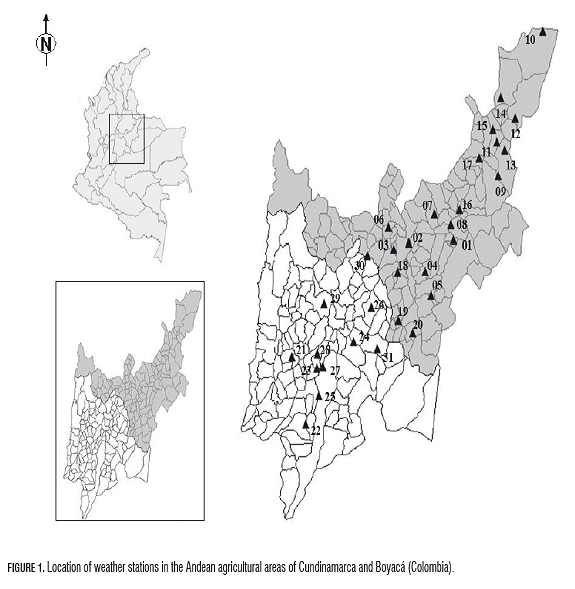
We analyzed the time series of the weather elements measured at weather stations located in the Cordillera Oriental, in the departments of Cundinamarca and Boyaca ( Fig.1 ). Most of these are in the highlands of Cundinamarca and Boyaca, which comprises a set of high-altitude basins, along with the upper parts of the rivers Chicamocha, Bogota and Suarez (Valencia, 2002). The plateau of this area is comprised of a set of mesas that are located between 2,500 and 2,600 m a.s.l., surrounded by mountains up to 4,000 m. Climatically, it is considered a dry island, compared with its surroundings; the precipitation has a strong spatial variation, since the annual rainfall ranges from 600 to 1,500 mm. The temperatures are determined by the height above sea level (Valencia, 2002).
In this region, intra-annual temporal variation in precipitation and temperature is marked by the double pass of intertropical convergence zone (ITCZ). The first three months of the year are dry (January-March), forming the first dry season of the year (FDSY), the three subsequent months are rainy (April-June), especially in April and May, the first rainy season of the year (FRSY). July, August and September are dry, but in September, depending on the area can be characterized as a transitional month and comprise the second dry season of the year (SDSY), whereas the last three months of the year are rainy and form the second rainy season (SRS) (Boshell, 2009). According to Boshell, during the SDSY and FDSY average temperature tends to decrease as the result of radiative loss, associated with clear skies at night, while in the FRSY and SRS it tends to increase for the opposite reason.
Climatic time series
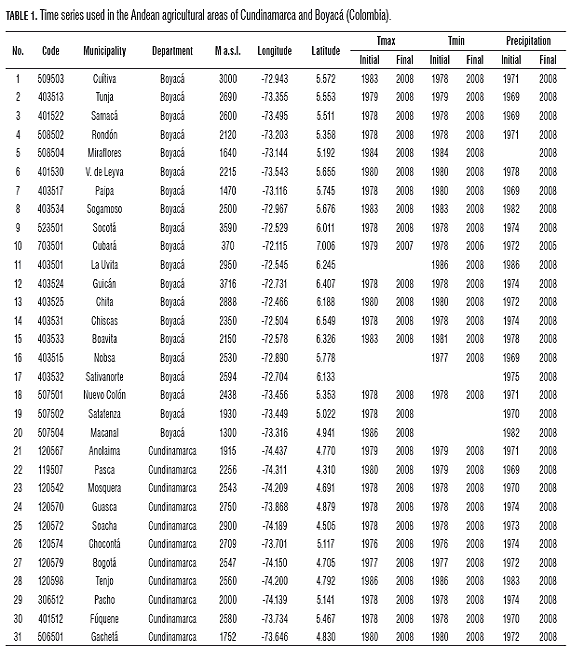
Information for average annual maximum temperature (Tmax) and minimum temperature (Tmin) and the cumulative annual rainfall (Prec) was used from 31 meteorological stations located in the Andean highlands in the departments of Cundinamarca and Boyacá, for a total of 87 time series (Tab.1), with a minimum length of 23 years. Each variable was analyzed on a multi-year time scale, for which annual series were satisfi ed with the average values (temperatures) and cumulative values (rain) for each season (FDSY, FRSY, SDSY, SRS).
Trend analysis
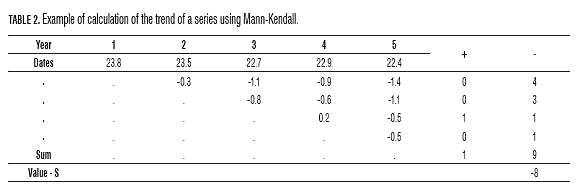
For the analysis we used the Mann Kendall nonparametric test that is considered one of the most robust for determining the existence of seasonal trends in series (Hamed, 2008) of length equal to or greater than 10 data, even with missing data (Buff oni et al., 1999). According to Hamed (2008), test results may be erroneous in auto-correlated series, so this study uses annual data and multi-annual seasons. Th e statistical basis of this test was proposed by Mann in 1945 and as the null hypothesis (H0) proposes that the data series come from a population where the measurements are independent and identically distributed (Hipel and McLeod, 2005). The alternative hypothesis (H1) is that the data follow a trend, "monotonic" in time. Given H0, the Mann-Kendall statistic (S) is:

While, j and k are two positions in the time series, where j
is antecedent of k for any following position, satisfying
j
Results
Average maximum temperature (Tmax)
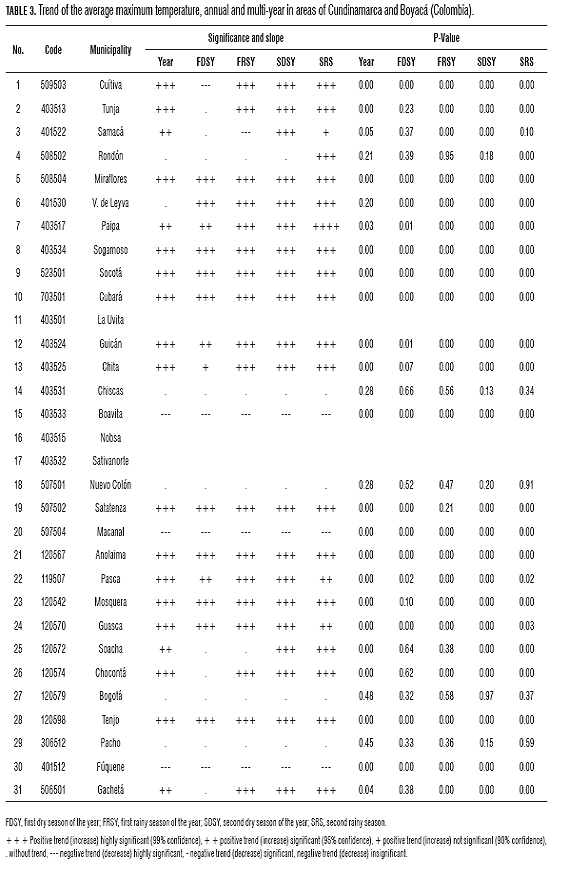
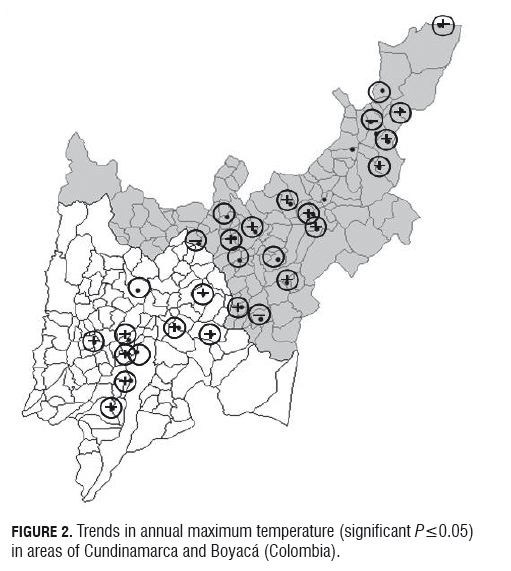
Most Tmax annual series have a positive trend (Fig.2), specifi cally, with 95% confi dence we can say that over 65% of these have a positive trend, with 99% confi dence we can say that 55% of the 28 series have an incremental tendency. About 20% of the annual series analyzed had no trend, while only 10% of the series under analysis have a negative trend (99% confidence) (Tab.3). In this study, unlike that found by Pavia et al. (2009) in Mexico, usually when there is a significant trend in the annual values of mean maximum temperature, there is a tendency in the same direction (same direction of the slope) and similar degree of significance in the multi-year series of seasons, i.e. if the annual Tmax values are highly significant negative trends, it is expected that each year, each of the seasons weather (FDSY, FRSY, SDSY, SRS) will have lower Tmax values. In turn, when there is no significant trend in the annual series of the climate element, multi-year trends in the seasonal series are not expected (Tab.3).
Average minimum temperature (Tmin)
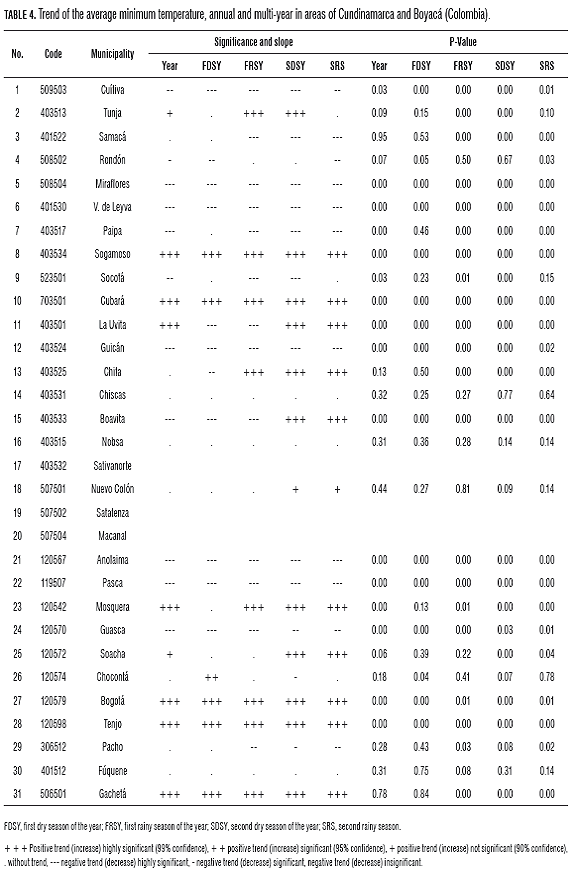
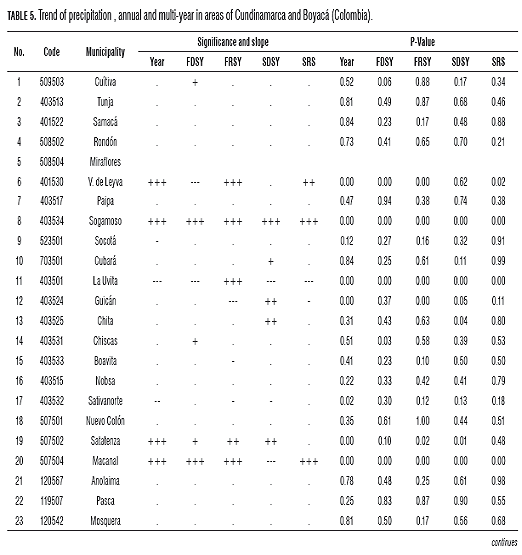
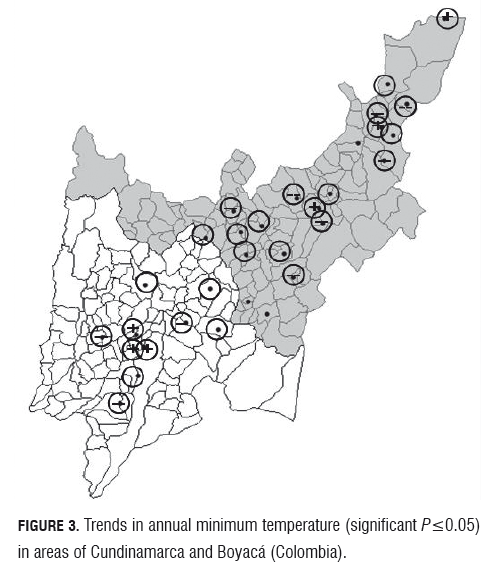
Unlike what happens with the Tmax, this variable is not as widespread on the behavior of the trend (Tab.4, Fig.3), 28% of the annual series of Tmin under analysis have a significant positive trend (90% confidence) 32% do not have any trend and about 40% a decremental tend (90% confidence). The temporal multi-year behavior is equal to T max. Accumulated precipitation (Prec) Over 70% of the analyzed seasons have no trend in annual rainfall accumulated values, however, 29% have a tendency with some degree of significance, predominantly positive (20%), i.e. sites in which each year it is raining more, as reported by Peña et al. (2010) for the station of El Espinal, located in the Magdalena valley, meanwhile in a few stations there tends to be less rain (Tab.5 and Fig.4). The temporal behavior of rainfall is similar to the annual scale, which means that if there are trends in annual rainfall values, neither in the series will have multi-year periods (Tab.5).

Discussion
Temperatures (Tmax and Tmin)
According to the outputs of the GCMs (IPCC, 2007), in the region which is located in the study area, the main effect of climate change is the increase of temperature. The trends analyzed in this study show a general increase in Tmax, but not in Tmin, because the latter is less sensitive to the overall effect and long term is more related to local conditions and daily cycles. At the station in the municipality of Bogota (27), annual mean maximum temperatures showed no trend, but a significant increase in the average minimum temperature from year to year is seen, which could be linked to the increased presence of gases like CO2 in the layer closest to the ground, reducing terrestrial radiation (IR) that escapes at night to the upper layers of the atmosphere and thus generates increases in temperature at night. As raised by Yunling and Yiping (2005), climate change has regional peculiarities that are not consistent with the patterns found on a global scale, especially in mountainous regions, where the topography means greater influence of local circulation. In fact, as found by Pavia et al. (2009) in Mexico, very few stations show significant increases in both temperature variables analyzed, which does not mean that this area is outside the global warming effect, but that the threats must be detected locally. For example, if the GCMs were used to identify the threats of climate change on economic activities in the region, one would think that frost would not be a problem for crops grown in the highlands of Cundinamarca and Boyaca, when indeed, in some places, the decremental trend of Tmin may result in a higher incidence of frost, causing great losses to farmers.
Although some stations have a trend in which Tmax is positive and Tmin is negative, this should not be confused with a compensatory effect to indicate that the average temperature is not growing. The methodology used in this study determined the threat in a qualitative way, using a nonparametric statistical analysis that determines the existence of trends, so that in these localities, the threat is determined by a higher probability of occurrence of frost at higher altitudes a general increase in evaporation and insect pests, an increase in the number of cohorts (egg-adult cycle) by increasing daytime temperatures. On the other hand, although several authors have determined that these effects (Tmax increasing and Tmin decreasing) are related to deforestation and land use change (Gross, 1987; Gash et al., 1996; Giambelluca, 1996; McGregor and Nieuwolt, 1998; Adams, 2007), they cannot be attributed solely to this factor, to determine the change, you must think about the wider effect of increasing greenhouse gases in the atmosphere and climate variability over long and medium periods (Tourre et al., 2001; Pavia et al., 2009).
Precipitation
Most series analyzed showed no rain trend, possibly because in mountainous regions, precipitation is a local type phenomenon, related to circulation systems on a scale of a few kilometers, catalyzed by processes on a larger scale (Montoya and Palomino, 2005), where the main factor involved in rainfall-genesis is the terrain, so the phenomena in these regions induces variability and climate change appears to have less effect than on sites free of the orographic effect (Peña, 2000).
The stations that show a marked tendency to increased precipitation also show a marked increase in the maximum temperature, however, in those places where positive trends in maximum temperature are found do not always record an incremental annual accumulated rainfall, and which the incremental effect cannot be attributed to increased evaporation and/or evapotranspiration, caused by the increase in maximum temperature. In addition, station 12 (Guice), where there is a tendency to reduce the amount of annual rainfall, a highly significant increase in Tmax is also present. These results are consistent with those reported by Poveda et al. (1998), who noted that even without significant changes in precipitation amounts; the changes that occur in the temperature can affect the water balance. In this regard, Peña et al. (2008) found that in the high plains of Colombia, the response of field water to possible climate change depended on the type of soil, showing the importance of the local approach when defining measures for adaptation to climate change.
Conclusions
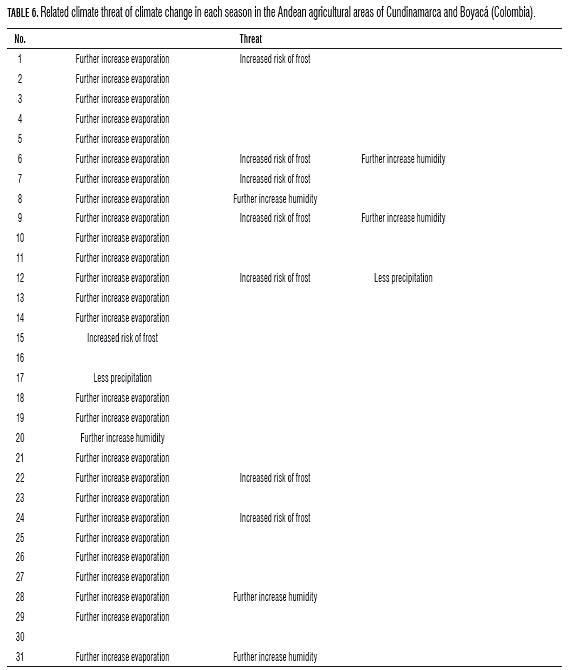
There is a widespread climate threat in the Andean highlands of Cundinamarca and Boyaca, and in most stations evaporative and evapotranspiration rates of crops are expected to increase annually due to increasing T max. In turn, this increase in Tmax is widespread throughout the year, i.e., the effect is not concentrated in some seasons, as in other parts of the world, which could result in an increase in the number of insect cohorts (Tab.6).
Stations with significant trends of increasing Tmax do not necessarily show an increase in Tmin, as opposed to middle and high latitudes, the absolute minimum and average minimum annual temperature in the tropics are more related to the daily cycle, cold nights and warm days, and not with the annual cycle; also local conditions (topography, land cover) have a great influence on minimum temperatures. Several authors have found that increasing the difference between Tmax and Tmin is related to changes in land use, which must be taken into account, not to mention the overall effects. This condition is important in higher areas, because this means that even with a warming, we must continue to anticipate frost affecting crops in the driest seasons of the year.
No significant trend was found in the annual accumulated precipitation data from most stations analyzed. Some stations have an increasing trend, however, it cannot be assured that the cause of this are the increases in evaporation or evapotranspiration, associated with positive trends in the Tmax. Also, there are cases in which the precipitation trend is negative, showing that precipitation is a variable difficult to predict.
Unlike parametric tests for analysis of trends in time series (eg. Regression analysis), whose effect is reduced when the series comes from data with skewed distribution, statistical tests that do not depend on distribution (nonparametric) have the advantage that their effect and significance are not affected by the current distribution of the data.
Cited literature
Adams, J. 2007. Vegetation-climate interaction: how vegetation makes the global environment. Springer Praxis Books in Environmental Sciences, Chichester, UK.
Alcamo, J., K. Kok, G. Busch, J. Priess, B. Eickhout, M. Rounsevell, D. Rothman, and M. Heistermann. 2006. Searching for the future of land: Scenarios from the local to global scale. pp. 137-155. In: Lambin, H.G. (eds). Land-use and land-cover change - Local processes and global impacts. Springer-Verlag, Berlín.
Boshell, F. 2009. Condiciones climáticas generales de las zonas productoras de flores en Colombia. Serie: Manejo del riesgo climático en la floricultura colombiana. Ceniflores, Bogota.
Buffoni, L., M. Maugeri, and T. Nanni. 1999. Precipitation in Italy from 1833 to 1996. Theor. Appl. Climatol. 63, 33-40.
CCI, Corporación Colombia Internacional. 2009. Comportamiento de las verduras y hortalizas durante la última quincena de octubre y la primera quincena de noviembre. Boletín Quincenal Sipsa. 2, 1-8.
Gash, J., C. Nobre, J. Roberts, and R. Victoria. 1996. Amazonian deforestation and climate. John Wiley, Chichester, UK.
Giambelluca, T.W. 1996. Tropical land cover change: characterizing the post-forest land surface. pp. 293-318. In: Giambelluca, A.H. (eds.). Climate change: developing southern hemisphere perspectives. John Wiley, Chichester, UK.
Gross, G. 1987. Some effects of deforestation on nocturnal drainage flow and local climate a numerical study. Boundary-Layer Meteorol. 38, 315-337.
Hamed, K.H. 2008. Trend detection in hydrologic data: the Mann- Kendall trend test under the scaling hypothesis. J. Hydr. 349, 350-363.
Hays, J.D., J. Imbrie, and N.J. Shackleton. 1976. Variations in the Earth's orbit: pacemaker of the Ice Ages. Science 194, 1121- 1132.
Herbert, T.D. and A. Fischer. 1986. Milankovitch climatic origin of mid-Cretaceous black shale rhythms in central Italy. Nature 321, 739-743.
Hipel, K. and A. McLeod. 2005. Time series modelling of water resources and environmental systems. In: http://www.stats. uwo.ca/faculty/aim/1994Book/1994-Time-chapter%2023.pdf; consulted: June, 2011.
Imbrie, J., J.D. Hays, D.G. Martinson, A. McIntyre, A.C. Mix, J.J. Morley, N.G. Pisias, W.L. Prell, and N.J. Shackleton. 1984. The orbital theory of Pleistocene climate: support from a revised chronology of the marine d18 O record. pp. 269-305. In: Berger, A., J. Imbrie, H. Hays, G. Kukla, and B. Saltzman (eds.). Milankovitch and climate: understanding the response to astronomical forcing. Proceedings of the NATO Advanced Research Workshop. Reidl Publishing, Dordrecht, The Netherlands.
IPCC, Intergovernmental Panel on Climate Change. 1997. Introducción a los modelos climáticos simples utilizados en el segundo informe de evaluación del IPCC. Grupo Intergubernamental de Expertos sobre el Cambio Climático, London.
IPCC, Intergovernmental Panel on Climate Change. 2007. Climate change 2007: Impacts, Adaptation and Vulnerability. Cambridge University Press, Cambridge, UK.
Jarvis, A. and J. Ramírez. 2009. Impactos del cambio climático en Colombia: Modelos y métodos. pp. 25-66. In: Memorias Taller: Definición de Herramientas para Enfrentar el Cambio Climático en el Sector Agropecuario. Ministerio de Agricultura y Desarrollo Rural, Bogota.
MADR, Ministerio de Agricultura y Desarrollo Rural. 2006. Unidad de seguimiento de precios de la leche Estadísticas mercado lácteo colombiano, periodo enero junio / 2006. In: http://www.agronet.gov.co/docs_agronet/20061027163948_ INFORME_Leche_ JUNIO.pdf; consulted: June, 2011.
McGregor, G. and S. Nieuwolt. 1998. Tropical climatology. 2nd ed. John Wiley, New York, NY.
Molina, A., N. Bernal, J. Pabón, J. Martínez, and E. Vega. 2000. Reducción de escala estadístico aplicado a datos del CCM3 para generar datos de temperatura del aire en superficie. Meteorol. Colomb. 2, 67-72.
Montoya, G. and R. Palomino. 2005. Sistemas pluviogenéticos en Colombia: influencia de frentes fríos del hemisferio norte. Meteorol. Colomb. 9, 75-82.
Onoz, B. and M. Bayazit. 2003. The power of statistical tests for trend detection. Turkish J. Eng. Env. Sci. 27, 247-251.
Pavia, E., F. Graef, and J. Reyes. 2009. Annual and seasonal surface air temperature trends in Mexico. Intl. J. Climatol. 29, 1324-1329.
Peña, A. 2000. Incidencia de los fenómenos "El Niño" y "La Niña" sobre las condiciones climáticas en el valle del río Cauca. Undergraduate thesis. Faculty of Agricultural Sciences, Universidad Nacional de Colombia, Palmira, Colombia.
Peña, A., Y. Rubiano, and J. Bernal. 2008. Estudio de la variabilidad espacial de la capacidad de retención de humedad del suelo como medida de adaptación al cambio climático. Estudio de caso: Typic Haplustox, Puerto López, Meta (Colombia). In: XIV Congreso de la Sociedad Colombiana de las Ciencias del Suelo, Villavicencio, Colombia.
Peña, A., B. Arce, M. Ayarza, and C. Lascano. 2010. Simulación de los requerimientos hídricos de pasturas en un escenario de cambios climáticos generados con análisis espectral singular. Acta Agron. 59(1), 1-9.
UNDP, United Nations Development Programme. 2007. Informe sobre desarrollo humano 2007/2008: La lucha contra el cambio climático: Solidaridad frente a un mundo dividido. Mundi- Prensa, México.
Poveda, G., C. Perez, O. Mesa, L. Carvajal, and A. Ochoa. 1998. Evidencias de cambio climático en Colombia: Tendencias y cambios de fase y amplitud de los ciclos anual y semianual. Bull. Inst. Fr. Etudes Andines 27(3), 537-546.
R Development Core Team. 2008. R: A language and environment for statistical computing. R Foundation for Statistical Computing, Vienna, Austria.
Tourre, Y., B. Rajagopalan, Y. Kushnir, M. Barlow, and W. White. 2001. Patterns of coherent decadal and interdecadal climate signals in the Pacific Basin during the 20th century. Geoph. Res. Lett. 28, 2069-2072.
Valencia, I.D. 2002. Modelo de hábitat y distribución geográfica de la alondra Eremophila alpestris peregrina en el Altiplano Cundiboyacense, Colombia. Undergraduate thesis. Department of Geography, Universidad Nacional de Colombia. Bogota.
Yunling, H. and Z. Yiping. 2005. Climate Change from 1960 to 2000 in the Lancang River Valley, China. Mount. Res. Dev. 25, 341-348.
How to Cite
APA
ACM
ACS
ABNT
Chicago
Harvard
IEEE
MLA
Turabian
Vancouver
Download Citation
Article abstract page views
Downloads
License
Copyright (c) 2011 Agronomía Colombiana

This work is licensed under a Creative Commons Attribution-NonCommercial-ShareAlike 4.0 International License.
© Centro Editorial de la Facultad de Ciencias Agrarias, Universidad Nacional de Colombia
Reproduction and quotation of material appearing in the journal is authorized provided the following are explicitly indicated: journal name, author(s) name, year, volume, issue and pages of the source. The ideas and observations recorded by the authors are their own and do not necessarily represent the views and policies of the Universidad Nacional de Colombia. Mention of products or commercial firms in the journal does not constitute a recommendation or endorsement on the part of the Universidad Nacional de Colombia; furthermore, the use of such products should comply with the product label recommendations.
The Creative Commons license used by Agronomia Colombiana journal is: Attribution - NonCommercial - ShareAlike (by-nc-sa)

Agronomia Colombiana by Centro Editorial of Facultad de Ciencias Agrarias, Universidad Nacional de Colombia is licensed under a Creative Commons Reconocimiento-NoComercial-CompartirIgual 4.0 Internacional License.
Creado a partir de la obra en http://revistas.unal.edu.co/index.php/agrocol/.