Evaluation of MODIS Land products for air temperature estimations in Colombia
Keywords:
remote sensing, radiometers, multiple regression techniques, climatic seasons, meteorology. (es)Downloads
The moderate resolution imaging spectroradiometer (MODIS) land-surface temperature/emissivity (LST) product is often used for studies in meteorology due to its ability for near realtime evaluations. Colombia, as a country requires a prospective management for its productive ecosystems, but currently does not have sufficient spatially-distributed field data for air temperature at 2-m above the ground. The traditional validation of MODIS products includes field campaigns for calibrating and measuring differences between the satellite sensor and radiometers. For this research, the LST data on the ground was compared with climatologic stations using multiple regression techniques for improving the accuracy of the LST from MODIS, using MOD09GA, MOD17A2, MOD15A2, MOD13A2 as ancillary parameters (explanatory variables) in the final model. The ground measurements were obtained in the Caribbean zone and the Casanare and Valle del Cauca departments in Colombia, using agroclimatic stations in the first dry season of 2007 and daily MODIS data. Enhanced vegetation index, fraction of photosynthetically active radiation, and net photosynthesis were included in the final model for explaining the vegetation as a key parameter for air temperature. Finally, two factors were proposed for LST estimation: sensor zenith angle and solar zenith angle due to the reflectance of the vegetation and sensitivity of the sensor.
SOILS, FERTILIZATION & MANAGEMENT OF WATER
Evaluation of MODIS Land products for air temperature estimations in Colombia
Evaluación de productos MODIS LST para la estimación de temperatura de la superficie en Colombia
Ricardo Castro-Díaz1
1Programa de Investigación en Recursos Naturales y Ambiente (PIRNA ), Instituto de Geografía Romualdo Ardissone, Universidad de Buenos Aires. Buenos Aires (Argentina). ircastrod@unal.edu.coReceived for publication: 1 February, 2012. Accepted for publication: 5 June, 2013.
ABSTRACT
The moderate resolution imaging spectroradiometer (MODIS) land-surface temperature/emissivity (LST ) product is often used for studies in meteorology due to its ability for near realtime evaluations. Colombia, as a country requires a prospective management for its productive ecosystems, but currently does not have sufficient spatially-distributed field data for air temperature at 2-m above the ground. The traditional validation of MODIS products includes field campaigns for calibrating and measuring differences between the satellite sensor and radiometers. For this research, the LST data on the ground was compared with climatologic stations using multiple regression techniques for improving the accuracy of the LST from MODIS, using MOD09GA , MOD17A2, MOD15A2, MOD13A2 as ancillary parameters (explanatory variables) in the final model. The ground measurements were obtained in the Caribbean zone and the Casanare and Valle del Cauca departments in Colombia, using agroclimatic stations in the first dry season of 2007 and daily MODIS data. Enhanced vegetation index, fraction of photosynthetically active radiation, and net photosynthesis were included in the final model for explaining the vegetation as a key parameter for air temperature. Finally, two factors were proposed for LST estimation: sensor zenith angle and solar zenith angle due to the reflectance of the vegetation and sensitivity of the sensor.
Key words: remote sensing, radiometers, multiple regression techniques, climatic seasons, meteorology.
RESUMEN
El producto moderate resolution imaging spectroradiometer (MODIS) land-surface temperature/emissivity (LST ) es a menudo utilizado en estudios meteorológicos para evaluaciones en tiempo cuasireal. Colombia requiere de un manejo prospectivo de sus ecosistemas productivos, sin embargo no existe una alta densidad de mediciones para la temperatura de la superficie (temperatura del aire a 2 m). La validación clásica de los productos MODIS incluye trabajo de campo para la calibración y la medición de las diferencias entre los radiómetros y el sensor MODIS. Para esta investigación, los datos del producto LST de MODIS son comparados con estaciones climatológicas usando técnicas de regresión múltiple para aumentar la exactitud de MODIS LST en conjunto con los productos MOD09GA , MOD17A2, MOD15A2 y MOD13A2 como parámetros auxiliares (variables explicativas) dentro del modelo final. Las mediciones terrestres se realizaron en la zona Caribe, Casanare y Valle del Cauca, usando las estaciones agroclimatológicas en la primera temporada seca de 2007 y los datos MODIS en versión diaria. El índice de vegetación aumentado, la porción de radiación activa fotosintética y la fotosíntesis neta son incluidas en el modelo final como estimadores del parámetro clave para la temperatura del aire: la vegetación. Finalmente dos factores son propuestos para la estimación de la temperatura de la superficie-LST : ángulo cenit del sensor y ángulo cenit del sol, que registran los cambios en la reflectancia de la vegetación y la sensibilidad del sensor.
Palabras clave: teledectección, radiómetros, técnicas de regresión múltiple, estaciones climáticas, meteorología.
Introduction
In recent decades, the advent of satellite technologies has seen rapid growth with a vital development of new methodologies for use by different disciplines. Agronomics are not far behind and have included the utilization of passive and active sensors in precision agriculture (Lamb and Brown, 2001; Moran et al., 1997). Due to this, the research to foster the employment of science-tech, such as Geomatics, in the world has involved different analysis topics, such as crop irrigation (Bastiaanssen et al., 2000), crop protection (Hatfield and Pinter, 1993), net primary production (Field et al., 1995), forestry (Dubayah and Drake, 2000; Franklin, 2001; Peterson et al., 1988) and soil properties (Gillies and Carlson, 1995; Metternicht and Zinck, 2003; Njoku and Entekhabi, 1996; Schmugge, 1985).
The moderate resolution imaging spectroradiometer (MODIS) is an instrument aboard the Terra "EOS AM " and Aqua "EOS PM" satellites. The payloads register geoinformation of the land surface every 1 to 2 d in 36 spectral bands at 250 m (bands 1-2), 500 m (bands 3-7) and 1,000 m (bands 8-36). The MODIS bands are used for different studies on the atmosphere, oceans and earth surface. Meteorological and climate change studies require a huge amount of data for describing natural phenomena such as humidity, vegetation, aerosols, phytoplankton, ocean color and temperature of the atmosphere, oceans, clouds and surface.
Land surface temperature (Westoby et al., 2002) is used as an indicator of the energy balance on the Earth's surface and as a key measurement for understanding environmental physics phenomena of the surface. When using LST and land surface moisture (LSM ), it is possible to find the best water-retention areas through the characteristics of the land cover (Hu et al., 2008). As the temperature changes everywhere on Earth, natural processes such as the Asian Monsoon can be modeled using both LST and moisture heterogeneities (Zeng et al., 2003). Since ground cover causes changes on the surface, it is relatively important to monitor the increasing temperature caused by urban expansion (Morrow and Friedl, 1998). Therefore, the temperature is highly correlated to the vegetation structure and can be modeled using statistics. The impact of sparse vegetation, caused by the expansion of cities, is evident when the vegetation index decreases high temperatures (Amiri et al., 2009). This relationship is clearly given by the normalized difference vegetation index (NDVI) and LST exposed in spatial variability of temperature changes in urban areas (Weng et al., 2004).
The MODIS LST product registers, from bands 31 (10.78- 11.28 µm) and 32 (11.77-12.27 µm), the land surface temperature in an emission range. This product is a sequential construction retrieved from thermal infrared data under clear-sky conditions. The view-angle dependent splitwindow LST algorithm separates the retrieved data and cloud-top temperature, based on the radiation emitted by the land surface observed by the MODIS sensor in the instantaneous viewing angle; this algorithm has been developed for correcting atmosphere and emissivity for several land cover types (Coll and Caselles, 1997; Wan and Dozier, 1996). Most of these land covers have been validated by the MODIS LST group with ground measurements of land-surface temperatures and radiances for 1 km in the nadir direction or larger at the off-nadir direction, over homogeneous sites, including lakes, beaches, snow-covered fields, grasslands and croplands (Wan and Li, 2008; Wan et al., 2004a; Wang et al., 2007; Wang et al., 2005).
The validations have included field campaigns over lake Titicaca (Bolivia) and the USA , using infrared radiometers resulting in situ values larger than 0.5°K (Wan et al., 2002) and scenarios in the USA (Wan, 2008; Wan et al., 2004b) for LST validating over homogeneous areas. The evaluated cases are not significant for countries such as Colombia due to their differences in land cover, land use and overall topographic conditions of Tropical areas. A review of other cases for the MODIS land surface product: the USA (Wang et al., 2008) and Tibet (Liang et al., 2002b; Turner et al., 2006b), indicated the data must be validated before using them, due to displacements.
The surface air temperature is measured at 2 m above the ground at weather stations; however, this data includes dependent problems due to infrastructure and distribution. In Colombia, this situation is more of a problem due to the high economic costs and failures of the meteorological network of automated stations. In 2007, this country had only 40 automated weather stations working, highlighting the importance of using remote sensing methods for obtaining the air temperature, as was done during this research. The land surface air temperature data estimations using the special sensor microwave/imager (SSM/I) showed displacements in the global temperature blended data (Peterson et al., 2000), improving the differences below 1°K. Statistical approaches can be used combining a split window algorithm with ground meteorological station observations for predicting the air temperature. For instance, a geostatistical dispersion parameter, such as the Kriging average error (0.9°C), was used with a multiple regression model average error (1.4°C), describing improvements for modeling the air temperature (Florio et al., 2004). MODIS has been evaluated over different ecosystems in Africa (Vancutsem et al., 2010) for the comparison between night LST data with meteorological stations finding a mean absolute error equal to 1.73°C at nighttime. But, when daily data were compared, strong variations according to the seasonality, the ecosystems, the solar radiation, and the cloud-cover were recognized. Both NDVI and solar zenith angle were analyzed to understand their relationship for air temperature estimations based on remote sensing data (Vancutsem et al., 2010).
Estimating the air temperature using land MODIS products is the main purpose for this research, developing a model based on a statistical approach. Modeling the air temperature is a way to understand the temperature changes for the earth and its behavior when spatial agents are involved, such as the condition and presence of the vegetation, and how the data are influenced by emission angles described by sensor zenith angle and solar zenith angle parameters. The validation of the model came from linear regression models (LMR), constituting 90% confidence in the agroclimatic data.
Methods
Site description
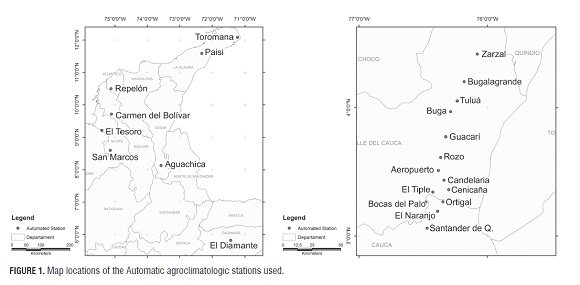
The automated stations (Fig.1) are located in two area types, determined as heterogeneous and homogeneous in Colombia according to the land cover using NDVI as the key parameter for vegetation abundance.
The LST ground measurements were obtained from the air temperature at 2 m above the surface of the automated stations managed by the Colombian Sugarcane Research Center (Cenicaña) and the Environment Studies, Hydrology and Meteorology Institute of Colombia (IDEAM ). The 14 Cenicaña stations cover the Valle del Cauca department throughout the high basin of the Cauca river in the main sugarcane agroindustry of the country. The 8 IDEAM stations are located throughout the Colombian Caribbean region and a humid province. These weather stations are for climatology studies and have the same sensor as the Cenicaña stations for temperature measurements.
For the agrometeorological stations of Cenicaña, sugarcane crops are mainly used, and the IDEAM stations are located in bare soils, grasslands, farm crops or urban areas. Although heterogeneity depends on spatial scale, spatial resolution, land cover, soil moisture, leaf area and topography (El Maayar and Chen, 2006), no particular station can be highlighted because there is no considerable difference between forest LST and field LST (Dash et al., 2002). Taking into account the scaling requirements (i.e. all the processes to achieve the representative area when two or more data are put together, the MODIS spatial resolution of 1 km2 and the meteorological data of one point in the ground were reconciled by using the same representative area as the minimum scale, meaning that, for one MODIS pixel, an agrometeorological station was registered.
MODIS products
These products are available from the Reverb ECHO System (NASA , 2007) (formerly known as the WIST ECHO Portal), for free and processing analysis and should be transformed from Sinusoidal projection to WGS 84 using geolocation files entered into the MRTS wath software (NASA , 2011). A statistical procedure is necessary for eliminating any noise in numeric data because of errors in primary granule, principally.
The MODIS products (Tab.1) used in modeling LST in Colombia were analyzed layer per layer and all sampled data were stored in a database for comparison to ground measurements. The principal MODIS product for the LST model was MOD11-land surface temperature/emissivity 5-min version 5, used at Level 2 and a spatial resolution of 1 km under clear-sky conditions. Ancillary MODIS products, such as MOD09GA, MOD17A2, MOD15A2 and MOD13A2, were used for linear model regression for including vegetation condition and presence and surface reflectance features (for other uses of these products in this topic, some literature is suggested (Cohen et al., 2003; Liang et al., 2002a; Savtchenko et al., 2004; Turner et al., 2006a). The selected MODIS products have daily, 8-d or 16-d time resolution; this is not an obstacle for modeling because 8-d and 16-d products provide vegetation information that will not change for the small timeline; even when land cover alterations might take place, they are represented in the final values.
Results and discussion
An effective use of the satellite data lies in the reduction of the errors and variability that are included in the same method of remote sensing. This means that in the reason for measuring a parameter, several differences with the traditional sensors are made clear. In this case, the best solution is to validate the satellite data and compare them with traditional data, looking for differences with linear regression.
For this study, the differences between both data were called displacements, indicating that two main ranges were crucial for understanding the behavior of the remote sensing data (MODIS- LST ) compared with the meteorological data (LST ).
A pattern appeared, describing an underestimation made by MODIS LST until 24°C and an overestimation from 28°C (Fig.2) of the 600 registers.
The whole set of the displacement data was analyzed using linear regression to find the best estimation using a statistic descriptor, such as average or median. This process was necessary due to the fact that most of the contrasted data between the MODIS-LST values and meteorological values require a proper comparison point in time (i.e. a satellite value such as 16°C cannot be compared to 15, 13 and 23°C at the same time), so it was necessary to obtain an unique value for the contrast.
The displacements were analyzed through the ancillary products (i.e. MODIS product layers), using statistical results in a maximum model, eliminating non-relevant parameters in the final model through the backward process (Myers, 1990; Yuan and Lin, 2006). The backward process involves building a big maximum model according to individual F-partial, coefficients change percentage and Akaike and Bayessian information criteria. For this research, eleven models were used to get the best fitting, deleting those parameters with collinearity issues, evaluated through a variance inflation factors description (VIF) (Tab.2).
The statistical confidence of this final model was evaluated using cross-correlation coefficient validation (Samper and Neuman, 1989; Wheeler and Tiefelsdorf, 2005). This analysis procedure subtracts the R-fitter coefficient from the two-grouped data and, if the value is next to zero, it is considered a high confidence model (Kleibaum, 2007).
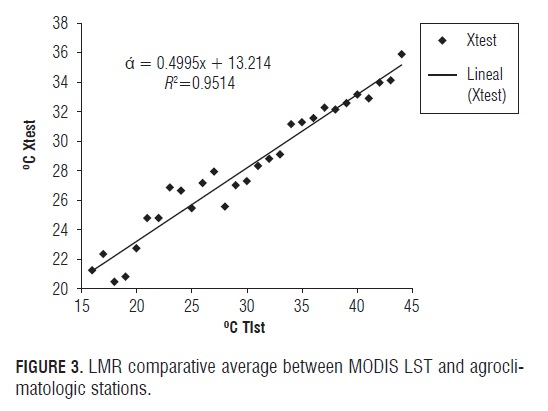
A long database was structured; the model was mostly representative for the dry season and showed low accuracy for the rainy season. This can be solved using other parameters, such as air humidity, undetected subpixel clouds, soil moisture or subpixel artificial infrastructure in the final model. Another relevant issue is represented by the type of information derived from the satellite compared to weather station data because hour measurements by stations may not represent the LST when the satellite passes over, even when the time issue was analyzed for best fitting. Finally, the scale matching problems arose from the comparison of the 1km spatial resolution of the satellite with a station value at a discrete point in the field. Agroclimatologic stations and MODIS-LST were compared describing a pattern as shown in Fig.1. The displacement was modeled using the comparative median-CM from the linear regression for best fitting between the average (Fig.3) and median (Fig.4); the latter reduced overestimations and underestimations (Tab.3) and was added to the maximum model for testing.
In the evaluation of the MODIS subproducts, a layer per layer test was carried out for theMOD11, MOD09GA, MOD17A2, MOD15A2 and MOD13A2 products, and it showed a high correlation between CM, MODIS-LST , PSNN ET, RR and LST (Tab.4), using two statistical filters: a) test dates; and, b) total data, applied for eliminating any noise (of the measurements) from the atypical data. After the high correlation coefficient test, five LMR were selected (a, b, c, d, and, e) and were validated over the test dates. Their results are shown in Tab.5.
LST, is the station temperature
Mod.LST, is LST MODIS temperature
a = LST + CM
b = LST + CM + SZ (adding MOD09GA)
c = LST + CM + FPAR + SZ (adding MOD17A2)
d= LST + CM + LAI + FPAR + SZ (adding MOD15A2)
e= LST + CM + FPAR + LAI + ZS + EVI + SZA (adding MOD13A2)
The last tests helped to find statistical and theoretical associations from the LST with MODIS LST , CM, SZ, FPAR, LAI, RR, SZA, EVI and NDVI layers for the maximum model.
The backward process describes the explaining parameters in e: comparatives medians, EVI, FPAR, LST , PSNN ET, sensor zenith angle and solar zenith angles. It helped to avoid collinearity issues as shown in Tab.7 (as shown in Tab.2) where FPAR is over 10, which means it is explained by LAI and PSNN ET (Tab.6).
Then, a maximum model was built and the backward process was applied. For this model, the selected variables, as in the final model, were CM, EVI, FPAR, MODIS LST , PSNN ET, SZ and SZA. In this case, a validation based on CCCV was held and it demonstrated a high confidence when R-fitted first group (0.88) and R-fitted second group (0.92) were subtracted, resulting in a 0.06 coefficient according to Kleinbaum and Nizam (2007). This means that the collinearity issues, associated with overweighed variables in the model, were successfully separated from the final model, obtaining the advantage of the parsimony principle (Raykov and Marcoulides, 1999; Stoica and Söderström, 1982).
Time issues: detecting the best hour for comparing MODIS LST and LST data A comparison method for stations and satellite data per hour was evaluated for estimations from the MODIS LST in three moments; the selection way was based on the MODIS scene corresponding to an approximation of an hour, meaning that, if the scene was taken at 18:25:00 UT C-5 h, the station data for comparison is 19:00:00 UT C-5 (moment 1), 18:00:00 UT C -5 (moment 2) or a near rounded approximation (moment 3).
The results are included in Tab.7, showing less bias when the MODIS LST data (600) were rounded to the next hour (moment 1) of the weather station measurement.
View angle dependence
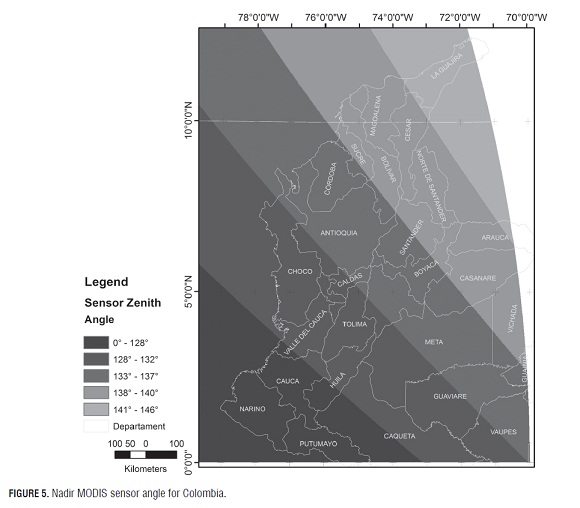
View angle dependence was included in the final model using sensor zenith angle (a MOD09GA layer) and solar zenith angle (a MOD13A2 layer) as parameters in vegetation reflectance; based on studies of angle correlation and emissivity issues in scientific literature (Chuvieco et al., 2005; Gemmell and McDonald, 2000; Gleason et al., 2002; Middleton, 1991; Russell, 2001; Wang et al., 2008). When Çengel (2004) and Noyes (2007) explain most elemental emissivity as a spectral directional phenomenon, they give several guides for observing it as a physics issue. Noyes et al. (2007) explained how emission orientation and sensor view angle are not uniform and the ability to capture data decreases in proportion to the distance from the camera center, adducing the behavior to nominal pixel size contribution in Fig.5.
For colombian territory, this angle dependence decreases in the northern direction. The contribution of emissivity issues to modeling the LST is described by correlation coefficients in Tab.5 and verified in the final model when the backward process is conducted.
Vegetation conditions
LST is a dynamic function from earth, atmosphere and vegetation (Wan, 2008). Since vegetation depends on its environment (Avissar, 1996), it also describes the climatic condition, adding inherent information to satellite data. Gross primary productivity (MOD17A2 layer) is part of the dynamic function because these data are obtained from the given difference by the earth system (Heinsch et al., 2003). This parameter is the total sum of converted energy in plant biomass (Heinsch et al., 2003; Turner et al., 2004).
The leaf area index (a MOD15A2 layer) represents vegetation conditions; it was explained in the final model by FPAR (a MOD15A2 layer) when the collinearity issues were engaged.
The enhance vegetation index (a MOD13A2 layer) includes cloud-shadow, water, and heavy aerosols, such as atmospheric corrections (Lim et al., 2004; McAtee et al., 2001); even when this index is part of the final model, it is not highly correlated to the LST ; it was maintained due to the atmospheric corrections (Xiao et al., 2003) and canopy variations, minimizing sensitivity over dense vegetation (Huete et al., 2002; Huete et al., 1994).
Final model summary
The selected variables using LMR and backward procedure were Mod.LST , SZ, FPAR, PSNN ET, SZA, EVI and comparative median (CM.RR) and LAI were the parameters over fitting the model.
The final model (Tab.8) did not have changes in its behavior when outliers appeared, maintaining reliability; but filtering is needed to eliminate the atypical, out-of-range date. The intercept coefficient depicts the expected value when LST is 0°C and the model estimates 1°C. Other coefficients are the probability to increase prediction when LST increases, nevertheless, most parameters will not change significantly due to those geographic parameters that are discrete over time.
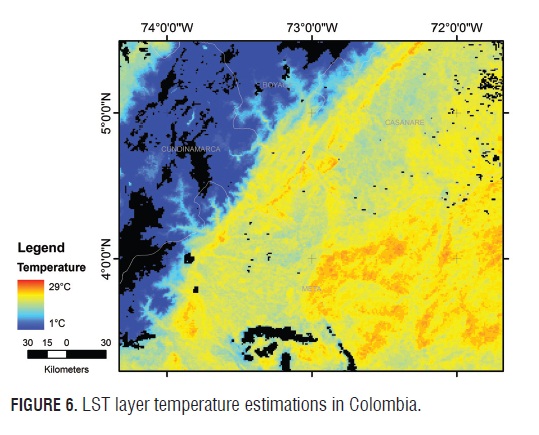
In Fig.6, a MODIS LST without modeling is shown. In Fig.7, the LST using the final model describes the changes when MODIS LST and other MODIS products are used for modeling LST in land surface. Several changes are observed (Fig.8): in low LST temperature, such as for mountain chains, the modeled temperature increased and in high LST temperature, such as for coasts and west areas, the modeled temperature decreased.
Conclusions
For Agronomics, a reliable set of data is indispensable when crop productivity is pursued. In a country such as Colombia, with broad differences in landscape morphology and large areas with not meteorological registration, the remote sensing technologies are relevant for achieving goals in monitoring and crop protection.
In this article, the land surface temperature was predicted in these out-of-record areas, precisely through the importance of monitoring environmental parameters in crops. The knowledge of the surrounding context of the plantings requires a huge set of data that is not available by the traditional methods, and MODIS, as a free service, can aid this labor.
The research results of the evaluation of the whole MODIS package dataset and the highest accuracy for predicting the LST on the ground were obtained using the sensor zenith angle (from MOD09GA ) and solar zenith angles (from MOD13A2), which allowed for understanding of the view angle dependence related to the position of the sensor, the location of the sun and the reflection of the lambertian and non-lambertian areas. The vegetation conditions, which are associated with the climate conditions in the near zones, were studied with the gross primary productivity (from MOD17A2), leaf area index (from MOD15A2) and the enhance vegetation index (from MOD13A2), where the plant biomass, their conditions and characteristics where analyzed.
The resultant LMR, which included the MODIS-LST product, sensor and solar zenith angle, fraction of photosynthetically active radiation and net photosynthesis, was improved by the interaction of the use of statistical parameters known as comparative medians. This statistical Parameter allows for the reduction of over- and underestimations by the remote sensor when compared to the agrometeorological stations.
It is important to recognize that the time that the sensor shows in the day is delayed in comparison with the ground stations, meaning that this model facilitates recording the Land Surface Temperature on the ground for the previous hour.
The high confidence (0.06) of the model was evaluated by the R-fitted subtraction from the two datasets (0.88-0.92), according to the CCCV method (Kleinbaum and Nizam, 2007). As shown in Fig.7, the model was able to modify the differences between the MODIS-LST and the modeled ground measurements, which means that the model establishes a new whole temperature dataset (Fig.6). In this way, the model predicts the land surface temperature on the ground with a 85% success rate.
The possibilities of using this model are restricted to clear sky conditions (at least by less than 50% cloud clarity) which presents the biggest problem for remote sensing data in Colombia. But, these problems are easily solved with the daily temporal resolution of the MODIS payloads; also, the model can easily run as many times as necessary, provided the MODIS layers were downloaded through the Reverb ECHO System.
Acknowledgements
The author thanks to NASA for providing MODIS products free of charge; Cenicaña and IDEAM for collaboration with the ground measurements and for giving the necessary data for this study; and Mr. Javier Carbonell for his collaborative work and disposition and specially to Dr. Ernesto Bastidas Obando and Dr. Andrés Peña by the guidance in this research.
Literature cited
Amiri, R., Q. Weng, A. Alimohammadi, and S.K. Alavipanah. 2009. Spatial-temporal dynamics of land surface temperature in relation to fractional vegetation cover and land use/cover in the Tabriz urban area, Iran. Remote Sens. Environ. 113(12), 2606-2617.
Avissar, R. 1996. Potential effects of vegetation on the urban thermal environment. Atmos. Environ. 30(3), 437-448.
Bastiaanssen, W.G., D.J. Molden, and I.W. Makin. 2000. Remote sensing for irrigated agriculture: examples from research and possible applications. Agr. Water Manag. 46(2), 137-155.
Cohen, W.B., T.K. Maiersperger, Z. Yang, S.T. Gower, D.P. Turner, W.D. Ritts, M. Berterretche, and S.W. Running. 2003. Comparisons of land cover and LAI estimates derived from ETM + and MODIS for four sites in North America: A quality assessment of 2000/2001 provisional MODIS products. Remote Sens. Environ. 88(3), 233-255.
Coll, C. and V. Caselles. 1997. A split-window algorithm for land surface temperature from advanced very high resolution radiometer data: validation and algorithm comparison. J. Geophys. Res. 102(D14), 16697-16713.
Chuvieco, E., G. Ventura, M.P. Martín, and I. Gómez. 2005. Assessment of multitemporal compositing techniques of MODIS and AVHRR images for burned land mapping. Remote Sens. Environ. 94(4), 450-462.
Dash, P., F.M. Göttsche, F.S. Olesen, and H. Fischer. 2002. Land surface temperature and emissivity estimation from passive sensor data: theory and practice-current trends. Int. J. Remote Sens. 23(13), 2563-2594.
Dubayah, R.O. and J.B. Drake. 2000. Lidar remote sensing for forestry. J. For. 98(6), 44-46.
El Maayar, M. and J.M. Chen. 2006. Spatial scaling of evapotranspiration as affected by heterogeneities in vegetation, topography, and soil texture. Remote Sens. Environ. 102(1-2), 33-51.
Field, C.B., J.T. Randerson, and C.M. Malmström. 1995. Global net primary production: combining ecology and remote sensing. Remote Sens. Environ. 51(1), 74-88.
Florio, E.N., S.R. Lele, Y.C. Chang, R. Sterner, and G.E. Glass. 2004. Integrating AVHRR satellite data and NOAA ground observations to predict surface air temperature: a statistical approach. Int. J. Remote Sens. 25(15), 2979-2994.
Franklin, S.E. 2001. Remote sensing for sustainable forest management. CRC Press, Boca Raton, FL.
Gemmell, F. and A.J. McDonald. 2000. View zenith angle effects on the forest information content of three spectral indices. Remote Sens. Environ. 72(2), 139-158.
Gillies, R.R. and T.N. Carlson. 1995. Thermal remote sensing of surface soil water content with partial vegetation cover for incorporation into climate models. J. Appl. Meteorol. 34(4), 745-756.
Gleason, A.C.R., S.D. Prince, S.J. Goetz, and J. Small. 2002. Effects of orbital drift on land surface temperature measured by AVHRR thermal sensors. Remote Sens. Environ. 79(2-3), 147-165.
Hatfield, P. and P. Pinter. 1993. Remote sensing for crop protection. Crop Prot. 12(6), 403-413.
Heinsch, F.A., M. Reeves, C.F. Bowker, P. Votava, S. Kang, C. Milesi, M. Zhao, J. Glassy, R.R. Nemani, and S.W. Running. 2003. User's guide: GPP and NPP (MOD17A2/A3) products NASA MODIS land algorithm. Version 2. pp. 1-57. In: http://www.unc.edu/courses/2010spring/geog/591/001/vol2/data/MOD17UsersGuide.pdf; consulted: June, 2013.
Hu, H., W. Liu, and M. Cao. 2008. Impact of land use and land cover changes on ecosystem services in Menglun, Xishuangbanna, Southwest China. Environ. Monit. Assess. 146(1), 147-156.
Kleinbaum, K. and M. Nizam. 2007. Applied regression analysis and other multivariable methods. 4th ed. Cengage Publishers, Belmont, CA.
Lamb, D. and R. Brown. 2001. PA-Precision agriculture: remotesensing and mapping of weeds in crops. J. Agr. Eng. Res. 78(2), 117-125.
Liang, S., H. Fang, M. Chen, Ch.J. Shuey, Ch. Walthall, C. Daughtry, J. Morisette, C. Schaaf, and A. Strahler. 2002. Validating MODIS land surface reflectance and albedo products: Methods and preliminary results. Remote Sens. Environ. 83(1), 149-162.
Lim, A., S.C. Liew, and L.K. Kwoh. 2004. Retrieval of land surface temperature in the humid tropics from MODIS data by modeling the atmospheric transmission and thermal emission. pp. 4572-4575. In: Geoscience and Remote Sensing Symposium (IGA RSS ). Vol. 7. IEEE International, Anchorage, AK.
McAtee, B.K., M.J. Lynch, and A.J. Prata. 2001. On surface-atmosphere interactions in the thermal infrared which impact satellite-derived land surface temperatures. pp. 721-723. In: Geoscience and Remote Sensing Symposium (IGA RSS ). Vol. 2. IEEE International, Sydney, Australia.
Metternicht, G. and J. Zinck. 2003. Remote sensing of soil salinity: potentials and constraints. Remote Sens. Environ. 85(1), 1-20.
Middleton, E.M. 1991. Solar zenith angle effects on vegetation indices in tallgrass prairie. Remote Sens. Environ. 38(1), 45-62.
Moran, M.S., Y. Inoue, and E. Barnes. 1997. Opportunities and limitations for image-based remote sensing in precision crop management. Remote Sens. Environ. 61(3), 319-346.
Morrow, N. and A. Friedl. 1998. Modeling biophysical controls on land surface temperature and reflectance in grasslands. Agr. For. Meteorol. 92(3), 147-161.
Myers, R.H. 1990. Classical and modern regression with applications, 2. Duxbury Press, Belmont, CA.
NASA , National Aeronautics and Space Administration. 2007. Reverb ECHO System. In: http://reverb.echo.nasa.gov;consulted: June, 2013.
NASA , National Aeronautics and Space Administration. 2011. MRTS wath software. Land Processes and Distributed Active Archive Center. In: http://lpdaac.usgs.gov/tools/modis_reprojection_tool_swath; consulted: June, 2013.
Njoku, E.G. and D. Entekhabi. 1996. Passive microwave remote sensing of soil moisture. J. Hydrol 184(1), 101-129.
Peterson, D.L., J.D. Aber, P.A. Matson, D.H. Card, N. Swanberg, C. Wessman, and M. Spanner. 1988. Remote sensing of forest canopy and leaf biochemical contents. Remote Sens. Environ. 24(1), 85-108.
Peterson, T.C., A.N. Basist, C.N. Williams, and N.C. Grody. 2000. A blended satellite -in situ near- global surface temperature dataset. Bul. Amer. Meteorol. Soc. 81(9), 2157-2164.
Raykov, T. and G.A. Marcoulides. 1999. On desirability of parsimony in structural equation model selection. Struct. Equ. Model.: Multidiscip. J. 6(3), 292-300.
Russell, M. 2001. Monitoring regional vegetation change using reflectance measurements from multiple solar zenith angles. Environ. Int. 27(2-3), 211-217.
Samper, F.J. and S.P. Neuman. 1989. Estimation of spatial covariance structures by adjoint state maximum likelihood cross validation: 1. Theory. Water Resour. Res. 25(3), 351-362.
Savtchenko, A., D. Ouzounov, S. Ahmad, J. Acker, G. Leptoukh, J. Koziana, and D. Nickless. 2004. Terra and Aqua MODIS products available from NASA GES DAA C. Adv. Space Res. 34(4), 710-714.
Schmugge, T. 1985. Remote sensing of soil moisture. Hydrological forecasting. John Wiley and Sons, New York, NY . Stoica, P. and T. Söderström. 1982. On the parsimony principle. Int. J. Control 36(3), 409-418.
Turner, D.P., S. Ollinger, M.l. Smith, O. Krankina, and M. Gregory. 2004. Scaling net primary production to a MODIS footprint in support of earth observing system product validation. Int. J. Remote Sens. 25(10), 1961-1979.
Turner, D.P., W.D. Ritts, W.B. Cohen, S.T. Gower, S.W. Running, M. Zhao, M.H. Costa, A.A. Kirschbaum, J.M. Ham, S.R. Saleska, and D.E. Ahl. 2006. Evaluation of MODIS NPP and GPP products across multiple biomes. Remote Sens. Environ. 102(3), 282-292.
Vancutsem, C., P. Ceccato, T. Dinku, and S.J. Connor. 2010. Evaluation of MODIS land surface temperature data to estimate air temperature in different ecosystems over Africa. Remote Sens. Environ. 114(2), 449-465.
Wan, Z. 2008. New refinements and validation of the MODIS land-surface temperature/emissivity products. Remote Sens. Environ. 112(1), 59-74.
Wan, Z. and J. Dozier. 1996. A generalized split-window algorithm for retrieving land-surface temperature from space. Geosci. Remote Sens. 34(4), 892-905.
Wan, Z. and Z.L. Li. 2008. Radiance-based validation of the V5 MODIS land-surface temperature product. Int. J. Remote Sens. 29(17-18), 5373-5395.
Wan, Z., Y. Zhang, Q. Zhang, and Z.-l. Li. 2002. Validation of the land-surface temperature products retrieved from terra moderate resolution imaging spectroradiometer data. Remote Sens. Environ. 83(1-2), 163-180.
Wan, Z., Y. Zhang, Q. Zhang, and Z.-L. Li. 2004a. Quality assessment and validation of the MODIS global land surface temperature. Int. J. Remote Sens. 25(1), 261-274.
Wang, K., Z. Wan, P. Wang, M. Sparrow, J. Liu, and S. Haginoya. 2007. Evaluation and improvement of the MODIS land surface temperature/emissivity products using ground-based measurements at a semi-desert site on the western Tibetan Plateau. Int. J. Remote Sens. 28(11), 2549-2565.
Wang, K., Z. Wan, P. Wang, M. Sparrow, J. Liu, X. Zhou, and S. Haginoya. 2005. Estimation of surface long wave radiation and broadband emissivity using moderate resolution imaging spectroradiometer (MODIS) land surface temperature/emissivity products (on line). J. Geophys. Res. 110(D11), http://www.icess.ucsb.edu/modis/papers/wan_p39.pdf; consulted: June, 2013.
Wang, W., S. Liang, and T. Meyers. 2008. Validating MODIS land surface temperature products using long-term nighttime ground measurements. Remote Sens. Environ. 112(3), 623-635.
Weng, Q., D. Lu, and J. Schubring. 2004. Estimation of land surface temperature-vegetation abundance relationship for urban heat island studies. Remote Sens. Environ. 89(4), 467-483.
Westoby, M., D.S. Falster, A.T. Moles, P.A. Vesk, and I.J. Wright. 2002. Plant ecological strategies: some leading dimensions of variation between species. Annu. Rev. Ecol. Syst. 33, 125-159.
Wheeler, D. and M. Tiefelsdorf. 2005. Multicollinearity and correlation among local regression coefficients in geographically weighted regression. J. Geogr. Syst. 7(2), 161-187.
Xiao, X., B. Braswell, Q. Zhang, S. Boles, S. Frolking, and B. Moore III. 2003. Sensitivity of vegetation indices to atmospheric aerosols: continental-scale observations in Northern Asia. Remote Sens. Environ. 84(3), 385-392.
Yuan, M. and Y. Lin. 2006. Model selection and estimation in regression with grouped variables. J. R. Stat. Soc.: Series B 68(1), 49-67.
Zeng, X.M., M. Zhao, B.-K. Su, J.-P. Tang, Y.-Q. Zheng, Y.-J. Zhang, and J. Chen. 2003. Effects of the land-surface heterogeneities in temperature and moisture from the "combined approach" on regional climate: a sensitivity study. Global Planet. Change 37(3-4), 247-263.
How to Cite
APA
ACM
ACS
ABNT
Chicago
Harvard
IEEE
MLA
Turabian
Vancouver
Download Citation
Article abstract page views
Downloads
License
Copyright (c) 2013 Agronomía Colombiana

This work is licensed under a Creative Commons Attribution-NonCommercial-ShareAlike 4.0 International License.
© Centro Editorial de la Facultad de Ciencias Agrarias, Universidad Nacional de Colombia
Reproduction and quotation of material appearing in the journal is authorized provided the following are explicitly indicated: journal name, author(s) name, year, volume, issue and pages of the source. The ideas and observations recorded by the authors are their own and do not necessarily represent the views and policies of the Universidad Nacional de Colombia. Mention of products or commercial firms in the journal does not constitute a recommendation or endorsement on the part of the Universidad Nacional de Colombia; furthermore, the use of such products should comply with the product label recommendations.
The Creative Commons license used by Agronomia Colombiana journal is: Attribution - NonCommercial - ShareAlike (by-nc-sa)

Agronomia Colombiana by Centro Editorial of Facultad de Ciencias Agrarias, Universidad Nacional de Colombia is licensed under a Creative Commons Reconocimiento-NoComercial-CompartirIgual 4.0 Internacional License.
Creado a partir de la obra en http://revistas.unal.edu.co/index.php/agrocol/.


