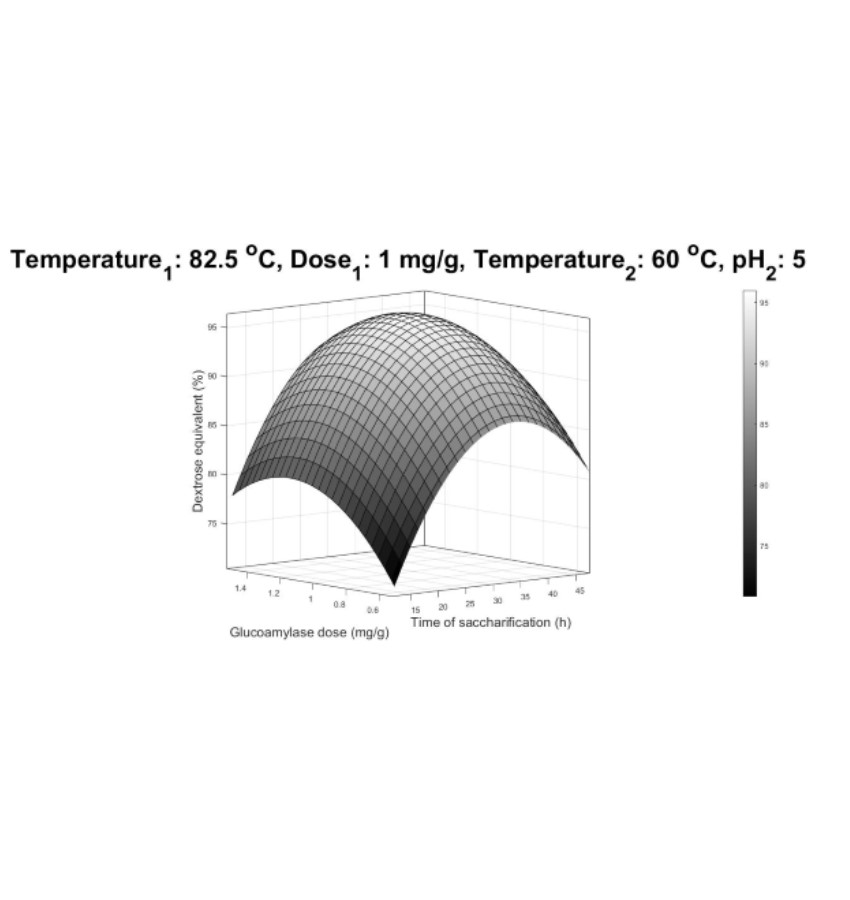
Effect of saccharification time and dose of glucoamylase on dextrose equivalent

Publicado

2025-03-19

Optimization of enzymatic hydrolysis of corn starch to obtain glucose syrups by genetic algorithm

Optimización de la hidrólisis enzimática del almidón de maíz para obtener siropes de glucosa mediante algoritmos genéticos

DOI:

https://doi.org/10.15446/dyna.v92n235.116302

Palabras clave:

hidrólisis enzimática, jarabes de glucosa, amilasas, algoritmo genético, equivalente de dextrosa (es)
enzymatic hydrolysis, glucose syrups, amylases, genetic algorithm, dextrose equivalent (en)

Autores/as

Este trabajo corresponde a la optimización de las variables de operación de la hidrólisis enzimática de almidón de maíz para la obtención de jarabes de glucosa utilizando el algoritmo genético de Matlab (2020a). Para ello, el proceso de hidrólisis se modeló matemáticamente mediante la metodología de superficie de respuesta. El diagrama de Pareto indicó que las variables de sacarificación ejercen la mayor influencia en la conversión del almidón. Este modelo matemático es de gran utilidad para una mejor comprensión y control operacional de la hidrólisis a nivel industrial. La solución del problema de optimización muestra que puede alcanzarse un equivalente máximo de dextrosa del 98,13% si la hidrólisis se realiza en las condiciones operacionales óptimas, las cuales se comprobaron experimentalmente. Los resultados muestran que, para alcanzar el mayor rendimiento, la licuefacción debe llevarse a cabo a una temperatura de 92oC, pH de 6,3, dosis de α-amilasa de 1,5 mg de enzima/g de almidón y tiempo de hidrólisis de 1 hora; mientras que la sacarificación debe realizarse a una temperatura de 57oC, pH de 4,9, dosis de glucoamilasa de 1,15 mg de enzima/g de almidón y tiempo de hidrólisis de 34 horas. El fenómeno de reversión se detectó cuando el tiempo de hidrólisis superó las 35 horas, con una incidencia negativa sobre el equivalente en dextrosa.

This work corresponds to the optimization of the operating variables of the enzymatic hydrolysis of corn starch to obtain glucose syrups using the genetic algorithm of Matlab (2020a). For this reason, the hydrolytic process is mathematically modeled by response surface methodology. Pareto chart indicated that saccharification variables exert the highest influence on starch conversion. This mathematical model is beneficial for a better understanding and operational control of hydrolysis at the industrial level. The optimization problem solution shows that a maximum dextrose equivalent of 98.13% can be reached if the hydrolysis is performed under optimal operating conditions, which were also confirmed experimentally. The results show that to achieve the highest yield, liquefaction should be carried out at a temperature of 92oC, pH of 6.3, α-amylase dose of 1.5 mg enzyme/g starch and hydrolysis time of 1 hour; while saccharification should be conducted at a temperature of 57oC, pH of 4.9, glucoamylase dose of 1.15 mg enzyme/g starch and hydrolysis time of 34 hours. The reversion phenomenon is detected when the hydrolysis time exceeds 35 hours, with a negative incidence on the dextrose equivalent.

Recibido: 20 de agosto de 2024; Revisión recibida: 17 de febrero de 2025; Aceptado: 24 de febrero de 2025

Abstract

This work corresponds to the optimization of the operating variables of the enzymatic hydrolysis of corn starch to obtain glucose syrups using the genetic algorithm of Matlab (2020a). For this reason, the hydrolytic process is mathematically modeled by response surface methodology. Pareto chart indicated that saccharification variables exert the highest influence on starch conversion. This mathematical model is beneficial for a better understanding and operational control of hydrolysis at the industrial level. The optimization problem solution shows that a maximum dextrose equivalent of 98.13% can be reached if the hydrolysis is performed under optimal operating conditions, which were also confirmed experimentally. The results show that to achieve the highest yield, liquefaction should be carried out at a temperature of 92oC, pH of 6.3, α-amylase dose of 1.5 mg enzyme/g starch and hydrolysis time of 1 hour; while saccharification should be conducted at a temperature of 57oC, pH of 4.9, glucoamylase dose of 1.15 mg enzyme/g starch and hydrolysis time of 34 hours. The reversion phenomenon is detected when the hydrolysis time exceeds 35 hours, with a negative incidence on the dextrose equivalent.

Keywords:

enzymatic hydrolysis, glucose syrups, amylases, genetic algorithm, dextrose equivalent.

Resumen

Este trabajo corresponde a la optimización de las variables de operación de la hidrólisis enzimática de almidón de maíz para la obtención de jarabes de glucosa utilizando el algoritmo genético de Matlab (2020a). Para ello, el proceso de hidrólisis se modeló matemáticamente mediante la metodología de superficie de respuesta. El diagrama de Pareto indicó que las variables de sacarificación ejercen la mayor influencia en la conversión del almidón. Este modelo matemático es de gran utilidad para una mejor comprensión y control operacional de la hidrólisis a nivel industrial. La solución del problema de optimización muestra que puede alcanzarse un equivalente máximo de dextrosa del 98,13% si la hidrólisis se realiza en las condiciones operacionales óptimas, las cuales se comprobaron experimentalmente. Los resultados muestran que, para alcanzar el mayor rendimiento, la licuefacción debe llevarse a cabo a una temperatura de 92oC, pH de 6,3, dosis de α-amilasa de 1,5 mg de enzima/g de almidón y tiempo de hidrólisis de 1 hora; mientras que la sacarificación debe realizarse a una temperatura de 57oC, pH de 4,9, dosis de glucoamilasa de 1,15 mg de enzima/g de almidón y tiempo de hidrólisis de 34 horas. El fenómeno de reversión se detectó cuando el tiempo de hidrólisis superó las 35 horas, con una incidencia negativa sobre el equivalente en dextrosa.

Palabras clave:

hidrólisis enzimática, jarabes de glucosa, amilasas, algoritmo genético, equivalente de dextrosa.

1. Introduction

The global production of glucose syrups has increased considerably in recent years. Industrial production of glucose syrups is based on starch hydrolysis, which can be performed by either acid or enzymatic catalysis or by a combination of both methods [1-3]. The use of enzymes allows selective hydrolysis under mild conditions, which minimizes sugar degradation and leads to dextrose equivalents above 95% [4]. Furthermore, the production cost is reduced by 30%, ashes by 50%, and secondary products by 90% through the first stage of conversion of enzymatic hydrolysis [5].

The enzymatic hydrolysis consists of three main stages: gelatinization, liquefaction, and saccharification [6]. This stage is of great importance because, starch is insoluble in water, and solubilized starch is more susceptible to attack by amylases [7-8].

During liquefaction, which begins once the substrate is solubilized, the starch chains are partially cleaved by the action of the enzyme α-amylase resulting in the formation of dextrins [9], and a decrease in viscosity due to this partial hydrolysis [7]. After that, the mixture is cooled and submitted to the saccharification process [9], where the dextrins are converted to glucose by the action of glucoamylase [7] until reaching the desired dextrose equivalent.

The control of the enzymatic hydrolysis process is extremely complex, and its efficiency depends directly on the degree of conversion of starch to glucose. Enzymes are catalysts that require particular working conditions to develop their maximum catalytic activity. They are highly sensitive, and minimal changes in the work environment can lead to their inactivation, which is often irreversible (denaturation) depending on the specific pH and temperature values.

In turn, the process of enzymatic hydrolysis of starch to obtain glucose may be affected by the reversion phenomenon. Reversion is an adverse phenomenon consisting of the regrouping of glucose molecules, which has serious consequences for the process yield. This occurs at high concentrations of glucose that occur at a determined hydrolysis time [10]. Inhibitory effects can also appear during hydrolytic processes due to the presence of high concentrations of starch or glucose, which consequently decreases the catalytic activity [6].

Hence the importance of determining the values of the operational parameters that allow the maximum hydrolysis yield and a more efficient use of enzymes, which are expensive industrial materials.

This work is aimed at determining the optimal parameters of the hydrolytic process. For this purpose, mathematical modeling of the hydrolysis is necessary, which is performed by using a statistical design of experiments by response surface. Surface response methodology has proven to be a powerful tool in research related to the enhancement of properties and processes related to enzymatic hydrolysis, as evidenced by multiple studies [11]. The optimization problem is solved using genetic algorithms. This attractive mathematical method is very useful for the determination of global optimum in complex mathematical models, showing very good results compared to traditional methods [12]. This research provides new experimental evidence that allows a better understanding of this hydrolysis. The results obtained support the control and making of operational decisions in the industrial process.

2. Materials and methods

2.1. Materials

Labiofam (Cienfuegos, Cuba). Enzyme preparations Bialfa-T (α-amylase from Bacillus licheniformis) and Glucozyme (glucoamylase from Aspergillus niger), both produced by Biocon (Barcelona, Spain) were used. All other chemical were analytical grade.

2.2. Enzyme characterization

2.2.1. Enzyme activity assay

Enzyme activity was determined according to Miller method [13], which is based on the quantification of reducing sugars. Potato soluble starch was used as substrate (1% w/v) in 20 mM sodium acetate buffer (pH 6.5 for α-amylase, and pH 4.5 for glucoamylase). The reaction mixture containing 0.5 mL of substrate solution and 0.5 mL of enzyme (diluted) was incubated for 10 min at 40oC for α-amylase, and at 60oC for glucoamylase. The reaction was terminated by adding 1 ml of 3,5-dinitrosalycyclic acid solution (DNS) and then was heated at 100oC for 10 min. Finally, the mixture was cooled to ambient temperature, 1.2 mL water was added, and the absorbance was measured at 546 nm using spectrophotometer (UV1800, Shanghai, China). One unit (UI) of enzyme activity is defined as the amount of enzyme that catalyzes the production of 1 μmol of reducing sugar (glucose) per minute under the specified assay conditions.

2.2.2. Determination of protein content

Protein content in the enzyme preparation was determined by Folin-Lowry method [14] using bovine serum albumin as standard in the range of 0.1-1 mg/mL, such as Akhtar, A. et al. [15] and Nakov, G. et al. [16].

2.2.3. Effects of temperature and pH on enzyme activity

The effect of temperature on enzyme activity was determined in the range of 40-95oC at pH 6.5 for α-amylase, and between 40oC and 85oC at pH 4.5 for glucoamylase. The effect of pH was investigated in the range of pH 2.5 - pH 11 at 40°C for α-amylase and between pH 2.5 and pH 8.5 at 60°C for glucoamylase. The buffers used were 0.1 M acetic acid-sodium acetate (pH 2.5-6.5), 0.1 M NaHPO4 -NaH2PO4 (pH 7-8.5) and 0.1 M NaH2PO4 - NaOH (pH 9-11). The activity was expressed as relative activity (%) based on maximal activity.

2.3. Experimental modeling of corn starch hydrolysis by response surface

The mathematical model that describes the corn starch hydrolysis was obtained by response surface methodology (RSM) through statistical design of experiments. The operational variables considered in the modeling as experimental factors were pH, temperature, time, and enzyme dosage for each hydrolysis stage. Those variables were selected based on the significant influence that they exerted on starch conversion to glucose. In addition, they were analyzed in a range that covers the normal values that used in the industrial process.

For the liquefaction stage, the pH from 5.5 to 7.5, temperature from 70 to 95oC, enzyme dosage from 0.5 to 1.5 mg enzyme/g starch, and hydrolysis time from 1 to 2 hours were analyzed. In turn, for the saccharification stage, the pH from 4 to 6, temperature from 50 to 70oC, enzyme dosage from 0.5 to 1.5 mg enzyme/g starch and hydrolysis time from 24 to 48 hours were studied.

The dextrose equivalent (DE) was used as a response variable because it is directly dependent on glucose production, and it is the main quality parameter of syrup. DE is a measure of the reducing sugars contained in a product, and it is expressed as percentage on a dry substance.

The parameters of the gelatinization stage (time and temperature) were held constant, and, therefore, were not considered as experimental factors in the mathematical model. They were set to values ensuring the complete solubility of the substrate in order to ensure an appropriate enzymatic degradation. The gelatinization was performed at 100oC for 7 minutes, according to the values used in the industry. Higher values than those would not completely solubilize the very concentrated (35% (w/v)) starch suspension, and they would cause irreversible enzyme denaturation.

A central composite design with star points (2 ^ 8-2 + star) was performed using the software Statgraphics Centurion XVI (version 16.2.04). The design was of fractional type due to the high number of experimental factors. Design of experiments was face centered with an axial distance of 1. Five replicas were incorporated in the center to the design of experiments, according to what was established by Montgomery, D. C. [17] for a better quality of model. Center runs provided a means for estimating the experimental errors and a measure of lack of fit. Statistical design composed to 85 experimental runs and 40 error degrees of freedom was obtained. This design is sufficient to fit a quadratic model as shown in Eq. (1), containing square terms and linear terms. The model does not include the interactions among the factors experimental that this design is fractioned.

Where:

Y: response variable

βo, βi, βii: Regression coefficients for intercept, linear and quadratic terms, respectively

Xi: Independent variables

k: Number of experimental factors

2.4. Enzymatic hydrolysis

A 500 mL corn starch suspension (35 % w/v) was used as a substrate in reactor of 1 L of capacity. A 5% (w/v) calcium chloride solution was added until achieving a concentration of 50 ppm in substrate. The pH was adjusted to the work values by adding 0.1 M Na2CO3 or 0.1 M HCl, which are typically used for pH adjustment in industrial-scale operations. After conditioning the substrate suspension, α-amylase was added, and the gelatinization was developed by placing the flask with the reaction mixture in a heating bath at 100°C for 7 minutes with constant manual stirring. Starch solubilization was monitored by the iodine qualitative procedure established by Corn Refiners Association [18].

The liquefaction was carried out in a heating bath to operational conditions established in the design of experiments. Subsequently, the hydrolyzate was cooled to room temperature, and the pH was adjusted to the required value for the saccharification. Glucoamylase was added and the reaction mixture was incubated with shaking at 43 rpm (DW-90, Shanghai, China) and the required temperature and time.

The dextrose equivalent was calculated as:

The amount of reducing sugars was determined by the DNS method, such as Miafo, A.-P. T. et al. [19].

2.5. Statistical analysis

Analysis of the statistical design of experiments by response surface was performed in Statgraphics Centurion XVI software (version 16.2.04). The analysis of significance of the experimental factors and their interactions was determined through Pareto charts of standardized effects [20]. Goodness of fit to the mathematical model was determined by Fisher's test and the relationship between the observed and predicted value of the response variable.

According to Montgomery, D. et al. [21], for a linear regression model to be valid, the mathematical assumptions made when applying this modeling technique must be checked. The assumption of normal distribution of residuals was verified by the Shapiro-Wilk test, the homoscedasticity assumption of the residuals by the Breusch-Pagan test and the independence assumption of the residuals by the Durbin-Watson test [22]. These tests were performed in RStudio (versión 1.3.959) software.

2.6. Optimization

The maximum dextrose equivalent value is determined using the genetic algorithm method in Matlab (2020a). For the solution of the optimization problem, the following setting parameters are used in the genetic algorithm: 100 generations, a reproduction factor of 0.8, an initial population of 20, and an error of 1e-6 as stopping criterion [23].

The optimization results were validated with two replicates by experiments and compared in terms of relative error (eq. 3). The maximum admissible variation was 5%.

Where:

DE1: Experimental dextrose equivalent (%)

DE2: Dextrose equivalent determined with mathematical model (%)

3. Results and discussion

3.1. Enzyme characterization

The enzyme activity of the α-amylase preparation was 32 270 U/mL and its protein concentration was 38.6 mg/mL. The specific enzymatic activity of 836 U/mg protein. The activity of the glucoamylase preparation was 21 678 U/mL, the protein concentration was 100 mg/mL, and the specific activity was 216 U/mg.

The α-amylase activity was above 90% in range between 70 and 95oC, and the highest value was observed at 90oC (100 %) (Fig. 1-A). This indicates that the enzyme preparation can be used for hydrolysis at high temperature values. On the other hand, the enzyme activity was above 80% at pH values between 5 and 8, with a maximum of catalytic activity observed at 7 (Fig. 1-B).

Enzyme activity of α-amylase at different values of temperature (A) and pH (B)

Figure 1: Enzyme activity of α-amylase at different values of temperature (A) and pH (B)

Source: The authors.

Numerous studies report different types of α-amylase of industrial interest with similar characteristics. In this regard, Hobbs, L. [1], Olsen, H. [24], and Balakrishnan, D. et al. [25] refer α-amylases from Bacillus licheniformis with high activity at temperatures between 80 and 110oC, and more specifically between 90 and 105oC. Similarly, Olsen, H. [24], Balakrishnan, D. et al. [25] and Wong, D. [26] mention examples of enzymes of this type with maximum activity to pH between 5-7 from Bacillus licheniformis.

Glucoamylase has more than 90% of its activity at pH between 3.5 and 5.5 at 60oC, with a maximum value at 4.5 (100%) (Fig. 2-B). In the case of temperature, this enzyme has more than 90% catalytic activity at values between 60 and 70°C at a pH of 4.5 (Fig. 2-A). The maximum enzymatic activity is verified at 65oC (100%).

Effect of temperature (A) and pH (B) on glucoamylase activity

Figure 2: Effect of temperature (A) and pH (B) on glucoamylase activity

Source: The authors

This trend is in correspondence with that stated by Friedl, A. [9], Helstad, S. [3] and Hobbs, L. [1]. They refer as typical to glucoamylase of industrial interest that presents the highest activity at pH values that are between 3.5 and 6.5 and temperature between 55 and 70oC.

The above-discussed results show that both enzyme preparations are appropriate for investigating starch hydrolysis under conditions typical for industrial processes. In addition, these results allow to identify the specific work values of pH and temperature to be used as independent factors in the experimental design.

3.2. Enzymatic hydrolysis

The statistical significance of the experimental factors and their quadratic effects on the response variable (dextrose equivalent) was analyzed by means Pareto chart of standardized effects (Fig. 3). Pareto chart illustrates an analysis of variance, where the most influential variables have a probability value less than 0.05 for a 95% confidence interval. The interactions between the experimental factors are not considered because of the fractional nature of the experiment design.

Pareto chart of standardized effects for dextrose equivalent (1-liquefaction 2-saccharification)

Figure 3: Pareto chart of standardized effects for dextrose equivalent (1-liquefaction 2-saccharification)

Source: The authors.

The saccharification time and the glucoamylase dosage exert the strongest influence on dextrose equivalent, and they have a directly proportional effect, which means that an increase in its value causes an increase in response.

It is known that glucoamylase only removes glucose molecules from the non-reducing end of dextrin chains obtained of liquefaction [7]. Since the liquefaction also leads to some limit dextrins, which are not fully hydrolyzable by α-amylase due to the presence of α-1,6-glycosidic branching bonds [27], and that slows down saccharification. Therefore, reaction times longer than 12 hours are required to obtain a high dextrose equivalent, and sometimes saccharification can last up to 72 hours [4,28].

The pH of saccharification has a negative influence because at the upper limit of the study a lower enzymatic activity is verified with respect to the central value. This result is corroborated with by behavior of Fig. 2-B. Liquefaction temperature and α-amylase dose have a statistically significant impact on the dextrose equivalent, although not in the same magnitude as the variables of the saccharification stage. Conversion in the liquefaction progresses to a critical point, which reduces the influence on the response of this variable in relation to those of the second stage. In addition, α-amylase requires at least three glucose units in the substrate [29].

The experimental results were used for developing a mathematical model describing the influence of the operational conditions on the response variable (Eq. 4). The experimental factors that did not exert significant influence on the response were excluded from the model. This consideration allowed obtaining a less complex mathematical expression, with a similar description level and better goodness of fit of the statistical model.

Were:

T1: Temperature of liquefaction (o C)

D1: Dose of α-amylase (mg enzyme/ g starch)

T2: Temperature of saccharification (o C)

pH2: pH of saccharification

D1: Dose of glucoamylase (mg enzyme/ g starch)

3.3. Analysis of the goodness-of-fit of the mathematical model and the residuals of the mathematical model

When analyzing the variation between the observed and predicted values of the response variable, only 27.06% of the experiments are not in the estimation range established by the software for 95% confidence. The model correctly explains the experimental values of dextrose equivalent because only 5.88% of predicted values have a relative error higher than 10%.

Fisher's test (F test) shows that there is a statistically significant relationship between the variables at a 99% confidence level since the P-value of the multiple regression analysis is less than 0.01. This confirms that the mathematical model has an adequate goodness of fit.

Table 1 shows the results of the validation tests of the linear regression assumptions. The P-value of the Shapiro-Wilk test is higher than the significance level (P-value>0.05), which shows that the residuals have a normal distribution [30]. The residual homoscedasticity is corroborated since the P-value of the Breush-Pagan test is higher than the significance level (p-value>0.05) [31]. As the P-value of the Durbin-Watson test (0.156) is above the significance level (p-value>0.05), there is no evidence of autocorrelation in the residuals [32]. The residual independence is a very important aspect to evaluate the quality of the experimental hydrolysis since it indicates that all variables affecting the response were controlled in the experiments [22].

Table 1: Results of the validation tests of the linear regression assumptions (95% confidence)

P-value Shapiro-Wilk test P-value Breush-Pagan test P-value Durbin-Watson test
0.084 0.147 0.156

Source: The authors.

3.4. Sensitivity of mathematical model and optimization

This analysis is carried out to evaluate the sensitivity of the response according to the variation of the experimental factors within the limits of the study. The analysis of sensibility is only carried out with the experimental variables of the saccharification, because they exert the strongest influence on the response. In addition, the terms of surface of the mathematical model correspond to the quadratic effects of variables of the saccharification stage (they represent a surface different to plane). Fig. 4 shows the relationship between either the saccharification time or the glucoamylase dosage and dextrose equivalent.

Effect of saccharification time and dose of glucoamylase on dextrose equivalent.

Figure 4: Effect of saccharification time and dose of glucoamylase on dextrose equivalent.

Source: The authors.

This analysis is carried out to evaluate the sensitivity of the response according to the variation of the experimental factors within the limits of the study. The analysis of sensibility is only carried out with the experimental variables of the saccharification, because they exert the strongest influence on the response. In addition, the terms of surface of the mathematical model correspond to the quadratic effects of variables of the saccharification stage (they represent a surface different to plane). Fig. 4 shows the relationship between either the saccharification time or the glucoamylase dosage and dextrose equivalent.

There is a region of maximum equivalent dextrose for a saccharification time between 28 and 39 hours, at a glucoamylase dose of 0.95 to 1.35 mg of enzyme/g of hydrolyzed starch. While the hydrolysis time elapses at dose constant, the hydrolytic conversion increases with the increase of the reaction time, then it reaches a maximum value, and after that a gradual decrease is observed (Fig. 5). That decrease can be attributed to reversion phenomena leading to glucoamylase-catalyzed recombination of the hydrolysis products with formation of maltose and isomaltose [24,29,33]. Reversion is a totally undesirable phenomenon in the industry, because it causes a considerable decrease in the dextrose equivalent. Therefore, in order to avoid reversion, glucoamylase should be inactivated immediately after reaching the desired dextrose equivalent [24].

Dependence of dextrose equivalent on pH and saccharification temperature.

Figure 5: Dependence of dextrose equivalent on pH and saccharification temperature.

Source: The authors.

As revealed from the experimental results, after 35 hours of saccharification the reversion begins to be significant. Consequently, in an industrial process, constant and rigorous monitoring of dextrose equivalent should be implemented in order to identify the time point giving the maximum glucose release, and thus minimize further losses due to re-association.

The graph shows a region of maximum dextrose equivalent at pH values between 4.4 and 5.5. This behavior coincides with that described in obtained in the characterization of the glucoamylase enzyme (Fig. 2-B).

With the increase in saccharification temperature, hydrolysis is favored until reaching a maximum glucose production between 51 and 62oC. From that point on, the conversion begins to decrease, which can be attributed to reduction of catalytic activity of the enzyme due to denaturation [34].

The values of the operating variables that maximize the dextrose equivalent were determined by optimizing the response surface model by genetic algorithm in Matlab (2020a). The results show that a maximum dextrose equivalent value of 98.13% can be achieved under the conditions indicated in Table 2.

Table 2: Results of optimization

Source: The authors.

The liquefaction temperature predicted by the model is in agreement with the values typically used in industrial hydrolysis of starch. According to different authors, the liquefaction temperature should be around 90oC [7], between 80 and 90oC [9], at 95oC [24] or between 90 and 100oC [33]. The time value of the first stage of hydrolysis is between 1 and 2 hours, interval in which it is normally verified in industrial process too [35-36]. The liquefaction pH predicted by the model is also consistent with the usual values of the industrial process [1,24,37].

The saccharification temperature also coincides with the values cited by BeMiller, J. N. [2], Fernandes, P. y Carvalho, F. [4], Olsen, H. [24] and Friedl, A. [9], which are between 55 and 60 oC. The pH of second stage corresponds to values at which saccharification is developed in industrial hydrolysis, according to: Hobbs, L. [1], Van der Maarel, M. [35], Fernandes, P. y Carvalho, F. [4], Olsen, H. [24] and Zhu, D. et al. [28]. Similarly, saccharification time is consistent with that mentioned by Hobbs, L. [1] and Zhu, D. et al. [28].

The results shown in Table 2 are very important to be in correspondence with the values normally referred to for this process, because this also constitutes (although indirectly) a criterion to validate the response surface model obtained. The optimal dextrose equivalent for the conditions shown in Table 2 is verified by means of an experiment with two replicates. Correct prediction model for these conditions is verified since the values of the dextrose equivalent observed and predicted differ by less than 5%.

The results presented in Table 2 indicate a significant economic advantage, by reducing production costs related to the consumption of enzymes, energy, water, and other substances needed for pH adjustment. The optimal enzyme dosage for each hydrolytic stage is crucial, considering the high costs of these industrial inputs.

In fact, one of the major challenges in the industrial process of enzymatic hydrolysis of corn starch is the expense associated with the enzymes used. The largest market for industrial enzymes is in the food and beverage manufacturing sector, which accounts for 26% of the global market [39]. This is mainly led by two strong producers Novozymes y Dupont Enzymes [7]. The report presented by Freedonia Group, states that the global demand for enzymes in 2021 would be at 5 trillion dollars with an annual growth of 4%. According to the Global Market Insights, by 2024, the enzyme trade of interest in the food industry would amount to 3.6 trillion dollars [39]. Therefore, making a more rational use of the enzymes used in starch hydrolysis is essential, considering that they represent about 30% of the world's production of industrial enzymes [40].

Higher amounts of enzyme do not necessarily lead to higher starch conversion. When low amounts of enzyme are used, its concentration is directly proportional to the reaction rate because the substrate is in abundance [35]. In contrast, as the dosage increases, the relationship with the reaction rate stops behaving linearly and starts to exhibit an asymptotic trend because the amount of substrate is a limiting factor. This behavior has a great economic impact on the industrial hydrolytic process, since an increase in enzyme dose does not necessarily lead to higher starch conversion.

The optimum temperature of the hydrolysis stages has a significant impact on the economics of the process, either because of its influence on enzyme activity and starch conversion (expensive raw materials) or because of the costs associated with the generation of steam used as a heating agent in the reactors. An increase in a few degrees of hydrolysis temperature implies high energy consumption and consequently, an increase in the operational cost according to: i) the large production volumes and ii) the concentration of dissolved solids (brix) of the hydrolysates. The brix of the hydrolysates influences the heat capacity and therefore the energy demand needed to increase the temperature. The temperature difference between liquefaction and saccharification influences the cooling water consumption in the intermediate heat transfer equipment involved in temperature regulation.

Synergistically, longer hydrolysis times lead to higher expenses incurred in maintaining temperature conditions in isothermal reactors, as well as higher power consumption in auxiliary agitation and circulation systems. This effect is of greater importance in saccharification, whose operation times can be up to 72 h [29,37]. Hence the significance of controlling this variable toward optimal values, in addition to its influence on phenomena previously addressed such as reversion.

Adjusting the pH to the optimum level affects the consumption of sodium carbonate and hydrochloric acid. This, in turn, impacts the costs associated with purchasing pH adjustment agents, as well as the expenses related to preparation, application, waste treatment operations, and ultimately the quality of the glucose syrup produced. Improved consumption of these inputs leads to decreased corrosion issues, a reduction in the formation of secondary compounds (some of which are colored) [36], and less salt production due to neutralization [41]. Some of the secondary compounds that can be generated during hydrolysis by acidifying agents include 5-hydroxymethylfurfural, levulinic acid, and derivatives of formic acid.

4. Conclusions

The mathematical model of hydrolysis obtained through response surface methodology presented an excellent goodness to fit according to Fisher test. The mathematical model showed that glucose production is more affected by the saccharification stage than by the liquefaction stage, and that saccharification time, temperature, and glucoamylase dose are the variables that exert the greatest effects on starch hydrolysis. The use of the mathematical model obtained can also be very useful for better operational control of the industrial process. The values of the operational variables that allow reaching a maximum dextrose equivalent (98.13%) were established by genetic algorithm in Matlab (2020a). Reversion affects remarkably the glucose yield, and that is evident above 35 hours of saccharification.

Acknowledgments

The authors thank the important support given by VLR USO through TEAM Project ZEIN2015PR402-3942.

References

[1] Hobbs, L., Sweeteners from starch: production, properties and uses, in: BeMiller, J., and Whistler, R., Starch: chemistry and technology, 3rd ed., 2009, pp. 797-832.

[2] BeMiller, J.N., Starches: Conversions, modifications, and uses, in: BeMiller, J.N. Carbohydrate chemistry for food scientists, 3rd ed., AACC International Press, [online]. 2019, pp. 191-221. Available at: http://www.sciencedirect.com/science/article/pii/B9780128120699000078.[Link]

[3] Helstad, S., Corn Sweeteners, in: Serna, S., Corn, 3rd ed., Oxford, AACC International Press, [online]. 2019, pp. 551-591. Available at: https://www.sciencedirect.com/science/article/pii/B9780128119716000206.[Link]

[4] Fernandes, P., and Carvalho, F., Enzymes in food processing, Cap 8, in: Dhillon, G., and Kaur, S., Agro-industrial wastes as feedstock for enzyme production, 1st ed., San Diego, Academic Press, [online]. 2016, pp. 173-199. Available at: http://www.sciencedirect.com/science/article/pii/B9780128023921000083.[Link]

[5] Serj, H.O., Enzymes in starch modification, in: Whitehurt, R. and Law, B., Enzymes in Food Technology, UK, Sheffield Academic Press, 2002, pp. 200-228.

[6] Acosta, J.C., et al. Enzymatic hydrolysis of wheat starch for glucose syrup production, DYNA, 87(214), pp. 173-182, 2020. DOI: https://doi.org/10.15446/dyna.v87n214.82669 [Link]

[7] Läufer, A., Starch biorefinery enzymes, in: Wagemann, K., and Tippkötter, N., Biorefineries, Cham, Springer International Publishing, 2017, pp. 137-152. DOI: https://doi.org/10.1007/10_2016_60.[Link]

[8] Salcedo, J., et al. Enzymatic modification of cassava starch (Corpoica M-Tai) around the pasting temperature DYNA, 85(204), pp. 223-230, 2018. DOI: https://doi.org/10.15446/dyna.v85n204.66620 [Link]

[9] Friedl, A., Bioethanol from sugar and starch, in: Kaltschmitt, M., Energy from Organic Materials (Biomass): a volume in the encyclopedia of sustainability science and technology, 2nd Ed., Springer, New York, USA, 2019, pp. 905-924. Doi: https://doi.org/10.1007/978-1-4939-7813-7_432 [Link]

[10] Fatourehchi, F., et al. Production of glucose syrup through enzymatic hydrolysis of flint and floury corn flour mixtures and evaluating its properties as cost-effective syrup, Journal of Food Science Technology, 19(129), pp. 23-39, 2022. DOI: https://doi.org/10.22034/FSCT.19.129.23 [Link]

[11] Acosta, J.C., et al. Enzymatic hydrolysis of wheat starch for glucose syrup production DYNA, 87(214), pp. 173-182, 2020. DOI: http://doi.org/10.15446/dyna.v87n214.82669.[Link]

[12] Morales, A., et al. Optimization of the enzymatic clarification process of glucose syrups derived from agro-industrial residues, DYNA, 91(233), pp. 9-16, 2024. DOI: https://doi.org/10.15446/dyna.v91n233.112080.[Link]

[13] Lambora, A., et al., Genetic Algorithm. A literature review, in: Proceedings of 2019 International Conference on Machine Learning, Big Data, Cloud and Parallel Computing (COMITCon), 2019, pp. 380-384.

[14] Miller, G.L., Use of dinitrosalicylic acid reagent for determination of reducing sugar, Analytical Chemistry, 31, pp. 426-428, 1959.

[15] Lowry, O.H., et al. Protein measurement with the Folin-phenol reagent, Journal of Biological Chemistry, 193, pp. 265-275, 1951.

[16] Akhtar, A., et al. Biochemical and morphological risk assessment of transgenic wheat with enhanced iron and zinc bioaccessibility, Journal of Cereal Science, 91, pp. 102881, 2020. DOI: https://doi.org/10.1016/j.jcs.2019.102881.[Link]

[17] Nakov, G., et al. The effect of einkorn (Triticum monococcum L.) whole meal flour addition on physico-chemical characteristics, biological active compounds and in vitro starch digestion of cookies, Journal of Cereal Science, 83, pp. 116-122, 2018. DOI: https://doi.org/10.1016/j.jcs.2018.08.004.[Link]

[18] Montgomery, D.C. Design and analysis of experiments. Wiley, New York, USA, 2017.

[19] CRA. Analytical Methods of the Member Companies of the Corn Refiners Association, [online]. 2024. Available at: https://corn.org/analytical-methods.[Link]

[20] Miafo, A.-P.T., et al. Free sugars and non-starch polysaccharides-phenolic acid complexes from bran, spent grain and sorghum seeds, Journal of Cereal Science, 87, pp. 124-131, 2019. DOI: https://doi.org/10.1016/j.jcs.2019.02.002.[Link]

[21] Oliveira, N.A.d., et al. Green coffee extracts rich in diterpenes - Process optimization of pressurized liquid extraction using ethanol as solvent, Journal of Food Engineering, 224, pp. 148-155, 2018. DOI: https://doi.org/10.1016/j.jfoodeng.2017.12.021.[Link]

[22] Montgomery, D., et al. Introduction to linear regression analysis. Wiley, New York, USA, 2021.

[23] Serrano, J., et al. Influence of imbibition temperature on the extraction stage of the cane sugar production, Journal of Food Engineering, 345, pp. 111414, 2023. DOI: https://doi.org/10.1016/j.jfoodeng.2023.111414.[Link]

[24] Peláez, H., et al. Simultaneous saccharification and fermentation of cassava stems, DYNA, 80(180), pp. 97-104, 2013.

[25] Olsen, H., Enzymes in starch modification, in: Whitehurt, R. and Law, B., Enzymes in Food Technology, Sheffield Academic Press, UK, 2002, pp. 200-228.

[26] Balakrishnan, D., Kumar, S.S., and Sugathan, S., Amylases for food applications-Updated information. in: Parameswaran, B., Varjani, S., and Raveendran, S. Eds., Green Bio-processes. Energy, Environment, and Sustainability. Springer, Singapore, 2019. DOI: https://www.doi.org/10.1007/978-981-13-3263-0_11.[Link]

[27] Wong, D., Enzymes, mechanism and theory in food chemistry, 2nd Ed., Springer International Publishing, Singapore, 2018. DOI: https://www.doi.org/10.1007/978-3-319-50766-8_5 [Link]

[28] Fallahi, P., et al., Depolymerizating enzymes in human food: bakery, dairy products, and drinks, in: Nunes, C.S., and Kumar, V., Enzymes in human and animal nutrition, Academic Press, [online]. 2018, pp 211-237. Available at: http://www.sciencedirect.com/science/article/pii/B9780128054192000101.[Link]

[29] Zhu, D., et al., 3.01 - Industrial Enzymes, in: Moo, M., Comprehensive Biotechnology, 3rd edition, Oxford, Pergamon, 2019, pp 1-13. DOI: https://doi.org/10.1016/B978-0-444-64046-8.00148-8 [Link]

[30] Purich, D., and Allison, D., The enzyme reference: a comprehensive guidebook to enzyme nomenclature, reactions, and methods. Academic Press, 2002.

[31] Chen, P.-Y., et al. Developing an integrated model relating substrate water content to indoor temperature reduction for irrigation-decision support of a green roof, Heliyon, 10(15), art. 33983, 2024. DOI: https://doi.org/10.1016/j.heliyon.2024.e33983.[Link]

[32] Alventosa, A., et al. How does firms’ cost structure affect their quality-price mix? An experimental analysis, Journal of Behavioral and Experimental Economics, 107, art. 102109, 2023. DOI: https://doi.org/10.1016/j.socec.2023.102109.[Link]

[33] Pulido Teuta, J., et al. A high-performance liquid chromatography method validation and a Box-Behnken experimental design for the extraction optimization of quercitrin from Nectandra reticulata, RSC Advances, 14(30), pp. 21874-21886, 2024. DOI: https://doi.org/10.1039/d4ra01723d.[Link]

[34] Hua, X., and Yang, R., Enzymes in starch processing, in: Chandrasekaran, M., Enzymes in food and beverage processing, CRC Press, New York, USA, 2016, pp 138-169.

[35] Lee, C.Y. and deMan, J.M., Enzymes, in: deMan, J.M., Finley, J.W., et al, Principles of food chemistry, Cham, Springer International Publishing, 2018, pp 397-433. DOI: https://doi.org/10.1007/978-3-319-63607-8_10 [Link]

[36] Van der Maarel, M., Starch-processing enzymes in: Whitehurst, R. and van Oort, R., Enzymes in food technology 2, John Wiley & Sons, New York, USA, 2010, pp 320-331.

[37] Carvalho, F., and Fernandes, P., Enzymes in sweeteners production, in: Parameswaran, B., Varjani, S., et al, Green Bio-processes: enzymes in industrial food processing, Springer, Singapore, 2019, pp 151-179. DOI: https://doi.org/10.1007/978-981-13-3263-0_9.[Link]

[38] Raghul, S., and Bhat, S., Enzymes: basics and development of novel biocatalysts, in: Chandrasekaran, M., Enzymes in food and beverage processing, 1, CRC Press, New York, USA, 2016, pp 3-38.

[39] Rathna, R. et al, Intriguing disposition of marine algae-derived enzymes, in: Parameswaran, B. et al., Green Bio-processes: energy, environment, and sustainability, Springer, Singapore, 2019. DOI: https://doi.org/10.1007/978-981-13-3263-0_16.[Link]

[40] Elmarzugi, N. et al., Amylase economic and application value. World Journal of Pharmacutical Research, 3(3), pp. 4890-4906, 2014.

[41] Sunarti, T.C., Derosya, V., and Yuliasih, I., Acid modification of sago hampas for industrial purposes, in: Ehara, Y. Toyoda, and Johnson, V., Multiple contributions to food security and sustainable livelihoods, Springer, Singapore, 2018, pp. 271-281.

: Serrano-Febles, J., Luis-Orozco, J., Luis-Ramírez, H., Gómez-Brizuela, L., -Brizuela, Carlos Martín-Medina, C., and García-Cruz, A., Optimization of enzymatic hydrolysis of corn starch to obtain glucose syrups by genetic algorithm. DYNA, 92(235), pp. 83-91, January - March, 2025.

Referencias

[1] Hobbs, L., Sweeteners from starch: production, properties and uses, in: BeMiller, J., and Whistler, R., Starch: chemistry and technology, 3rd ed., 2009, pp. 797-832. DOI: https://doi.org/10.1016/B978-0-12-746275-2.00021-5

[2] BeMiller, J.N., Starches: Conversions, modifications, and uses, in: BeMiller, J.N. Carbohydrate chemistry for food scientists, 3rd ed., AACC International Press, [online]. 2019, pp. 191-221. Available at: http://www.sciencedirect.com/science/article/pii/B9780128120699000078. DOI: https://doi.org/10.1016/B978-0-12-812069-9.00007-8

[3] Helstad, S., Corn Sweeteners, in: Serna, S., Corn, 3rd ed., Oxford, AACC International Press, [online]. 2019, pp. 551-591. Available at: https://www.sciencedirect.com/science/article/pii/B9780128119716000206. DOI: https://doi.org/10.1016/B978-0-12-811971-6.00020-6

[4] Fernandes, P., and Carvalho, F., Enzymes in food processing, Cap 8, in: Dhillon, G., and Kaur, S., Agro-industrial wastes as feedstock for enzyme production, 1st ed., San Diego, Academic Press, [online]. 2016, pp. 173-199. Available at: http://www.sciencedirect.com/science/article/pii/B9780128023921000083. DOI: https://doi.org/10.1016/B978-0-12-802392-1.00008-3

[5] Serj, H.O., Enzymes in starch modification, in: Whitehurt, R. and Law, B., Enzymes in Food Technology, UK, Sheffield Academic Press, 2002, pp. 200-228.

[6] Acosta, J.C., et al. Enzymatic hydrolysis of wheat starch for glucose syrup production, DYNA, 87(214), pp. 173-182, 2020. DOI: https://doi.org/10.15446/dyna.v87n214.82669

[7] Läufer, A., Starch biorefinery enzymes, in: Wagemann, K., and Tippkötter, N., Biorefineries, Cham, Springer International Publishing, 2017, pp. 137-152. DOI: https://doi.org/10.1007/10_2016_60.

[8] Salcedo, J., et al. Enzymatic modification of cassava starch (Corpoica M-Tai) around the pasting temperature DYNA, 85(204), pp. 223-230, 2018. DOI: https://doi.org/10.15446/dyna.v85n204.66620

[9] Friedl, A., Bioethanol from sugar and starch, in: Kaltschmitt, M., Energy from Organic Materials (Biomass): a volume in the encyclopedia of sustainability science and technology, 2nd Ed., Springer, New York, USA, 2019, pp. 905-924. Doi: https://doi.org/10.1007/978-1-4939-7813-7_432

[10] Fatourehchi, F., et al. Production of glucose syrup through enzymatic hydrolysis of flint and floury corn flour mixtures and evaluating its properties as cost-effective syrup, Journal of Food Science Technology, 19(129), pp. 23-39, 2022. DOI: https://doi.org/10.22034/FSCT.19.129.23

[11] Acosta, J.C., et al. Enzymatic hydrolysis of wheat starch for glucose syrup production DYNA, 87(214), pp. 173-182, 2020. DOI: http://doi.org/10.15446/dyna.v87n214.82669.

[12] Morales, A., et al. Optimization of the enzymatic clarification process of glucose syrups derived from agro-industrial residues, DYNA, 91(233), pp. 9-16, 2024. DOI: https://doi.org/10.15446/dyna.v91n233.112080.

[13] Lambora, A., et al., Genetic Algorithm. A literature review, in: Proceedings of 2019 International Conference on Machine Learning, Big Data, Cloud and Parallel Computing (COMITCon), 2019, pp. 380-384. DOI: https://doi.org/10.1109/COMITCon.2019.8862255

[14] Miller, G.L., Use of dinitrosalicylic acid reagent for determination of reducing sugar, Analytical Chemistry, 31, pp. 426-428, 1959. DOI: https://doi.org/10.1021/ac60147a030

[15] Lowry, O.H., et al. Protein measurement with the Folin-phenol reagent, Journal of Biological Chemistry, 193, pp. 265-275, 1951. DOI: https://doi.org/10.1016/S0021-9258(19)52451-6

[16] Akhtar, A., et al. Biochemical and morphological risk assessment of transgenic wheat with enhanced iron and zinc bioaccessibility, Journal of Cereal Science, 91, pp. 102881, 2020. DOI: https://doi.org/10.1016/j.jcs.2019.102881.

[17] Nakov, G., et al. The effect of einkorn (Triticum monococcum L.) whole meal flour addition on physico-chemical characteristics, biological active compounds and in vitro starch digestion of cookies, Journal of Cereal Science, 83, pp. 116-122, 2018. DOI: https://doi.org/10.1016/j.jcs.2018.08.004.

[18] Montgomery, D.C. Design and analysis of experiments. Wiley, New York, USA, 2017.

[19] CRA. Analytical Methods of the Member Companies of the Corn Refiners Association, [online]. 2024. Available at: https://corn.org/analytical-methods.

[20] Miafo, A.-P.T., et al. Free sugars and non-starch polysaccharides–phenolic acid complexes from bran, spent grain and sorghum seeds, Journal of Cereal Science, 87, pp. 124-131, 2019. DOI: https://doi.org/10.1016/j.jcs.2019.02.002.

[21] Oliveira, N.A.d., et al. Green coffee extracts rich in diterpenes – Process optimization of pressurized liquid extraction using ethanol as solvent, Journal of Food Engineering, 224, pp. 148-155, 2018. DOI: https://doi.org/10.1016/j.jfoodeng.2017.12.021.

[22] Montgomery, D., et al. Introduction to linear regression analysis. Wiley, New York, USA, 2021.

[23] Serrano, J., et al. Influence of imbibition temperature on the extraction stage of the cane sugar production, Journal of Food Engineering, 345, pp. 111414, 2023. DOI: https://doi.org/10.1016/j.jfoodeng.2023.111414.

[24] Peláez, H., et al. Simultaneous saccharification and fermentation of cassava stems, DYNA, 80(180), pp. 97-104, 2013.

[25] Olsen, H., Enzymes in starch modification, in: Whitehurt, R. and Law, B., Enzymes in Food Technology, Sheffield Academic Press, UK, 2002, pp. 200-228.

[26] Balakrishnan, D., Kumar, S.S., and Sugathan, S., Amylases for food applications—Updated information. in: Parameswaran, B., Varjani, S., and Raveendran, S. Eds., Green Bio-processes. Energy, Environment, and Sustainability. Springer, Singapore, 2019. DOI: https://www.doi.org/10.1007/978-981-13-3263-0_11.

[27] Wong, D., Enzymes, mechanism and theory in food chemistry, 2nd Ed., Springer International Publishing, Singapore, 2018. DOI: https://www.doi.org/10.1007/978-3-319-50766-8_5

[28] Fallahi, P., et al., Depolymerizating enzymes in human food: bakery, dairy products, and drinks, in: Nunes, C.S., and Kumar, V., Enzymes in human and animal nutrition, Academic Press, [online]. 2018, pp 211-237. Available at: http://www.sciencedirect.com/science/article/pii/B9780128054192000101. DOI: https://doi.org/10.1016/B978-0-12-805419-2.00010-1

[29] Zhu, D., et al., 3.01 - Industrial Enzymes, in: Moo, M., Comprehensive Biotechnology, 3rd edition, Oxford, Pergamon, 2019, pp 1-13. DOI: https://doi.org/10.1016/B978-0-444-64046-8.00148-8

[30] Purich, D., and Allison, D., The enzyme reference: a comprehensive guidebook to enzyme nomenclature, reactions, and methods. Academic Press, 2002. DOI: https://doi.org/10.1016/B978-012568041-7/50002-2

[31] Chen, P.-Y., et al. Developing an integrated model relating substrate water content to indoor temperature reduction for irrigation-decision support of a green roof, Heliyon, 10(15), art. 33983, 2024. DOI: https://doi.org/10.1016/j.heliyon.2024.e33983.

[32] Alventosa, A., et al. How does firms’ cost structure affect their quality–price mix? An experimental analysis, Journal of Behavioral and Experimental Economics, 107, art. 102109, 2023. DOI: https://doi.org/10.1016/j.socec.2023.102109.

[33] Pulido Teuta, J., et al. A high-performance liquid chromatography method validation and a Box–Behnken experimental design for the extraction optimization of quercitrin from Nectandra reticulata, RSC Advances, 14(30), pp. 21874-21886, 2024. DOI: https://doi.org/10.1039/d4ra01723d.

[34] Hua, X., and Yang, R., Enzymes in starch processing, in: Chandrasekaran, M., Enzymes in food and beverage processing, CRC Press, New York, USA, 2016, pp 138-169.

[35] Lee, C.Y. and deMan, J.M., Enzymes, in: deMan, J.M., Finley, J.W., et al, Principles of food chemistry, Cham, Springer International Publishing, 2018, pp 397-433. DOI: https://doi.org/10.1007/978-3-319-63607-8_10

[36] Van der Maarel, M., Starch-processing enzymes in: Whitehurst, R. and van Oort, R., Enzymes in food technology 2, John Wiley & Sons, New York, USA, 2010, pp 320-331. DOI: https://doi.org/10.1002/9781444309935.ch14

[37] Carvalho, F., and Fernandes, P., Enzymes in sweeteners production, in: Parameswaran, B., Varjani, S., et al, Green Bio-processes: enzymes in industrial food processing, Springer, Singapore, 2019, pp 151-179. DOI: https://doi.org/10.1007/978-981-13-3263-0_9.

[38] Raghul, S., and Bhat, S., Enzymes: basics and development of novel biocatalysts, in: Chandrasekaran, M., Enzymes in food and beverage processing, 1, CRC Press, New York, USA, 2016, pp 3-38. DOI: https://doi.org/10.1201/b19408-2

[39] Rathna, R. et al, Intriguing disposition of marine algae-derived enzymes, in: Parameswaran, B. et al., Green Bio-processes: energy, environment, and sustainability, Springer, Singapore, 2019. DOI: https://doi.org/10.1007/978-981-13-3263-0_16.

[40] Elmarzugi, N. et al., Amylase economic and application value. World Journal of Pharmacutical Research, 3(3), pp. 4890-4906, 2014.

[41] Sunarti, T.C., Derosya, V., and Yuliasih, I., Acid modification of sago hampas for industrial purposes, in: Ehara, Y. Toyoda, and Johnson, V., Multiple contributions to food security and sustainable livelihoods, Springer, Singapore, 2018, pp. 271-281. DOI: https://doi.org/10.1007/978-981-10-5269-9_20

Cómo citar

IEEE

[1]
J. Serrano-Febles, J. Luis-Orozco, H. L. Ramírez, L. Gómez-Brizuela, C. Martín, y A. García-Cruz, «Optimization of enzymatic hydrolysis of corn starch to obtain glucose syrups by genetic algorithm», DYNA, vol. 92, n.º 235, pp. 83–91, ene. 2025.

ACM

[1]
Serrano-Febles, J., Luis-Orozco, J., Ramírez, H.L., Gómez-Brizuela, L., Martín, C. y García-Cruz, A. 2025. Optimization of enzymatic hydrolysis of corn starch to obtain glucose syrups by genetic algorithm. DYNA. 92, 235 (ene. 2025), 83–91. DOI:https://doi.org/10.15446/dyna.v92n235.116302.

ACS

(1)
Serrano-Febles, J.; Luis-Orozco, J.; Ramírez, H. L.; Gómez-Brizuela, L.; Martín, C.; García-Cruz, A. Optimization of enzymatic hydrolysis of corn starch to obtain glucose syrups by genetic algorithm. DYNA 2025, 92, 83-91.

APA

Serrano-Febles, J., Luis-Orozco, J., Ramírez, H. L., Gómez-Brizuela, L., Martín, C. & García-Cruz, A. (2025). Optimization of enzymatic hydrolysis of corn starch to obtain glucose syrups by genetic algorithm. DYNA, 92(235), 83–91. https://doi.org/10.15446/dyna.v92n235.116302

ABNT

SERRANO-FEBLES, J.; LUIS-OROZCO, J.; RAMÍREZ, H. L.; GÓMEZ-BRIZUELA, L.; MARTÍN, C.; GARCÍA-CRUZ, A. Optimization of enzymatic hydrolysis of corn starch to obtain glucose syrups by genetic algorithm. DYNA, [S. l.], v. 92, n. 235, p. 83–91, 2025. DOI: 10.15446/dyna.v92n235.116302. Disponível em: https://revistas.unal.edu.co/index.php/dyna/article/view/116302. Acesso em: 10 jul. 2026.

Chicago

Serrano-Febles, Jonathan, Jesús Luis-Orozco, Héctor Luis Ramírez, Leissy Gómez-Brizuela, Carlos Martín, y Ariel García-Cruz. 2025. «Optimization of enzymatic hydrolysis of corn starch to obtain glucose syrups by genetic algorithm». DYNA 92 (235):83-91. https://doi.org/10.15446/dyna.v92n235.116302.

Harvard

Serrano-Febles, J., Luis-Orozco, J., Ramírez, H. L., Gómez-Brizuela, L., Martín, C. y García-Cruz, A. (2025) «Optimization of enzymatic hydrolysis of corn starch to obtain glucose syrups by genetic algorithm», DYNA, 92(235), pp. 83–91. doi: 10.15446/dyna.v92n235.116302.

MLA

Serrano-Febles, J., J. Luis-Orozco, H. L. Ramírez, L. Gómez-Brizuela, C. Martín, y A. García-Cruz. «Optimization of enzymatic hydrolysis of corn starch to obtain glucose syrups by genetic algorithm». DYNA, vol. 92, n.º 235, enero de 2025, pp. 83-91, doi:10.15446/dyna.v92n235.116302.

Turabian

Serrano-Febles, Jonathan, Jesús Luis-Orozco, Héctor Luis Ramírez, Leissy Gómez-Brizuela, Carlos Martín, y Ariel García-Cruz. «Optimization of enzymatic hydrolysis of corn starch to obtain glucose syrups by genetic algorithm». DYNA 92, no. 235 (enero 27, 2025): 83–91. Accedido julio 10, 2026. https://revistas.unal.edu.co/index.php/dyna/article/view/116302.

Vancouver

1.
Serrano-Febles J, Luis-Orozco J, Ramírez HL, Gómez-Brizuela L, Martín C, García-Cruz A. Optimization of enzymatic hydrolysis of corn starch to obtain glucose syrups by genetic algorithm. DYNA [Internet]. 27 de enero de 2025 [citado 10 de julio de 2026];92(235):83-91. Disponible en: https://revistas.unal.edu.co/index.php/dyna/article/view/116302

Descargar cita

CrossRef Cited-by

CrossRef citations1

1. So-Won Jang, Hwan Hee Yu, Jong-Chan Kim, Mi Jang. (2026). Optimizing brown rice liquefaction and saccharification using response surface methodology for grain ethanol production. Scientific Reports, 16(1) https://doi.org/10.1038/s41598-026-40430-9.

Dimensions

PlumX

Visitas a la página del resumen del artículo

427

Descargas

Los datos de descargas todavía no están disponibles.