


Publicado
COMPOSITIONAL KRIGING APPLIED TO THE RESERVE ESTIMATION OF A GRANITE DEPOSIT
Palabras clave:
compositional kriging, cokriging, fuzzy kriging, granite, quality estimation. (es)
COMPOSITIONAL KRIGING APPLIED TO THE RESERVE ESTIMATION OF A GRANITE DEPOSIT
TÉCNICAS DE KRIGEADO COMPOSICIONAL PARA LA ESTIMACIÓN DE RESERVAS EN UN DEPÓSITO DE GRANITO
ÁNGELES SAAVEDRA
Universidad de Vigo, Campus
Lagoas-Marcosende, Vigo-Spain, saavedra@uvigo.es
CELESTINO ORDÓÑEZ
Universidad de Vigo, Campus
Lagoas-Marcosende, Vigo-Spain, cgalan@uvigo.es
JAVIER TABOADA
Universidad de Vigo, Campus
Lagoas-Marcosende, Vigo-Spain, jtaboada@uvigo.es
JULIA ARMESTO
Universidad de Vigo, Campus
Lagoas-Marcosende, Vigo-Spain, julia@uvigo.es
Received for review May 26 th, 2009, accepted December 6 th, 2009, final version December 21th, 2009
ABSTRACT: Making an accurate estimate of quality distribution in a granite deposit is essential, both from a financial point of view, to determine the profitability of the site, and from an environmental perspective, to focus operations on the most profitable areas thereby reducing the extent of land affected by such work. Granite is extracted in blocks whose profitability and value depend on the final size of the slabs, which is an important factor in defining quality. This article uses a variant of disjunctive kriging in order to determine the quality of granite in one of the largest reserves in the worldthe Porriño deposit located in northwest Spain. This method, unlike classical disjunctive kriging, considers random variables that are not necessarily binary. The advantage of using this technique compared to the classical statistical cokriging technique is that all the qualities are considered as variables with the same importance and that the sum of quality percentages in a block is one hundred percent. The validity of the method was tested in a cross-validation process. The results compared favourably with those obtained using ordinary cokriging and fuzzy kriging.
KEYWORDS: compositional kriging, cokriging, fuzzy kriging, granite, quality estimation.
RESUMEN: Realizar una estimación precisa de la distribución del granito por calidades en un yacimiento es fundamental, tanto desde el punto de vista económico, para determinar la rentabilidad del yacimiento, como ambiental, para dirigir las labores de extracción exclusivamente a las zonas más rentables, reduciendo así la extensión de los terrenos afectados por dichas labores. El granito es extraído en bloques cuya utilidad y precio dependen del tamaño final de roca que se puede extraer de los mismos, que es el factor que define la calidad. En este artículo se utiliza una variante del krigeado disyuntivo para determinar las reservas de granito por calidades en el yacimiento de Porriño, uno de los más importantes del mundo, situado en el Noroeste de España. El método utilizado, a diferencia del krigeado disyuntivo clásico, considera variables aleatorias que no son necesariamente binarias. La ventaja de utilizar esta técnica estadística frente a las técnicas clásicas de cokriging es que todas las calidades son consideradas variables de la misma importancia y que se asegura que la suma del porcentaje de las calidades en un bloque es del cien por cien. La validez del método se ha chequeado mediante un proceso de validación cruzada. La comparación con los resultados obtenidos utilizando cokrigeado ordinario y krigeado difuso ha sido favorable para el krigeado composicional.
PALABRAS CLAVE: krigeado composicional, cokriging, krigieado difuso, granito, estimación de calidad.
1. INTRODUCTION
Granite is an ornamental rock that is widely used in roofing and for interiors (flooring, worktops, etc), given its physical, chemical and aesthetic properties. It is generally quarried from opencast pits in the form of blocks that are subsequently sawn and cut into slabs of different sizes and thicknesses according to end use.
Granite deposit reserves from data collected in the field can be evaluated using the kriging methods traditionally used in the metals mining sector [1] [2] in which the variable to be estimated is continuous. The estimation method is based on traditional research methods based on geological maps, a description of fracturing in quarry fronts and vertical information provided by borehole sampling [3]. Fracturing is the parameter that ultimately defines the commercial quality of granite. Four qualities are usually defined, depending on fracturing intensity: top quality, secondary quality (both suitable for the ornamental rock market), construction quality and aggregate quality [4] [5].
Topographical and geological maps and a characterization of the structural and textural parameters of the deposit at various levels are used to define rock quality and plan exploitation methods [6]. The fact that each block of granite extracted from the quarry may have different qualities conditions the choice of which kriging technique to use. This same problem occurs with other materials. For example, Tercan and Özcelik [7] estimated the reserves in a Turkish andesite mine, from which the rock would also be extracted in blocks that could have different qualities. These authors, however, distinguished between commercially valid and other rock using indicator kriging. Recently, fuzzy kriging has been proposed as a suitable method for evaluating reserves, as it can account for the fact that a block may contain different qualities and that the definition of qualities in the field is subject to uncertainty [8]. Nonetheless, this method has the problem of having to define membership functions that adequately represent the uncertainty in determining qualities, which are assessed in the field by geologists.
Fuzzy kriging is a generalization of traditional methods of kriging in which imprecise information is typically incorporated to accompany all the sets of sample data. These generalisations can be obtained if the spatial function is considered to be a fuzzy random function, and, applying the extension principle of Zadeh [9], kriging equations are obtained that satisfy non-bias conditions and minimum prediction variance. See [10] and [11] for a discussion on fuzzy kriging fundamentals.
In this research, the problem of determining the quantities of each quality in granite blocks is tackled differently, using a kriging technique called compositional kriging.
2. MATERIALS AND METHODS
2.1 The Porriño BatholitThe reserves estimated in this research are located in Spains most important and one of the worlds most important granite depositsthe Rosa Porriño batholith situated in the province of Pontevedra (northwest Spain). Supplying technically and aesthetically high-quality ornamental rock, the licensed area measures 6.8 km2 and a total of 39 companies operate there. A detailed description of this batholith can be found in [8]. An aerial photograph of the Porriño batholith is provided in Figure 1.
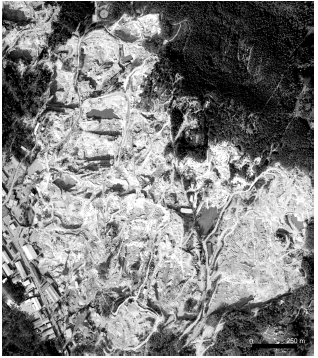
Figure
1. Aerial photograph of the Porriño batholith clearly
showing, in the lower left part, some of the warehouses used to store and
transform the granite
Given the size of the batholith and the textural homogeneity of the rock, this deposit is expected to be profitable for a considerable period of time (over 30 years). Nonetheless, it is clear that as greater depths are reached in the deposit, its capacity for supporting all the companies operating there will be diminished and mergers are therefore likely. It is thus important to make an accurate estimate of the reserves to enable medium-term decision making by the companies.
The rock is cut using diamond wire, which conditions the size of the primary block (10 m×10 m×10 m, i.e., 1000 m3). The block is then further cut, using diamond wire, perforation and shape blasting, to obtain commercially sized slabs.
Depending on the degree of fracturing, qualities are assigned, with each 1000- m3 block capable of representing different qualities. Four granite qualities are defined as follows:
- Quality 1: Rock that can be extracted in volumes that are sufficiently large to be able to obtain slabs for cutting with disk saws, in other words, rock with few fissures and yielding blocks of 6 to 12 m3.
- Quality 2: Rock that produces blocks of less than 6 m3 but still suitable for sawing, with discontinuity spacing of over 2 m.
- Quality 3: Fractured rock that produces semi-blocks (less than 4 m3), with discontinuity spacing of less than 2 m.
- Quality 4: Fractured rock with market value only as aggregate.
Knowing the quality of each block prior to cutting is clearly important, as it enables more realistic financial forecasting and more rational exploitation in the medium-to-long term.
2.2 Reserve evaluation
2.2.1 Data collection
For the
documentation and field data-collection phase, the mining parameter of interest
for defining rock quality (and therefore for estimating reserves) was the level
of rock mass fracturing, given that textural featuressuch as grain
heterogeneity and the presence of phenocrystals, weathering bands or black
knotshave little bearing on the quality of a granite as homogeneous as that of
the studied deposit. The fractures in the exploitable area were assessed on the
basis of the following:
- A map to scale 1:3,500 that included topographical and geological details and information on fractures. Fractures were directly observed at outcrops and represented on the map.
- A description of seven continuous core boreholes (total perforation 304.35 m) furnishing vertical information on the non-accessible parts of the deposit.
- A description of the fractures obtained from profiles of the areas being exploited.
The fractures were characterized according to direction, dip, spacing, opening, filling and roughness, for a total of 312 diaclases and 41 faults.
Figure 2 depicts the map of granite qualities and a number of profiles obtained at outcrops (P1 to P6). Along with the borehole data, this information was the basic input to the study.

Figure 2. Map of granite qualities constructed from outcrops. Darker tones
correspond to higher qualities of granite. White circles represent the location
of the boreholes
Composite data are a set of non-negative vectors such that the sum of their components is a constant k. This constant is normally k = 100 when working with percentages, or k = 1 when the data is given as proportions. Denoting as
Given a sampling realization ![]() for the composite
random function
for the composite
random function ![]() , where each
, where each ![]() is a composite datum,
the aim is to infer the value of
is a composite datum,
the aim is to infer the value of ![]() for a new location of interest
for a new location of interest ![]() .
.
Classical
spatial statistical methods enable forecasting using kriging and the variables ![]() , according to
, according to ![]() , or using cokriging and the entire set of variables
, or using cokriging and the entire set of variables ![]() , in accordance with the expression
, in accordance with the expression ![]() . However, it is a demonstrated fact that neither of these
prediction methods is guaranteed to preserve the particularities of the
composite data. See [12] and [13] for a more detailed explanation of these
classical prediction methods.
. However, it is a demonstrated fact that neither of these
prediction methods is guaranteed to preserve the particularities of the
composite data. See [12] and [13] for a more detailed explanation of these
classical prediction methods.
Walvoort
and de Gruijter [14] proposed a prediction method based on classical
approaches. These authors included in the matrix system the constraints
necessary for the predictions to take values that would be admissible in the
composite random function. Other authors [15] proposed a transformation of the
sample data ![]() before applying any of
the spatial prediction methods in order to obtain
before applying any of
the spatial prediction methods in order to obtain![]() . If the function f has been correctly selected, admissible composite data can be obtained by
inverting the transformation:
. If the function f has been correctly selected, admissible composite data can be obtained by
inverting the transformation: ![]() .
.
For this
research we implemented a compositional kriging method based on the methodology
developed by Tolosana-Delgado [16] and
Tolosana-Delgado et al. [17]. This procedure can be viewed as a generalization
of the log-normal and normal kriging techniques in ![]() .
.
The subset ![]() of
of ![]() formed of non-negative
vectors and verifying that the sum of their components is one, can be equipped
with the inner sum, external product and scalar product operations:
formed of non-negative
vectors and verifying that the sum of their components is one, can be equipped
with the inner sum, external product and scalar product operations: ![]() . The space, called a Simplex, is a Euclidean
. The space, called a Simplex, is a Euclidean ![]() -dimensional space. Tolosana-Delgado [16] demonstrated that
the kriging techniques can be generalized to the Euclidean simplex space and
that optimal predictors can be obtained for random functions whose sample
spaces are contained in a simplex. Another interesting fact is that a Euclidean
space allows the selection of an orthonormal base, the calculation of the real
coordinates of the elements in the simplex space with respect to this base, and
the application of classical prediction methods. Changing the coordinates, the
predictions can be expressed as elements in the original Euclidean space (i.e.,
the simplex). Furthermore, the equivalence between obtaining the predictors in
the simplex space and calculating predictors based on changing the variable
using an orthonormal base has been demonstrated. It can also be demonstrated
that compositional kriging is the optimal predictor since it minimizes the
expected Aitchinson distance between the true composition
-dimensional space. Tolosana-Delgado [16] demonstrated that
the kriging techniques can be generalized to the Euclidean simplex space and
that optimal predictors can be obtained for random functions whose sample
spaces are contained in a simplex. Another interesting fact is that a Euclidean
space allows the selection of an orthonormal base, the calculation of the real
coordinates of the elements in the simplex space with respect to this base, and
the application of classical prediction methods. Changing the coordinates, the
predictions can be expressed as elements in the original Euclidean space (i.e.,
the simplex). Furthermore, the equivalence between obtaining the predictors in
the simplex space and calculating predictors based on changing the variable
using an orthonormal base has been demonstrated. It can also be demonstrated
that compositional kriging is the optimal predictor since it minimizes the
expected Aitchinson distance between the true composition ![]() and its prediction
and its prediction ![]() [16].
[16].
The procedure can be briefly summarized as follows:
a) The
sample space of the composite data, contained in ![]() , is transformed by means of a change of coordinates in a new
dimension space
, is transformed by means of a change of coordinates in a new
dimension space ![]() :
:
![]()
where ![]() is the
coordinate-change matrix, of dimension
is the
coordinate-change matrix, of dimension ![]() , formed of the vectors of the orthonormal base arranged in
columns,
, formed of the vectors of the orthonormal base arranged in
columns, ![]() ,
, ![]() , and where the superscript
, and where the superscript ![]() means transposed.
means transposed.
(b) Obtained
in the Euclidean space ![]() using traditional
cokriging techniques is the prediction
using traditional
cokriging techniques is the prediction ![]() .
.
c) The
value of the prediction,![]() is given by:
is given by:
![]()
with
![]()
a normalization operator. This methodology ensures admissible composite predictions.
For point (b) above, semivariograms, ![]() and
and ![]() cross-semivariograms,
cross-semivariograms, ![]() , have to be calculated and fitted. The theoretical models
selected to model the experimental semivariograms should verify that the
variance of any linear combination of these variables is always non-negative.
Put another way, it should be ensured that the prediction variance is always
non-negative. To resolve this problem of model selection, the linear
co-regionalization model is usually used. To ensure that the variance of any linear
combination of the variables
, have to be calculated and fitted. The theoretical models
selected to model the experimental semivariograms should verify that the
variance of any linear combination of these variables is always non-negative.
Put another way, it should be ensured that the prediction variance is always
non-negative. To resolve this problem of model selection, the linear
co-regionalization model is usually used. To ensure that the variance of any linear
combination of the variables ![]() is always
non-negative, the coefficients of the semivariograms cannot be chosen randomly
but must have certain conditions verified, and this affects the process of
fitting the theoretical models. See [17], [18] and [19] for a more detailed
discussion on the linear co-regionalization model.
is always
non-negative, the coefficients of the semivariograms cannot be chosen randomly
but must have certain conditions verified, and this affects the process of
fitting the theoretical models. See [17], [18] and [19] for a more detailed
discussion on the linear co-regionalization model.
Following
the structural analysis stage, in which the experimental semivariograms are
suitably estimated, cokriging systems are used to estimate the random function ![]()
A detailed description of the compositional kriging algorithm can be found in [20].
3. RESULTS
The composite
data used in this study consists of a set of n = 35,543 values such that its p = 4 components added up to one. Given an orthonormal base for a vector space of
dimension p -1 = 3, ![]() , the coordinate-change matrix was constructed by arranging
the base elements in columns:
, the coordinate-change matrix was constructed by arranging
the base elements in columns: ![]() . Following a study of the principal components of the sample
data, we obtained the orthogonal base that determined the main directions of
variability in the observations. This base, previously normalized, constituted
the orthonormal base that would give rise to the matrix
. Following a study of the principal components of the sample
data, we obtained the orthogonal base that determined the main directions of
variability in the observations. This base, previously normalized, constituted
the orthonormal base that would give rise to the matrix ![]() . As can be confirmed in [16], the choice of the orthonormal
base has no great bearing on the final results. However, choosing directions
close to maximum variability aims to reflect as best as possible underlying
behaviour in terms of granite quality proportions. The orthonormal base was
thus formed of the following vectors:
. As can be confirmed in [16], the choice of the orthonormal
base has no great bearing on the final results. However, choosing directions
close to maximum variability aims to reflect as best as possible underlying
behaviour in terms of granite quality proportions. The orthonormal base was
thus formed of the following vectors:

Given that
several components with zero value were recorded in the sample data, a positive
constant was added in prior to changing the coordinates ![]() . It should be borne in mind that adding a constant to the
data to avoid zero values might introduce some subjectivity in the results
since any error in the kriging or variance estimations is exponentially
magnified.
. It should be borne in mind that adding a constant to the
data to avoid zero values might introduce some subjectivity in the results
since any error in the kriging or variance estimations is exponentially
magnified.
In order to
fit the linear co-regionalization model, used were ![]() incorrelated variables
with the following characteristics:
incorrelated variables
with the following characteristics: ![]() pure nugget effect
semivariogram with partial sill 1 and
pure nugget effect
semivariogram with partial sill 1 and ![]() spherical semivariogram with range = 280 m and partial sill
1. The coefficients
spherical semivariogram with range = 280 m and partial sill
1. The coefficients ![]() that complete the
models were fitted using the R freeware [21].
that complete the
models were fitted using the R freeware [21].
Finally,
using cokriging techniques we obtained the predictions ![]() and, after suitable
transformation, the composite predictions
and, after suitable
transformation, the composite predictions ![]() .
.
Figure 3 shows a map of the granite qualities estimated using composite kriging. The map corresponds to a height above sea level of 205 meters. It can be seen that quality 4 is the predominant.

Figure
3. Maps showing the granite quality obtained using
compositional kriging for a height above sea level of 205 meters. Each map
corresponds to one of the qualities. Darker tones represent a higher quantity
of granite for that quality
The
compositional kriging described earlier was validated using a cross-validation
procedure. An element was removed from the sample,![]() , and the prediction
, and the prediction ![]() was calculated using
the remaining data. The squared errors of the prediction were obtained for each
quality proportion as
was calculated using
the remaining data. The squared errors of the prediction were obtained for each
quality proportion as ![]() . These values are a good indicator of the efficacy of the
prediction method. Table 1 shows descriptive coefficients calculated for the
squared prediction errors and obtained by means of cross-validation. Note that
. These values are a good indicator of the efficacy of the
prediction method. Table 1 shows descriptive coefficients calculated for the
squared prediction errors and obtained by means of cross-validation. Note that ![]() , given that the composite data reflect the proportions for
the different qualities observed in each block.
, given that the composite data reflect the proportions for
the different qualities observed in each block.
Table
1. Mean squared
errors and corresponding standard deviations calculated for each granite
quality by means of cross-validation

These results were somewhat improved in comparison with those obtained using ordinary cokriging and adjusting the results to obtain non negative and constant sum constraints of compositional data. The mean squared errors were 0.014, 0.025, 0.021 and 0.036 for quality 1 to quality 4, respectively. The standard deviations were 0.051, 0.055, 0.052 and 0.089, respectively.
Taboada et al. [8] described a fuzzy kriging study performed using the same database. In their study, the mean squared errors obtained in a cross-validation procedure were 0.021, 0.039, 0.053 and 0.037 for quality 1 (top quality) to quality 4 (aggregate quality), respectively. The improvement in our research is evident, as the means have been reduced by values between 18.9% (quality 3) and 79.2% (quality 3).
4. CONCLUSIONES
In this research we estimated the reserves in one of the worlds most important granite deposits, which sustains a large number of companies and provides employment for a significant number of people. Knowledge of the volume of reserves and distribution in terms of different quality grades is crucial to be able to implement rational exploitation over time and ensure the quarrys viability in the medium and long term. The estimation method used in this researchcompositional krigingtakes account of the fact that each block extracted from the quarry is likely to contain granite of different qualities, and, unlike other prediction methodssuch as classical cokrigingensures that the sum of the different qualities is 100% for each block. Although at first sight the method may appear to be complex, it is easily implemented in high-level language programs like R.
The results obtained indicate that the method is an improvement over other geostatistical methods, specifically, ordinary cokriging and fuzzy kriging. Any improvement in techniques to estimate qualities in granite blocks is of relevance for the companies quarrying the granite, as there are significant differences in price for the different quality grades.
REFERENCIAS
[1] ARMSTRONG, M. AND BOUFASSA, A. Comparing the robustness of ordinary kriging and lognormal kriging: Outlier resistance, Mathematical Geology, 20, 447-457, 1988.
[2] TABOADA, J., VAAMONDE, A. AND SAAVEDRA A. Evaluation of the quality of a granite quarry, Engineering Geology, 53, 1-11, 1999.
[3] TOYOS, J.M., TABOADA, J., LOMBARDERO, M., ROMERO, J.A AND MENÉNDEZ, A. Estudio de las discontinuidades en yacimientos de roca ornamental. Boletín Geológico y Minero, 105, 110-118, 1994.
[4] TABOADA, J., ALEJANO, L., BASTANTE, F.G. AND ORDÓÑEZ, C. Total exploitation of an ornamental granite quarry. Materiales de Construcción 55, 67-78, 2004.
[5] SOUSA, L.M. Granite fracture index to check suitability of granite outcrops for quarrying. Engineering Geology 92, 146-159, 2007.
[6] MUÑOZ DE LA NAVA, P, ROMERO ESCUDERO, J.A., RODRÍGUEZ SUÁREZ, I., GARCÍA ROMERO, ET., CRESPO ROSA, A., CARRIÓN MOLES, F. AND GARBAYO, M.P. Metodología de investigación de rocas ornamentales: granitos. Boletín Geológico y Minero, 100, 433-453, 1989.
[7] TERCAN, A.E. AND ÖZÇELIK, Y. Geostatistical Evaluation of Dimension-Stone Quarries. Engineering Geology, 58, 25-33, 2000.
[8] TABOADA, J., RIVAS, T., SAAVEDRA, A., ORDÓÑEZ, C., BASTANTE, F.G. AND GIRÁLDEZ, E. Evaluation of the reserve of a granite deposit by fuzzy kriging. Engineering Geology, 99, 23-30, 2008.
[9] KLIR, G., AND YUAN, B. Fuzzy sets and fuzzy logic. Prentice-Hall, New York, 1995.
[10] DIAMOND, P.. Fuzzy kriging. Fuzzy Sets and Systems, 33, 315-332, 1989.
[11] BARDOSSY, A., BOGARDI, I., AND KELLY, W. Geostatistics utilizing imprecise (fuzzy) information. Fuzzy Sets and Systems, 31, 311-327, 1989.
[12] CHILÉS, J.P., AND DELFINER, P. Geostatistics: modeling spatial uncertainty, John Wiley and Sons, New York, 1999.
[13] RIVOIRDAD, J. Introduction to disjunctive kriging and nonlinear geostatistics, Clarendom Press, Oxford, 1999.
[14] WALVOORT, D.J.J. AND DE GRUIJTER, J.J. Compositional Kriging: A Spatial Interpolation Method for Compositional Data. Mathematical Geology, 33, 951-966, 2001.
[15] PAWLOWSKY-GLAHN, V. AND OLEA, R.A. Geostatistical Analysis of Compositional Data. Studies in Mathematical Geology, Nº 7. Oxford University Press, 2004.
[16] TOLOSANA-DELGADO, R. Geostatistics for constrained variables: positive data, compositions and probabilites. Application to environmental hazard monitoring [PhD thesis] , Universidad de Gerona, 2006.
[17] TOLOSANA-DELGADO, R, PAWLOWSKY-GLAHN, V, EGOZCUE, J.J. AND VAN DEN BOOGAART, K.G. A Compositional Approach to Indicator Kriging. Proceedings of IAMG05: GIS and Spatial Analysis, Vol.1, 651-656, 2005.
[18] CRESIE, N. AC. Statistics for spatial data. John Wiley and Sons, New York, 1999.
[19] GOULARD, M. AND VOLTZ, M. Linear coregionalization model: Tools for estimation and choice of cross-variogram matrix, Mathematical Geology, 24, 269-286, 1992.
[20] VAN DEN BOOGAARTA, K.G. AND TOLOSANA-DELGADO. R. Compositions: A unified R package to analyze compositional data. Computers and Geosciences, 34, 320-338, 2008.
[21] R DEVELOPMENT CORE TEAM. R: A language and environment for statistical computing. R Foundation for Statistical Computing, Vienna, Austria . Available: http://www.R-project.org [cited December 25, 2009] .
Cómo citar
IEEE
ACM
ACS
APA
ABNT
Chicago
Harvard
MLA
Turabian
Vancouver
Descargar cita
Visitas a la página del resumen del artículo
Descargas
Licencia
Derechos de autor 2010 DYNA

Esta obra está bajo una licencia internacional Creative Commons Atribución-NoComercial-SinDerivadas 4.0.
El autor o autores de un artículo aceptado para publicación en cualquiera de las revistas editadas por la facultad de Minas cederán la totalidad de los derechos patrimoniales a la Universidad Nacional de Colombia de manera gratuita, dentro de los cuáles se incluyen: el derecho a editar, publicar, reproducir y distribuir tanto en medios impresos como digitales, además de incluir en artículo en índices internacionales y/o bases de datos, de igual manera, se faculta a la editorial para utilizar las imágenes, tablas y/o cualquier material gráfico presentado en el artículo para el diseño de carátulas o posters de la misma revista.


