


Publicado
Efficient reconstruction of Raman spectroscopy imaging based on compressive sensing
Reconstrucción eficiente de imágenes a partir de espectroscopia Raman basada en la técnica de sensado compresivo
DOI:
https://doi.org/10.15446/dyna.v81n188.41162Palabras clave:
Raman Spectroscopy, Spectral Imaging, Compressed Sensing, Coded Aperture. (en)Espectroscopia Raman, Imágenes Espectrales, Sensado Compresivo, Aperturas Codificadas. (es)
Descargas
https://doi.org/10.15446/dyna.v81n188.41162
Efficient reconstruction of Raman spectroscopy imaging based on compressive sensing
Reconstrucción eficiente de imágenes a partir de espectroscopia Raman basada en la técnica de sensado compresivo
Diana Fernanda Galvis-Carreño a, Yuri Hercilia Mejía-Melgarejo b & Henry Arguello-Fuentes c
a, Escuela de Ingeniería Química, Universidad Industrial de Santander.
Bucaramanga, Colombia. diana.galvis1@correo.uis.edu.co
b Escuela de Ingenierías Eléctrica,
Electrónica y de Telecomunicaciones, Universidad Industrial de Santander.
Bucaramanga, Colombia. yuri.mejia@correo.uis.edu.co
c Escuela de Ingeniería de Sistemas e Informática, Universidad
Industrial de Santander. Bucaramanga,
Colombia. henarfu@uis.edu.co
Received: December 12th, 2013.Received in revised form: March 10th, 2014.Accepted: September 25th, 2014.
Abstract
Raman Spectroscopy Imaging requires long periods of time
for the data acquisition and subsequent treatment of the spectral chemical
images. Recently, Compressed Sensing (CS) technique has been used
satisfactorily in Raman Spectroscopy Imaging, reducing the acquisition time by
simultaneously sensing and compressing the underlying Raman spectral signals.
The Coded Aperture Snapshot Spectral Imager (CASSI) is an optical architecture
that applied effectively the CS technique in Raman Spectroscopy Imaging. The
main optical element of CASSI system is a coded aperture, which can transmit or
block the information from the underlying scene. The principal design variable
in the coded apertures is the percentage of transmissive elements or
transmittance. This paper describes the technique of CS in Raman Spectroscopy
imaging by using the CASSI system and realizes the selection of the optimal
transmittance values of the coded apertures to ensure an efficient recovery of
Raman Images. Diverse simulations are performed to determine the Peak Signal to
Noise Ratio (PSNR) of the reconstructed Raman data cubes as a function of the
transmittance of the coded apertures, the size of the underlying Raman data
cubes and the number of projections expressed in terms of the compression
ratio.
Keywords: Raman Spectroscopy; Spectral Imaging; Compressed Sensing; Coded Aperture.
Resumen
La
Espectroscopia Raman de Imágenes requiere largos periodos de tiempo en la
adquisición como en el tratamiento de datos para la construcción de imágenes
químicas. Para reducir el tiempo se ha empleado la técnica de Sensado Compresivo
(SC) gracias a la detección y compresión simultánea de las señales. El sistema
de adquisición de imágenes basado en una apertura codificada (CASSI) es una
arquitectura óptica que aplica de manera eficiente los conceptos de SC. El
principal elemento del sistema CASSI es una apertura codificada, la cual puede
ser vista como un filtro que transmite o bloquea información de una escena. El
porcentaje de elementos transmisores es conocido como la transmitancia y esta
es una variable de diseño. Este trabajo describe la técnica de SC aplicada a la
Espectroscopia Raman de Imágenes empleando el sistema CASSI y realiza la
selección de los valores óptimos de transmitancia que garantizan una eficiente
reconstrucción de imágenes. Se realizaron diversas simulaciones para determinar
la relación señal a ruido (PSNR) de la reconstrucción de un cubo de datos Raman
como función de la transmitancia, el tamaño del cubo y el número de capturas
expresadas en términos de la relación de compresión.
Palabras clave: Espectroscopia Raman; Imágenes Espectrales; Sensado Compresivo; Aperturas Codificadas.
1. Introduction
Spectral imaging is a technology that can obtain the spatial map of spectral variations of a scene; these spatial maps are useful in many applications including military target discrimination, biomedical, biochemical, agriculture, mineralogy, biophysics, environmental remote sensing, among others [1-3]. Different spectroscopic techniques can be employed to obtain this kind of images for determining relevant chemical information.
Raman Spectroscopy is currently one of the most used analytical techniques in several areas of modern science and it is used to analyze chemical composition and construction of spectral images of different compounds [4-6]. Raman analysis presents the relevant advantage of being a noninvasive technique, not requiring the addition of chemical agents or labels for the sample identification, and it has a relative low cost compared with other spectroscopy techniques. Furthermore, there is extensive information in the literature regarding this technique [7, 8].
Currently, Raman Spectroscopy Imaging emerges as a tool to create chemical images of the distribution of the components from simultaneous measurement of spectra and spatial information. Raman chemical images can be obtained through subsequent measurements of several sample points and a reconstruction process. These images are useful to chemical identification and classification [5,9].
Despite the broad
advantages and applications of this technique, it requires long periods of time
for the data acquisition and subsequent treatment for spectral images. More
specifically, typically spectral detection methods requires in the order of  per
spectrum which is impractical for the collection of large spectral images. For
example, the collection of 1 megapixel image would require
per
spectrum which is impractical for the collection of large spectral images. For
example, the collection of 1 megapixel image would require  or
or  days [8]. For this reason, various studies and
modifications have been made on the optical architecture of Raman Spectroscopy
Imaging.
days [8]. For this reason, various studies and
modifications have been made on the optical architecture of Raman Spectroscopy
Imaging.
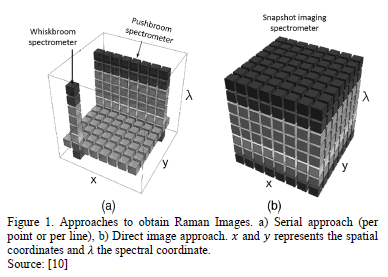
There are two general approaches to obtain Raman Images: serial and direct
imaging. The serial imaging approach as point (whiskbroom spectrometer) and
line (pushbroom spectrometer) Raman mapping, requires numerous spectra for
reconstructing the entire Raman image at a given wavenumber. In point mapping,
a laser spot is raster scanned, in two spatial dimensions  with a
spectrum being recorded at each
with a
spectrum being recorded at each  position;
the entire Raman spectrum is obtained at each point. For line mapping, a laser
line is raster scanned along either the
position;
the entire Raman spectrum is obtained at each point. For line mapping, a laser
line is raster scanned along either the  or
or  axis, using
a two- dimensional charge-coupled device detector to collect the spectral and
spatial information; the entire Raman spectrum is obtained at each line. In
contrast, in direct approach (snapshot imaging spectrometer) all spatial points
of the Raman image at a specific wavenumber are determined simultaneously from
a single measurement of a globally illuminated sample. Between the named
methodologies, the number of data obtained during the sensing varies
considerably and even in the case of direct imaging, the data processing takes
considerable time for the formation of the spectral images [9,10]. Fig. 1 shows the above mentioned approaches.
axis, using
a two- dimensional charge-coupled device detector to collect the spectral and
spatial information; the entire Raman spectrum is obtained at each line. In
contrast, in direct approach (snapshot imaging spectrometer) all spatial points
of the Raman image at a specific wavenumber are determined simultaneously from
a single measurement of a globally illuminated sample. Between the named
methodologies, the number of data obtained during the sensing varies
considerably and even in the case of direct imaging, the data processing takes
considerable time for the formation of the spectral images [9,10]. Fig. 1 shows the above mentioned approaches.
An innovative alternative to reduce the time of acquisition and processing of the signals obtained from Raman Spectroscopy is to employ the Compressed Sensing (CS) technique. Different studies have shown that this technique can be used satisfactorily in Raman Spectroscopy Imaging [4, 6]. CS efficiently reduces the acquisition time by simultaneously sensing and compressing the underlying spectral signals. Instead of sensing directly the spectral signal, CS senses random projections. These projections are then used to recover the underlying Raman spectral signal by solving a minimization problem [11,12].
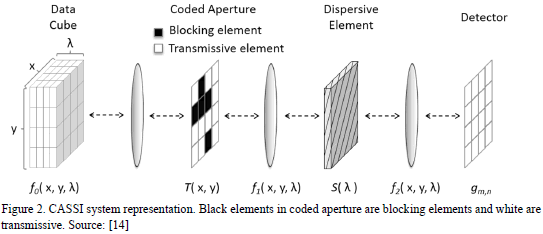
Different architectures for obtaining spectral images based on Raman Spectroscopy have been developed under the concepts of Compressed Sensing technique [13]. The Coded Aperture Snapshot Spectral Imager (CASSI) system is a remarkable optical architecture that effectively exploits CS principles in Raman Spectroscopy Imaging [6]. In CASSI the coded measurements captured by the detector are mathematically equivalent to compressive random projections in CS.
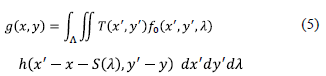
In CASSI system, the coding is applied to the
(spatial-spectral) Raman image source density  by means of a coded aperture
  as realized by the CASSI system depicted in
Fig. 2, where
as realized by the CASSI system depicted in
Fig. 2, where  are the spatial coordinates and
  is the Raman shift [14]. The resulting coded
field
is the Raman shift [14]. The resulting coded
field  is subsequently modified by a dispersive
element before it impinges onto the detector. The compressive measurements
across the detector are realized by the integration of the field
is subsequently modified by a dispersive
element before it impinges onto the detector. The compressive measurements
across the detector are realized by the integration of the field  over the spectral
range sensitivity of the detector. The recovery of the underlying hyperspectral signal in CASSI entails solving an undetermined linear system of equations. The
quality of the CS Raman reconstructions depends on the correct selection of the
coded aperture patterns .
For this reason, the most important component in CASSI Raman system is a set of
coded apertures, which need to be properly designed taking in account variables
as the percentage of transmissive elements of the coded aperture or
transmittance, the Raman data cube size and the number of projections expressed
in terms of the compression ratio.
over the spectral
range sensitivity of the detector. The recovery of the underlying hyperspectral signal in CASSI entails solving an undetermined linear system of equations. The
quality of the CS Raman reconstructions depends on the correct selection of the
coded aperture patterns .
For this reason, the most important component in CASSI Raman system is a set of
coded apertures, which need to be properly designed taking in account variables
as the percentage of transmissive elements of the coded aperture or
transmittance, the Raman data cube size and the number of projections expressed
in terms of the compression ratio.
Using the compressive sensing by CASSI system in Raman Spectroscopy Imaging the time of acquisition and signal processing is reduced significantly, opening a broad range of applications of this technique in different scientific areas, including biomedical, chemical, biochemical, environmental, among others.
This paper describes the technique of CS in Raman Spectroscopy Imaging by using the Coded Aperture Snapshot Spectral Imager (CASSI) and realizes the selection of the optimal transmittance values in the coded apertures needed in this system. The main contribution of this work is to design the optimal transmittance values of the coded apertures, which allow an efficient Raman image reconstruction.
Diverse simulations in MatLab are performed to determine the Peak Signal to Noise Ratio (PSNR) of the reconstructed Raman data cubes. The spatial and spectral analyses of the reconstructions allow establishing optimal values of transmittance of the coded aperture as a function of the size of the underlying Raman data cubes and the compression ratio.
2. Raman spectroscopy
Raman Spectroscopy analysis is based on the study of light scattered by a material when a beam of monochromatic light is incident on the underlying material [15]. The interaction of the electric field of an electromagnetic wave with the electrons interacting with the system leads to the scattering of incident light.
The scattering process is show in Fig. 3. Most of the
light scatters of the same energy of the incident beam,  .
This energy light is said to be elastically or Rayleigh scattered and it does
not provide information about the sample. Valuable information can be obtained
from the light that changes energy upon scattering,
.
This energy light is said to be elastically or Rayleigh scattered and it does
not provide information about the sample. Valuable information can be obtained
from the light that changes energy upon scattering,  (where
  is related with the energy of the sample).
This light is said to be inelastically or Raman scattered. If the scattered
light loses energy
is related with the energy of the sample).
This light is said to be inelastically or Raman scattered. If the scattered
light loses energy  ,
it emerges at a longer wavelength and this effect is known as Raman Stokes. The
light can scatter with an increase of energy,
,
it emerges at a longer wavelength and this effect is known as Raman Stokes. The
light can scatter with an increase of energy,  ,
and concomitant shorter wavelength and this is called the Raman anti-Stokes
effect. The change in the wavelength of the light (to either longer or shorter
wavelength) is known as the Raman shift.
,
and concomitant shorter wavelength and this is called the Raman anti-Stokes
effect. The change in the wavelength of the light (to either longer or shorter
wavelength) is known as the Raman shift.
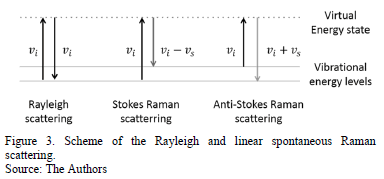
Frequency variations seen in Raman scattering phenomenon are equivalents to energy variations (Fig. 3).
Because of light-material interaction, the molecules may become temporarily to a virtual energy state that must return to an allowed vibrational energy level, this is done by scattering a beam of light. The frequency at which the beam is scattered depends on the energetic jump performed for the molecule. Because the energy level of a molecule depends crucially on the composition of this, the spectrum of Raman shifts is a highly specific "fingerprint" of the internal energy level structure. As such, it can be used for extremely precise chemical detection and identification.
Recently, Raman Spectroscopy Imaging has emerged from the Raman Spectroscopy technique as a new modality which enables real time, noninvasive, high-resolution imaging to probing the chemical composition of materials with no sample preparation. Thousands of Raman spectrums are acquired from all over the field of view to created chemical images. These chemical images, as functions of Raman intensity and spatial coordinates, allow an assessment of the chemical heterogeneity of a specimen in terms of the spatial distribution of the sample and its underlying molecular constituents [9, 16].
Applications of Raman Imaging techniques cover a wide range of scientific disciplines spanning biology, medicine, and material sciences, as for example, in the analysis of cells, tissues, pharmaceuticals, semiconductors, polymers, artwork, and minerals [17,18].
3. Compressive sensing
Compressive sensing has emerged as a promising research area that can enable the acquisition of signals at sampling rates below the Nyquist- criterion or the equivalently scanning methods. In CS traditional sampling is replaced by measurements of inner products with random vectors. The signals are then reconstructed by solving an inverse problem such as a linear program or a greedy pursuit in a basis where these admit sparse representations [11,19].
One of the key concepts in compressed sensing is called
sparsity. This concept establishes that most of the energy of a signal is
concentrated in a small set of its components. Most real signals are not sparse
themselves, however, one can find a sparse representation in a given basis [11,
19]. In general, spectral signal can be expressed as  being
being  a basis representation matrix, with
  ,
where
,
where  represents the size of the spectral signal or
data cube
represents the size of the spectral signal or
data cube  and being
  the representations coefficients of in domain
  [14, 21].
4. Coded Aperture Snapshot Spectral Raman Imaging System
The Coded Aperture Snapshot Spectral Imager (CASSI) architecture implements CS in spectral Raman Imaging [6]. The CASSI first introduced in [2], is a remarkable imaging architecture that effectively senses the three dimensional (3D) spectral information of a scene, using a single 2D coded random projections measurements.
Projections in CASSI
are attained using a coded aperture and a dispersive element. The principal
components in CASSI are illustrated in Fig. 2. The mathematical model of the
CASSI system has been extensively studied in [2,22]. Suppose that the power spectral
density of the image of the scene formed by the objective lens at the plane of
the coded aperture is denoted by  where and index the
spatial coordinates and indexes
Raman spectrum or Raman Shift. Referring to Fig. 2 and denoting the coded
aperture transmission function by , the power spectral density immediately after
spatially modulated by the coded aperture is
where and index the
spatial coordinates and indexes
Raman spectrum or Raman Shift. Referring to Fig. 2 and denoting the coded
aperture transmission function by , the power spectral density immediately after
spatially modulated by the coded aperture is

Formally the transference function of the coded aperture  is designed as an array of square features
(pixels) with size equal to the Focal Plane Array (FPA) detector pixels
is designed as an array of square features
(pixels) with size equal to the Focal Plane Array (FPA) detector pixels  .
.  can
be described as
can
be described as

where  represents the rectangular step function
accounting for the features shape and
represents the rectangular step function
accounting for the features shape and  represents the binary value (blocking or
transmissive) at the
represents the binary value (blocking or
transmissive) at the  element with 1 representing a transmissive coded element and
a 0 representing a blocking code element.
element with 1 representing a transmissive coded element and
a 0 representing a blocking code element.
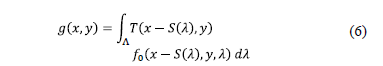
After propagation through relay optic lens and the dispersive element, the power spectral density in front of the detector is given by
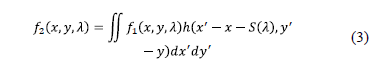
where  represents the relay lenses and the
dispersive element operation, and
represents the relay lenses and the
dispersive element operation, and  the dispersion induced by the dispersive
element. Finally, the detector measures the intensity of the incident light
rather than the spectral density as in spectrometers. This is realized by the
integration of the power spectral density along the wavelength axis over the
FPA spectral range
the dispersion induced by the dispersive
element. Finally, the detector measures the intensity of the incident light
rather than the spectral density as in spectrometers. This is realized by the
integration of the power spectral density along the wavelength axis over the
FPA spectral range  .
Then, the measurements at the FPA are given by
.
Then, the measurements at the FPA are given by

Replacing (3) in (4) conduces to
Assuming, (i) the PSF  is shift invariant, (ii) the dispersion by the
dispersive element is linear, and (iii) that there is one-to-one mapping
between elements of the coded aperture and the detector pixels, the detector measurement
can be succinctly expressed as
is shift invariant, (ii) the dispersion by the
dispersive element is linear, and (iii) that there is one-to-one mapping
between elements of the coded aperture and the detector pixels, the detector measurement
can be succinctly expressed as
In discrete form, the measurement at the  detector pixel is given by

where L represent the number of bands of the Raman data cube. Additionally, the measurement can be expressed in matrix form as

where  is a matrix that accounts for the effects
of the coded aperture and the dispersive element, on the data cube .
is a matrix that accounts for the effects
of the coded aperture and the dispersive element, on the data cube .
For spectrally rich scenes or very detailed spatial scenes, a single shot CASSI measurement may not provide a sufficient number of compressive measurements. Increasing the number of shots multiplies the number of measurements, thus rapidly overcoming such limitations [21]. The CASSI spectral imager architecture has been extended to admit multiple measurement shots in [20,23,24]. The multiple measurements are attained as separate FPA measurements, each with a distinct coded aperture that remains fixed during the integration time of the detector. In matrix form, the mathematical model for multi-shot CASSI system is similar to that shown in eq. (8) for the CASSI system

for  ,
where
,
where  is
the number of shots. The
is
the number of shots. The  coded
aperture pattern
coded
aperture pattern  used to sense
  is different for each projection.
A typical example of the measurement process is shown in Fig. 4. This figure shows the three steps of sensing a data cube: spatial encoding, spectral shift and the integration on the detector for three shots. The multi-shot approach allows obtaining different information from the same scene as different coded patterns are used.
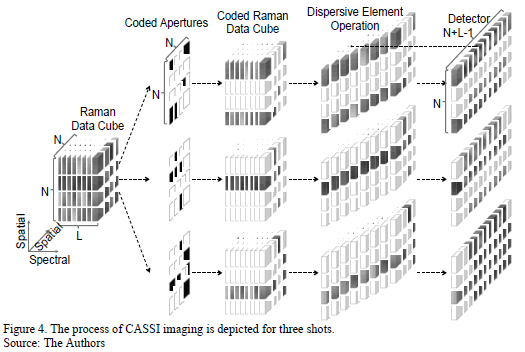
Assuming that the
Raman data cube size is as shown
in Fig. 4, the dispersive element shifted each band one pixel horizontally,
causing that the spectral modulated and dispersed image impinges on  pixels in
the detector then, the CASSI sensing matrix
pixels in
the detector then, the CASSI sensing matrix  is of size
  . Notice that, the number of the detector pixels
is smaller than the number of the voxels of the discretized 3D data cube. Thus
the compressive measurements representing by eq. (8) is an under-determined
system of equations.
. Notice that, the number of the detector pixels
is smaller than the number of the voxels of the discretized 3D data cube. Thus
the compressive measurements representing by eq. (8) is an under-determined
system of equations.
Several numerical algorithms based in a regularization framework, exploring and exploiting additional properties or structures in the data cube to obtain the image estimation.
The Gradient Projection for Sparse Reconstruction (GPSR)
method is an algorithm used for spectral image estimation with the assumption
that the signal of interest is sparse or compressible in some basis ,
where the coefficients of the data cube  in this basis are represented by .
Specifically, the Raman Data cube is represented by
in this basis are represented by .
Specifically, the Raman Data cube is represented by  and
the corresponding CASSI measurement by
and
the corresponding CASSI measurement by  .
Then the reconstruction consists on recovering such that the
.
Then the reconstruction consists on recovering such that the  cost function is minimized as

where is an S-sparse representation of on
the basis and  is a regularization constant. The
  penalty term drives small components of to zero and helps promote sparse solutions
[25].
penalty term drives small components of to zero and helps promote sparse solutions
[25].
The Two-Step Iterative Shrinkage/Thresholding algorithm or TwIST algorithm [26], is another algorithm framework used frequently in the CS literature. TwIST describes a Raman data cube as the solution to the minimization problem
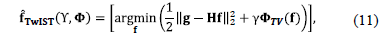
where the choices for the regularization function  include but are not limited to the norm.
Traditionally, TwIST use the total variation (TV)
regularizer given by
The TV terms penalizes
the solution candidates with higher discrete gradients horizontally and
vertically. Whit this regularizer, the TwIST estimate the Raman data cube,
corresponds to finding a compromise between the lack of fitness of a candidate
estimate to the measurement data and its degree or undesirability, given by the
penalty term .
The TV norm measures how much an image varies across
pixels, so that a highly textured or noised image will have a large TV norm,
whereas a smooth or piecewise constant image would have a small TV norm. A
tunning parameter  in eq. (11) specifies the relative weight of
the constraints versus the data fidelity term.
in eq. (11) specifies the relative weight of
the constraints versus the data fidelity term.
5. Coded aperture design
The quality of the reconstructed signal depends on the correct selection of the coded aperture used for sensing the signals. Coded apertures traditionally employed in CASSI system include, random codes, boolean codes, binary codes, the grayscale codes and Hadamard codes [27]. Boolean codes have proven to have the best results for the reconstruction of spectral images whose number bands is less than the spatial distribution of the image [28].
For the development of this work, random codes are
employed and these entries satisfy  where
where  indicates
the number of the projection, with
indicates
the number of the projection, with  representing a transmissive code element and
  representing a blocking code element.
The transmittance of the coded aperture is given by

where  represents the size of the coded aperture.
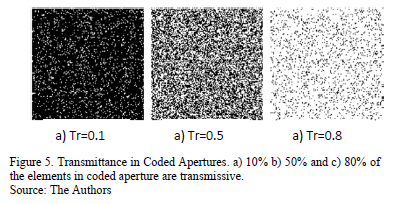
Fig. 5 shows the example of three coded apertures with transmittances of 0.1, 0.5 and 0.8 respectively. For instance, 0.1 of transmittance refers to 10% of the elements in coded aperture are transmissive and the remaining are blocking.
In addition to the transmittance, the number of the captured projections or shots affects the quality of the reconstructions. The number of shots can be expressed in terms of the compression ratio. The latter is defined as

where  represents the number of shots, and
  and
and  the spatial and spectral dimensions of the
data cube respectively. Equation (14) can be seen as the ratio between the
number of measurements and the number of pixels in the reconstructed data cube.
the spatial and spectral dimensions of the
data cube respectively. Equation (14) can be seen as the ratio between the
number of measurements and the number of pixels in the reconstructed data cube.
6. Simulations and results
To test the CASSI system
in Raman Spectroscopy, several simulations in MatLab were realized. Three
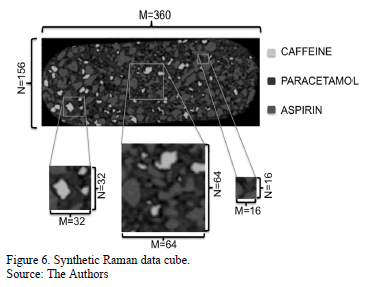
different parts of a synthetic Raman data cube with
spatial resolution of  ,
,  and
and  pixels and
with L = 1024 spectral bands were used. This data cubes are part of a
pharmaceutical tablet image; the spatial information contains three different
compounds, Aspirin, Caffeine and Paracetamol as shown the Fig. 6. The spectral
information of the synthetic data cube has the Raman spectrum of each of these
three compounds between 642 and 1665 cm-1.
pixels and
with L = 1024 spectral bands were used. This data cubes are part of a
pharmaceutical tablet image; the spatial information contains three different
compounds, Aspirin, Caffeine and Paracetamol as shown the Fig. 6. The spectral
information of the synthetic data cube has the Raman spectrum of each of these
three compounds between 642 and 1665 cm-1.
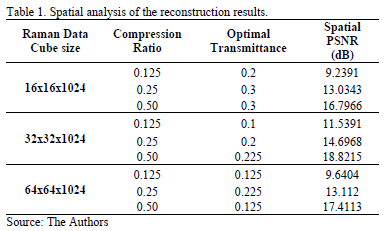
The transmittance given in eq. (13) is varying between 0.1 and 0.8 in order to determine the optimal value of this parameter. Further, the compression ratio established in eq. (14) is analyzed. Compression ratios of 0.125, 0.24 and 0.5 are employed with different coded aperture in each projection. TwIST algorithm is used for reconstructions purposes established in eq. (11). The optimal value of the regularization parameter is found for each transmittance and each compression ratio. Simulation results are analyzed in terms of PSNR (Peak-Signal-to- Noise-Ratio) of the reconstructed images. Spatial and spectral analyzes of the reconstructions were performed separately, giving flexibility to the system user, who can use certain codes depending on the desired results, higher spatial resolution or higher spectral resolution. The simulations were conducted using an Intel Core i7 3960X 3.3 GHz processor, and 32 GB RAM memory. Each experiment is repeated five times and the respective results are average.
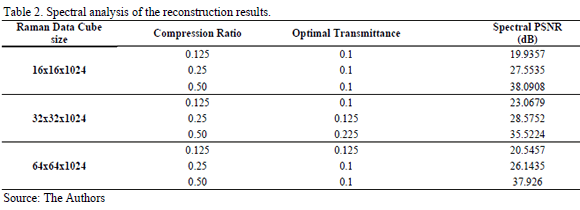
Numerical results for spatial and spectral analysis in the reconstruction are summarizes in Tables I and II respectively. Both, spatial and spectral analysis of the reconstructions allows to establish optimal values of transmittance among 0.1 and 0.3. The PSNR always increases when the compression ratio increases.
An analysis of the spatial and spectral information of the reconstructions is realized using the parameters summarized in tables I , II and are shown in Fig, 7, 8 for three spatial regions of the data cube.
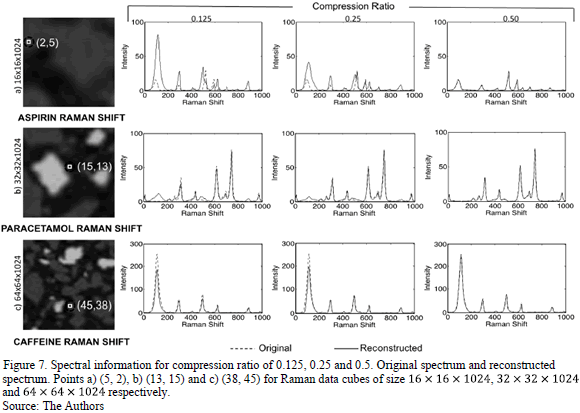
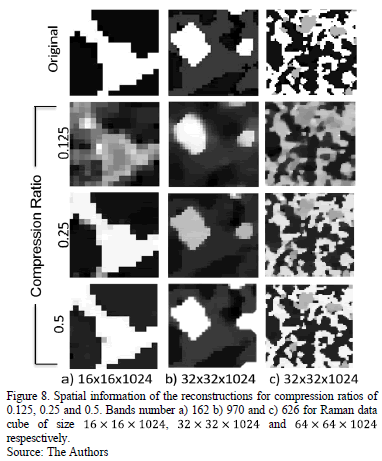
Fig. 7 shows a comparison between the spatial information
of the reconstructions obtained with different compression ratio. Columns a, b
and c show the spatial information of the bands number 162, 970 and 626 for the
three different sizes of the data cube,  ,
,  ,
and
,
and  ,
respectively. The improvement in the spatial quality can be observed when take
a greater compression ratio.
,
respectively. The improvement in the spatial quality can be observed when take
a greater compression ratio.
On
the other hand, the spectral quality of the reconstructed data cube was also
analyzed, for this, one spatial point from each scene was chosen randomly and
its corresponding spectral signature (Raman shift) was plotted. Fig. 8 shows
the comparison between the spectral signatures of the original data cube with
the corresponding reconstructions obtained. Rows a, b and c show the spectral
reconstructions of the points (5, 2), (13, 15) and (38, 45) selected from the
three different sizes of the data cube , and ,
respectively for different compression ratios. The Raman shifts of these points
correspond to aspirin, paracetamol and caffeine respectively. Notice that
the spectral signatures of the reconstruction data cube are very close to the
original allowing the mapping and chemical classification of a synthetic data
cube.
7. Conclusions
The CASSI system has been successfully used to sense and reconstruct three differences parts of a synthetic data cube obtained by Raman Spectroscopy technique. The spatial and spectral analyses of the reconstructions allow establishing optimal values of transmittance among 0.1 and 0.3. The PSNR for sustained reductions of 50% in the Nyquist criterion (using a compression ratio of 0.5) are up to 16.5 dB and 35.5 dB for spatial and spectral analyses respectively in the reconstructed Raman data cubes. Further, the spectral signatures of the reconstructions get closer to the original, showing that CASSI system in Raman Spectroscopy Imaging has promising results for an optimal chemical classification.
7. Acknowledgments
The authors gratefully acknowledge to COLCIENCIAS, especially the "Jóvenes Investigadores e Innovadores" program, who supported the work of the engineer Diana Fernanda Galvis Carreño, one of the authors of this work and the Vicerrectoría de Investigación y Extensión of the Universidad Industrial de Santander for supporting this research registered under the project title: Optimal design of coded apertures for compressive spectral imaging, (VIE 1368 code).
References
[1] Yaohai, L., Guangming, S., Dahua, G. and Danhua, L. High-resolution spectral imaging based on coded dispersion. Applied Optics, vol. 52 (5), pp. 1041-1049, 2013.
[2] Wagadarikar, A., John, R., Willett, R. and Brady, D. Single disperser design for coded aperture snapshot spectral imaging. Applied Optics, vol. 47 (10), pp. 44-51, 2008. https://doi.org/10.1364/AO.47.000B44
[3] Lau, D., Villis, C., Furman, S. and Livett, M. Multispectral and hyperspectral image analysis of elemental and micro-Raman maps of cross-sections from a 16th century painting. Analytica Chimica Acta. vol. 610 (1), pp. 15-24, 2008. https://doi.org/10.1016/j.aca.2007.12.043
[4] McCain, S. T., Gehm, M. E., Wang, Y., Pitsianis, N. P., Brady, D. J. Coded Aperture Raman Spectroscopy for quantitative measurements of ethanol in a tissue phantom. Applied Spectroscopy, vol. 60 (6), pp. 663-671, 2006. https://doi.org/10.1366/000370206777670693
[5] Majzner, K., Kaczor, A., Kachamakova- Trojanowska, N., Fedorowicz, A., Chlopicki, S. and Baranska, M. 3D confocal Raman imaging of endothelial cells and vascular wall. Perspectives in analytical spectroscopy of biomedical research. Analyst, vol. 138 (2), pp. 603-610, 2013. https://doi.org/10.1039/c2an36222h
[6] Hagen, N. and Brady, D. Coded Aperture DUV spectrometer for standoff Raman Spectroscopy. Proc. SPIE 7319, Next Generation Spectroscopic Technologies II, vol. 7319, 2009.
[7] McCain, S. T., Gehm, M. E., Wang, Y., Pitsianis, N. P. and Brady, D. J. Multimodal multiplex Raman Spectroscopy optimized for in vivo chemometrics. Biomedical vibrational Spectroscopy III: Advances in Research and Industry, pp. 1-8, 2006.
[8] Davis, B. M., Hemphill, A. J., Maltas, D. C., Zipper, M. A., Wang, P. and Ben-Amotz, D. Multivariate Hyperspectral Raman Imaging Using Compressive Detection. Analytical Chemistry, vol. 83 (12), pp. 5086-5092, 2011. https://doi.org/10.1021/ac103259v
[9] Schlücker, S., Schaeberle, M. D., Huffman, S. W. and Levin, I. W. Raman Microspectroscopy: a comparison of point, line and wide-field imaging methodologies. Analytical Chemistry, vol. 75 (16), pp. 4312-4318, 2003.
[10] Hagen N., Kester R., Gao L. and Tkackyk T. Snapshot advantage: a review of the light collection improvement for parallel high-dimensional measurement systems. Optical Engineering, vol. 51 (11), pp. 111702 1-7, 2012.
[11] Donoho, D. Compressed Sensing. IEEE Transactions on Information Theory, vol. 52 (4), pp. 1289-1306, 2006. https://doi.org/10.1109/TIT.2006.871582
[12] Candes, E., Romberg, J. and Tao, T. Robust uncertainty principles: Exact signal reconstruction from highly incomplete frequency information. IEEE Transactions on Information Theory, vol. 52 (2), pp. 489-509, 2006. https://doi.org/10.1109/TIT.2005.862083
[13] Willet, R., Marcia, R. and Nichols, J. Compressed Sensing for Practical Optical Imaging Systems: a tutorial. Optical Engineering, vol. 50 (7), 2011.
[14] Arguello, H. and Arce, G. R. Rank minimization Coded Aperture design for spectrally selective Compressive Imaging. IEEE Transactions on Image Processing, vol. 22 (3), pp. 941-954, 2013. https://doi.org/10.1109/TIP.2012.2222899
[15] Joya, M., Barba. J. and Pizani, P. Efectos estructurales en el semiconductor INSB, por la aplicación de diferentes métodos de presión. Dyna, vol. 79 (15), pp. 137-141, 2012.
[16] Abramczyk, H. and Brozek-Pluska, B. Raman Imaging in Biochemical and Biomedical Applications. Diagnosis and Treatment of Breast Cancer. To appear in Chemical Reviews, 2014.
[17] Mogilevsky, G., Borland, L., Brickhouse, M. and Fountain, A. W. Raman Spectroscopy for Homeland Security Applications. International Journal of Spectroscopy [Online], 2012. . [Date of reference July 25th of 2013]. Available at: http://www.hindawi.com/journals/ijs/2012/808079/
[18] Maltaşa, D. C., Kwokb, K., Wanga, P., Taylorb, L. S. and Ben-Amotz, D. Rapid classification of pharmaceutical ingredients with Raman spectroscopy using compressive detection strategy with PLS-DA multivariate filters. Journal of Pharmaceutical and Biomedical Analysis, vol. 80, pp. 63-68, 2013.
[19] Donoho, D., Tsaig, Y., Drori, I. and Starck, J. Sparse solution of underdetermined systems of linear equations by stagewise orthogonal matching pursuit. IEEE Transactions on Information Theory, vol. 58 (2) pp. 1094-1121, 2012. https://doi.org/10.1109/TIT.2011.2173241
[20] Duarte, M. and Baraniuk, R. Kronecker Compressive Sensing. IEEE Transactions on Image Processing, vol. 21 (2), pp. 494-504, 2012. https://doi.org/10.1109/TIP.2011.2165289
[21] Arguello, H. and Arce, G. R. Code Aperture Optimization for Spectrally Agile Compressive Imaging. Journal of the Optical Society of America A, vol. 23 (11), pp. 2400-2413, 2011. https://doi.org/10.1364/JOSAA.28.002400
[22] Arguello, H., Rueda, H., Wu, Y., Prather, D. Arce, G. R. Higher-order computational model for coded aperture spectral imaging. Applied Optics, vol. 52 (10), pp. D12- D21, 2012. https://doi.org/10.1364/AO.52.000D12
[23] Arce, G. R., Brady, D. J., Carin, L. and Arguello, H. Compressive Coded Aperture Spectral Imaging: An Introduction. IEEE Signal Processing Magazine, vol. 31 (1), pp. 105-115, 2014. https://doi.org/10.1109/MSP.2013.2278763
[24] Rueda, H. and Arguello, H. Spatial super- resolution in coded aperture-based optical compressive hyperspectral imaging systems. Revista Facultad de Ingeniería Universidad de Antioquia, pp. 7-18, 2013.
[25] Wagadarikar, A., Pitsianis, N. P., Sun, X. and Brady, D. J. Spectral image estimation for coded aperture snapshot spectral imagers. Proceedings of SPIE, vol. 7076, pp. 707602-707615, 2008. https://doi.org/10.1117/12.795545
[26] Bioucas-Dias, J. and Figueiredo, M. A new TwIST: Two-step iterative shrinking/thresholding algorithms for image restoration. IEEE Transactions Image Processing, vol. 16, pp. 2992-3004, 2007. https://doi.org/10.1109/TIP.2007.909319
[27] Arguello, H. and Arce, G. R. Restricted Isometry Property in Coded Aperture Compressive Spectral Imaging. IEEE Statistical Signal Processing Workshop, Ann Arbor, MI, USA, 2012.
[28] Arguello, H., Correa, C. V. and Arce, G. R Fast lapped block reconstructions in compressive spectral imaging. Applied Optics, vol. 52 (10), pp. D32-D45, 2013. https://doi.org/10.1364/AO.52.000D32
D.F. Galvis-Carreño, graduated as BSc. of Chemical Engineering in 2011. She is currently doing his MSc studies in Chemical Engineering at the Industrial University of Santander, Colombia. Her main research areas include Raman Spectroscopy, Compresive Sensing, coded apertures design and image processing.
Y. Mejía-Melgarejo, received the MSc degree from the department of Electrical, Electronics, and Telecommunication, Universidad Industrial de Santander, Colombia, in 2014. Her main research areas are computational spectral imaging, digital signal processing, optical coded apertures design, and image processing.
H. Arguello-Fuentes, graduated as BSc Electrical Engineer in 2000 and as a MSc. degree in electrical power in 2003, both of them from de Universidad Industrial de Santander, Colombia, and the PhD degree in Electrical and Computer Engineering from the University of Delaware, United States. He has working as assistant professor in full-time dedication of the School of Engineering and Computer Systems of the Universidad Industrial de Santander. His research interests include digital signal processing, compressive sensing, artificial intelligence and telecommunications.
Referencias
Yaohai, L., Guangming, S., Dahua, G. and Danhua, L. High-resolution spectral imaging based on coded dispersion. Applied Optics, vol. 52 (5), pp. 1041-1049, 2013.
Wagadarikar, A., John, R., Willett, R. and Brady, D. Single disperser design for coded aperture snapshot spectral imaging. Applied Optics, vol. 47 (10), pp. 44-51, 2008. https://doi.org/10.1364/AO.47.000B44
Lau, D., Villis, C., Furman, S. and Livett, M. Multispectral and hyperspectral image analysis of elemental and micro-Raman maps of cross-sections from a 16th century painting. Analytica Chimica Acta. vol. 610 (1), pp. 15-24, 2008. https://doi.org/10.1016/j.aca.2007.12.043
McCain, S. T., Gehm, M. E., Wang, Y., Pitsianis, N. P., Brady, D. J. Coded Aperture Raman Spectroscopy for quantitative measurements of ethanol in a tissue phantom. Applied Spectroscopy, vol. 60 (6), pp. 663-671, 2006. https://doi.org/10.1366/000370206777670693
Majzner, K., Kaczor, A., Kachamakova- Trojanowska, N., Fedorowicz, A., Chlopicki, S. and Baranska, M. 3D confocal Raman imaging of endothelial cells and vascular wall. Perspectives in analytical spectroscopy of biomedical research. Analyst, vol. 138 (2), pp. 603-610, 2013. https://doi.org/10.1039/c2an36222h
Hagen, N. and Brady, D. Coded Aperture DUV spectrometer for standoff Raman Spectroscopy. Proc. SPIE 7319, Next Generation Spectroscopic Technologies II, vol. 7319, 2009.
McCain, S. T., Gehm, M. E., Wang, Y., Pitsianis, N. P. and Brady, D. J. Multimodal multiplex Raman Spectroscopy optimized for in vivo chemometrics. Biomedical vibrational Spectroscopy III: Advances in Research and Industry, pp. 1-8, 2006.
Davis, B. M., Hemphill, A. J., Maltas, D. C., Zipper, M. A., Wang, P. and Ben-Amotz, D. Multivariate Hyperspectral Raman Imaging Using Compressive Detection. Analytical Chemistry, vol. 83 (12), pp. 5086-5092, 2011. https://doi.org/10.1021/ac103259v
Schlücker, S., Schaeberle, M. D., Huffman, S. W. and Levin, I. W. Raman Microspectroscopy: a comparison of point, line and wide-field imaging methodologies. Analytical Chemistry, vol. 75 (16), pp. 4312-4318, 2003.
Hagen N., Kester R., Gao L. and Tkackyk T. Snapshot advantage: a review of the light collection improvement for parallel high-dimensional measurement systems. Optical Engineering, vol. 51 (11), pp. 111702 1-7, 2012.
Donoho, D. Compressed Sensing. IEEE Transactions on Information Theory, vol. 52 (4), pp. 1289-1306, 2006. https://doi.org/10.1109/TIT.2006.871582
Candes, E., Romberg, J. and Tao, T. Robust uncertainty principles: Exact signal reconstruction from highly incomplete frequency information. IEEE Transactions on Information Theory, vol. 52 (2), pp. 489-509, 2006. https://doi.org/10.1109/TIT.2005.862083
Willet, R., Marcia, R. and Nichols, J. Compressed Sensing for Practical Optical Imaging Systems: a tutorial. Optical Engineering, vol. 50 (7), 2011.
Arguello, H. and Arce, G. R. Rank minimization Coded Aperture design for spectrally selective Compressive Imaging. IEEE Transactions on Image Processing, vol. 22 (3), pp. 941-954, 2013. https://doi.org/10.1109/TIP.2012.2222899
Joya, M., Barba. J. and Pizani, P. Efectos estructurales en el semiconductor INSB, por la aplicación de diferentes métodos de presión. Dyna, vol. 79 (15), pp. 137-141, 2012.
Abramczyk, H. and Brozek-Pluska, B. Raman Imaging in Biochemical and Biomedical Applications. Diagnosis and Treatment of Breast Cancer. To appear in Chemical Reviews, 2014.
Mogilevsky, G., Borland, L., Brickhouse, M. and Fountain, A. W. Raman Spectroscopy for Homeland Security Applications. International Journal of Spectroscopy [Online], 2012. . [Date of reference July 25th of 2013]. Available at: http://www.hindawi.com/journals/ijs/2012/808079/
Maltaşa, D. C., Kwokb, K., Wanga, P., Taylorb, L. S. and Ben-Amotz, D. Rapid classification of pharmaceutical ingredients with Raman spectroscopy using compressive detection strategy with PLS-DA multivariate filters. Journal of Pharmaceutical and Biomedical Analysis, vol. 80, pp. 63-68, 2013.
Donoho, D., Tsaig, Y., Drori, I. and Starck, J. Sparse solution of underdetermined systems of linear equations by stagewise orthogonal matching pursuit. IEEE Transactions on Information Theory, vol. 58 (2) pp. 1094-1121, 2012. https://doi.org/10.1109/TIT.2011.2173241
Duarte, M. and Baraniuk, R. Kronecker Compressive Sensing. IEEE Transactions on Image Processing, vol. 21 (2), pp. 494-504, 2012. https://doi.org/10.1109/TIP.2011.2165289
Arguello, H. and Arce, G. R. Code Aperture Optimization for Spectrally Agile Compressive Imaging. Journal of the Optical Society of America A, vol. 23 (11), pp. 2400-2413, 2011. https://doi.org/10.1364/JOSAA.28.002400
Arguello, H., Rueda, H., Wu, Y., Prather, D. Arce, G. R. Higher-order computational model for coded aperture spectral imaging. Applied Optics, vol. 52 (10), pp. D12- D21, 2012. https://doi.org/10.1364/AO.52.000D12
Arce, G. R., Brady, D. J., Carin, L. and Arguello, H. Compressive Coded Aperture Spectral Imaging: An Introduction. IEEE Signal Processing Magazine, vol. 31 (1), pp. 105-115, 2014. https://doi.org/10.1109/MSP.2013.2278763
Rueda, H. and Arguello, H. Spatial super- resolution in coded aperture-based optical compressive hyperspectral imaging systems. Revista Facultad de Ingeniería Universidad de Antioquia, pp. 7-18, 2013.
Wagadarikar, A., Pitsianis, N. P., Sun, X. and Brady, D. J. Spectral image estimation for coded aperture snapshot spectral imagers. Proceedings of SPIE, vol. 7076, pp. 707602-707615, 2008. https://doi.org/10.1117/12.795545
Bioucas-Dias, J. and Figueiredo, M. A new TwIST: Two-step iterative shrinking/thresholding algorithms for image restoration. IEEE Transactions Image Processing, vol. 16, pp. 2992-3004, 2007. https://doi.org/10.1109/TIP.2007.909319
Arguello, H. and Arce, G. R. Restricted Isometry Property in Coded Aperture Compressive Spectral Imaging. IEEE Statistical Signal Processing Workshop, Ann Arbor, MI, USA, 2012.
Arguello, H., Correa, C. V. and Arce, G. R Fast lapped block reconstructions in compressive spectral imaging. Applied Optics, vol. 52 (10), pp. D32-D45, 2013. https://doi.org/10.1364/AO.52.000D32
Cómo citar
IEEE
ACM
ACS
APA
ABNT
Chicago
Harvard
MLA
Turabian
Vancouver
Descargar cita
CrossRef Cited-by
1. Alex Jones, Anton Tamtögl, Irene Calvo-Almazán, Anders Hansen. (2016). Continuous Compressed Sensing for Surface Dynamical Processes with Helium Atom Scattering. Scientific Reports, 6(1) https://doi.org/10.1038/srep27776.
2. Samuel Pinilla, Tatiana Gelvez, Henry Arguello. (2017). Boolean approximation of a phase-coded aperture diffraction pattern system for X-ray crystallography. 2017 IEEE 7th International Workshop on Computational Advances in Multi-Sensor Adaptive Processing (CAMSAP). , p.1. https://doi.org/10.1109/CAMSAP.2017.8313144.
3. C. Jenila, A. Sivanantha Raja. (2015). Reduction of data acquisition time in Raman spectroscopy imaging using structure based compressive sampling algorithm. Optical and Quantum Electronics, 47(12), p.3855. https://doi.org/10.1007/s11082-015-0253-8.
4. Camille Scotté, Siddharth Sivankutty, Randy A. Bartels, Hervé Rigneault. (2020). Line-scan compressive Raman imaging with spatiospectral encoding. Optics Letters, 45(19), p.5567. https://doi.org/10.1364/OL.400151.
5. Samuel Pinilla, Hans García, Luis Díaz, Juan Poveda, Henry Arguello. (2018). Coded aperture design for solving the phase retrieval problem in X-ray crystallography. Journal of Computational and Applied Mathematics, 338, p.111. https://doi.org/10.1016/j.cam.2018.02.002.
6. Hang Yuan, Guiwen Wang, Pengfei Zhang. (2025). Compressive Raman imaging via orthogonal dispersion. Measurement, 256, p.118525. https://doi.org/10.1016/j.measurement.2025.118525.
7. Shupeng Zhao, Lea Chibani, Edward Chandler, Fangyu Liu, Jianqi Hu, Lorenzo Valzania, Ulugbek S. Kamilov, Hilton B. de Aguiar. (2025). Computational field-resolved coherent chemical imaging. Nature Communications, 16(1) https://doi.org/10.1038/s41467-025-62716-8.
8. Haonan Lin, Hilton B. de Aguiar. (2022). Stimulated Raman Scattering Microscopy. , p.371. https://doi.org/10.1016/B978-0-323-85158-9.00036-1.
9. Benneth Sturm, Fernando Soldevila, Enrique Tajahuerce, Sylvain Gigan, Herve Rigneault, Hilton B. de Aguiar. (2019). High-Sensitivity High-Speed Compressive Spectrometer for Raman Imaging. ACS Photonics, 6(6), p.1409. https://doi.org/10.1021/acsphotonics.8b01643.
10. Andrew G. Tescher, David Alberto Boada, Henry Arguello Fuentes. (2016). Sparsity based target detection for compressive spectral imagery . Applications of Digital Image Processing XXXIX. Applications of Digital Image Processing XXXIX. 9971, p.997126. https://doi.org/10.1117/12.2238030.
11. Jonathan V. Thompson, Joel N. Bixler, Brett H. Hokr, Gary D. Noojin, Marlan O. Scully, Vladislav V. Yakovlev. (2017). Single-shot chemical detection and identification with compressed hyperspectral Raman imaging. Optics Letters, 42(11), p.2169. https://doi.org/10.1364/OL.42.002169.
12. N. Diaz, C. Noriega-Wandurraga, A. Basarab, J.-Y. Tourneret, H. Arguello. (2019). Adaptive Coded Aperture Design by Motion Estimation using Convolutional Sparse Coding in Compressive Spectral Video Sensing. 2019 IEEE 8th International Workshop on Computational Advances in Multi-Sensor Adaptive Processing (CAMSAP). , p.445. https://doi.org/10.1109/CAMSAP45676.2019.9022649.
13. Tianyu Yan, Feiyang Lu, Duofang Chen, Yonghua Zhan, Jimin Liang, Xueli Chen, Natan T. Shaked, Oliver Hayden. (2019). Raman spectroscopic imaging with frequency modulation based spatially encoded light. Label-free Biomedical Imaging and Sensing (LBIS) 2019. , p.7. https://doi.org/10.1117/12.2507734.
14. Shenghan Ren, Tianyu Yan, Lin Wang, Nan Wang, Jimin Liang, Qi Zeng, Xueli Chen. (2020). Wide-field Raman spectroscopic imaging with frequency modulation based spatially encoded light illumination. AIP Advances, 10(9) https://doi.org/10.1063/5.0016541.
15. Jonathan Monsalve, Hector Vargas, Henry Arguello. (2015). Spectral Raman unmixing from CASSI system compressive measurements. 2015 20th Symposium on Signal Processing, Images and Computer Vision (STSIVA). , p.1. https://doi.org/10.1109/STSIVA.2015.7330458.
16. Camille Scotté, Hilton B. de Aguiar, Didier Marguet, Ellen Marie Green, Pascaline Bouzy, Sébastien Vergnole, Charles Peter Winlove, Nicholas Stone, Hervé Rigneault. (2018). Assessment of Compressive Raman versus Hyperspectral Raman for Microcalcification Chemical Imaging. Analytical Chemistry, 90(12), p.7197. https://doi.org/10.1021/acs.analchem.7b05303.
17. Fernando Soldevila, Jonathan Dong, Enrique Tajahuerce, Sylvain Gigan, Hilton B. de Aguiar. (2019). Fast compressive Raman bio-imaging via matrix completion. Optica, 6(3), p.341. https://doi.org/10.1364/OPTICA.6.000341.
18. Kentaro Mochizuki, Nicholas Isaac Smith, Katsumasa Fujita. (2018). Reference Module in Chemistry, Molecular Sciences and Chemical Engineering. https://doi.org/10.1016/B978-0-12-409547-2.14016-8.
19. S. Majumder, S. Gupta, S. Dubey. (2020). Spectral imaging using compressive sensing‐based single‐pixel modality. Electronics Letters, 56(19), p.1013. https://doi.org/10.1049/el.2020.0757.
20. Timothée Justel, Frédéric Galland, Antoine Roueff. (2023). Optimal trade-off filters for compressed Raman classification and spectrum reconstruction. Journal of the Optical Society of America A, 40(6), p.1058. https://doi.org/10.1364/JOSAA.479569.
21. Camille Scotté, Siddharth Sivankutty, Patrick Stockton, Randy A. Bartels, Hervé Rigneault. (2019). Compressive Raman imaging with spatial frequency modulated illumination. Optics Letters, 44(8), p.1936. https://doi.org/10.1364/OL.44.001936.
Dimensions
PlumX
Visitas a la página del resumen del artículo
Descargas
Licencia
Derechos de autor 2014 DYNA

Esta obra está bajo una licencia internacional Creative Commons Atribución-NoComercial-SinDerivadas 4.0.
El autor o autores de un artículo aceptado para publicación en cualquiera de las revistas editadas por la facultad de Minas cederán la totalidad de los derechos patrimoniales a la Universidad Nacional de Colombia de manera gratuita, dentro de los cuáles se incluyen: el derecho a editar, publicar, reproducir y distribuir tanto en medios impresos como digitales, además de incluir en artículo en índices internacionales y/o bases de datos, de igual manera, se faculta a la editorial para utilizar las imágenes, tablas y/o cualquier material gráfico presentado en el artículo para el diseño de carátulas o posters de la misma revista.


