Publicado
Methodological design for the prevention of risk in production processes
DOI:
https://doi.org/10.15446/dyna.v82n193.42903Palabras clave:
Statistical process control, risk management process, risk assessment, critical variables, analysis tools. (es)
Descargas
DOI: https://doi.org/10.15446/dyna.v82n193.42903
Methodological design for the prevention of risk in production processes
Diseño metodológico para la prevención de riesgos en procesos de producción
Alexander De Jesús Pulido-Rojano a
a Industrial Engineering Program, Universidad Simón Bolívar, Barranquilla, Colombia. apulido3@unisimonbolivar.edu.co
Received: April 2nd, 2014. Received in revised form: February 23th, 2015. Accepted: July 11th, 2015.
This work is licensed under a Creative Commons Attribution-NonCommercial-NoDerivatives 4.0 International License.

Abstract
This paper proposes a methodological design based on the
development, creation, adaptation and implementation of some analysis tools and
the deployment of the risk management process content in standard ISO 31000.
This allows for the design of a monitoring and quality control system of
critical variables associated with equipment and operating conditions for the
purpose of identifying and mitigating sources diversions product
specifications. It also seeks to harmonize work philosophies with international
management standards. The validation was performed by an industrial company from
the city of Barranquilla. The content of this paper provides professionals and
industry with a way to address and improve the capacity of any type of
manufacturing process in any organization through standardized steps.
Keywords: Statistical process control; risk management process; risk assessment; critical variables; analysis tools.
Resumen
La presente
investigación propone un diseño metodológico fundamentado en el desarrollo,
creación, adaptación e implementación de algunas herramientas de análisis y en
el despliegue del proceso de gestión de riesgo contenido en la norma ISO 31000,
permitiendo diseñar un sistema de monitoreo y control de calidad de variables
críticas asociadas con condiciones de operación de equipos, para identificar y
mitigar en línea potenciales fuentes de desviación de especificaciones de
producto, armonizando filosofías de trabajo con normas internacionales de
gestión y cuya validación se realizó en una empresa del sector industrial de la
ciudad de Barranquilla. El contenido de este artículo ofrece a los
profesionales e industriales una forma de abordar y mejorar cualquier tipo de
proceso de fabricación en cualquier tipo de organización por medio de pasos
estandarizados.
Palabras clave: Control estadístico de procesos; Proceso de gestión de riesgos; Evaluación del riesgo; variables críticas; herramientas de análisis.
1. Introduction
Organizations' concern to offer the best product or service requires the use of a large number of statistical tools and standards to achieve optimum quality, to meet needs and largely fulfill the expectations of its customers or users [1].
The statistical and quality tools have been widely used to assist the operation of production systems and compliance with products and services' specification requirements [2-9]. They are implemented by organizations to demonstrate their commitment and orientation to continuous improvement [10]. Moreover, risk management has been vital in the financial [11,12], the Project Management [13-16], the Health and Safety [17] and the information technology sectors [18].
Problems arise when it is necessary to combine statistical techniques with management rules for compliance with national and international standards.
Given that, until now, there is little evidence of the implementation of a risk-based approach in production systems. In this paper we present a methodological design that enables the integration of some statistical and quality tools with the deployment of the risk management process contained in ISO 31000. It has been designed to become a useful tool for the detection and mitigation of defects in lines of production and the identification of potential sources of non-conformities, as well as harmonizing working philosophies with national and international standards of management. The methodological design has been implemented for industrial production, more precisely, in a company in the industrial sector in Barranquilla-Colombia that is dedicated to transformation of glass and aluminum.
This article is organized as follows. Section 2 describes our methodology and its constituent parts. The computational results are presented in Section 3 and show the effectiveness of our method and final remarks are made in Section 4.
2. Methodological design
The proposed methodological design has been established as a simple process that summarizes the steps to be followed in order for it to be implemented it in any production process. The steps begin with the identification and description of products and processes to be monitored and then the proposed actions to mitigate undesired deviations, risks and non-conformities identified in the manufacturing process are reviewed and monitored (Fig. 1).
Also, seeking to provide guidance and clarity the following section describes each of the steps:
- Identification and description: In this first step, processes and products which will be monitored are identified, a detailed description of the production stages, activities, working methods and resources used is presented. This seeks to find possible failings or deviations, risks and causes of nonconformity.
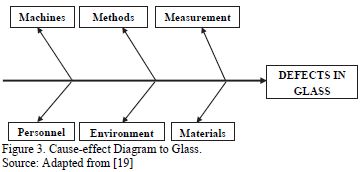
- Implementation and Classification: In this step, the implementing of the statistical and quality tools is classified using the cause-effect diagram, as well as the causes of nonconformities, deviations or risks identified in each process identified for monitoring. Additionally, instruments for monitoring and statistical process control are implemented by means of control charts, and finally, using the Pareto chart, occurrences of deviations or non-conformances are identified. The tools implemented at this stage will depend on the type of process that is being analyzed.
- Analysis: At this stage a statistical analysis of processes and data analysis of the occurrence of nonconformities based on the results obtained in the implementation stage and classification is performed.
- Mitigation: In order to reduce risks, deviations and non-conformities detected in the production process and the deployment of the risk management process is proposed according to ISO 31000. Also, containment actions, reaction actions and prevention actions will be implemented to mitigate the occurrence of nonconformities are identified.
- Monitoring and review: Being a process of continuous improvement, monitoring and reviewing of the effectiveness of the proposed actions is performed. At this stage, new actions are recommended in case the actions first suggested have not been effective, or if updating the system in the step of identifying of new risks is desired.
3. Results and analysis
To validate the proposed methodological design that was described in the previous section, a company founded in Barranquilla, Colombia was identified that is dedicated to the manufacture and processing of glass and aluminum. We focus on the study and analysis of the glass production line, which consists of eight threads of transformation: cutting, polishing rectilinear, Polishing Curved, Pierced, washing and drying, design, Sandblasting and Tempered. The Flowchart Glass Production is shown in Fig. 2. For the purpose of showing the development of the methodological design its application in the Cutting process will be presented. There are similar results in the remaining processes.
3.1. Identification and description
Operations and tools used in the cutting process, particular aspects that may be relevant in the operation, the sequential steps in the processing activity of the glass and the identification and analysis of causes of nonconformities, deviations or related risks were identified.
3.2. Implementation and classification
In this second stage, by using the cause-effect diagram the classifying of origin of some of the deviations is achieved, and the risks and non-conformities are identified at the stage of identification and description. Some are shown in Fig. 3 and Table 1.
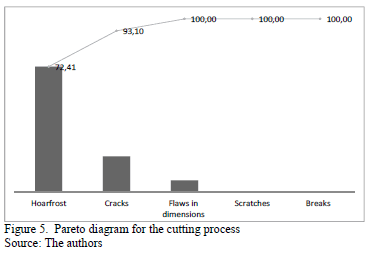
To determine the frequency of occurrence of defects in glass in the cutting process, (scratches, breaks, inadequate cuts and others) (See Figs. 4-6), the Pareto diagram is implemented, which looks to prioritize and recognize if the process is critical in the production line. The Pareto diagram is shown in Fig.5.
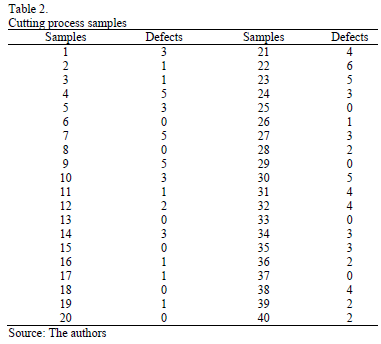
Also, as a tool for monitoring and following up all processes in the manufacture of glass, chart "c" is used. This is because the behavior is analyzed for the occurrence of defects in a product unit, which is represented by a sheet of glass. To calculate the control limits, forty product samples were taken in each process and the defects found in each sample, caused by identified sources, were quantified. To determine the sample size Montgomery's [19] theory was used, which suggests that the sample size should provide a 50% probability of detecting a shift in the process. Evidence for this application is shown in Fig.6. Defects for 40 samples taken randomly from the cutting process are presented in Table 2.
After the processing of the data, the value of the lower, central and upper limits of the process were:

3.3. Analysis
The analysis was performed taking into account the classification of nonconformities by the cause-effect diagram. The analysis of the incidence of defects was prioritized through the Pareto and statistical control charts.
It is noted that in the process of cutting that about 93% of nonconformities correspond to Hoarfrost and Cracks, often caused by personnel and the methods used in the process. Furthermore, it is evident that the maximum number of defects per unit of product is 6.59 with a mean of 2.17. For this case, the lower control limit is negative so it is replaced with zero, since there can be no adverse effects in the glass.
3.4. Mitigation
This phase is performed under the general approach of the risk management process included in ISO 31000:2009, and it also takes into consideration the treatment and management of risk on causes of deviations or non-conformances identified in phase of identification and description.
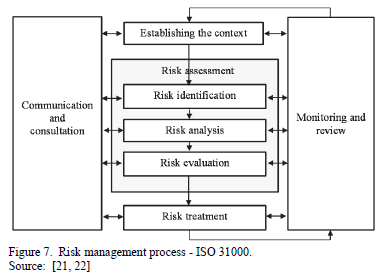
Risk management involves the company establishing elements that are suitable in terms of infrastructure and culture. By applying a systematic and logical method for establishing the context, identifying, evaluating, treating, monitoring and communicating risks associated with any activity, function or process in a way that will enable organizations to minimize losses and maximize profits [20-22]. The different stages of risk management are presented in Fig. 7.
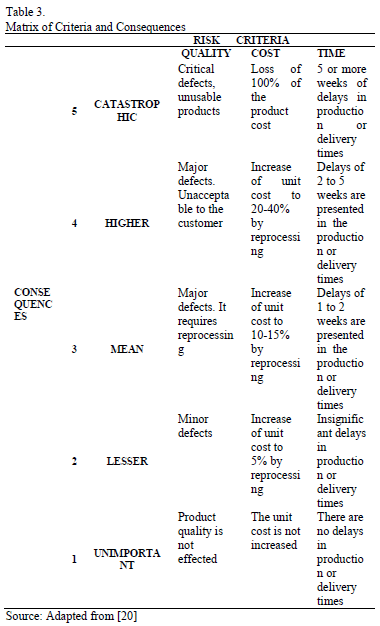
- Establishing the context: The establishing of criteria for risks, the impact of which will affect product quality, costs and production times, is determined by the identified processes, stages and activities. Table 3 shows the criteria used in this research.
- Risk identification: The identification of risks in terms of what can happen and how it can occur, are contained in the information collected at the identification stage and the description of the proposed methodological design.
- Risk analysis: The possibility risk occurrence and consequences based on the Qualification matrix and Risk Analysis (Table 4) was measured. The risk evaluation is assigned when the possibility and the consequences of each risk are multiplied. We can see in Table 4 that for each level of consequence and possibility - into a range from one to five- the risk can take values from 1 to 25. The information on the possibility and consequences of risk were provided and coordinated by the company's experienced staff who were directly involved with the process.
- Risk evaluation: To determine how priority is a risk, we refer to results obtained in the qualification matrix and risk analysis. By observing the various qualifications of risk and its class, considering its value within a range from 1 to 25, the risks can be classified as very low, low, moderate, high or very high.
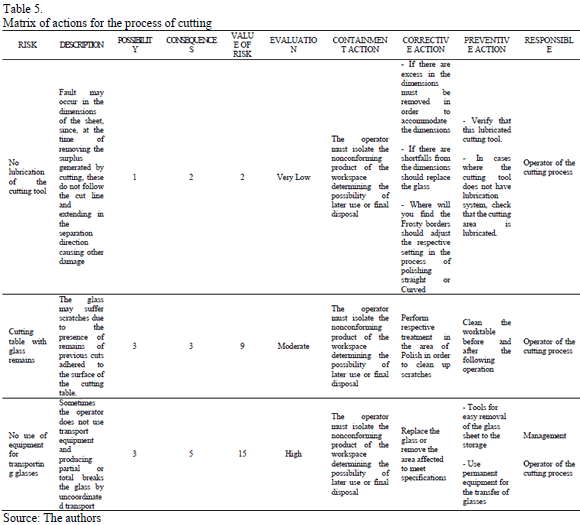
- Risk treatment: At this stage, the "Matrix of actions"(Table 5) is created with the aim of proposing and implementing the necessary actions to mitigate the risks of higher priority.
The actions matrix, seeks to minimize risk impacts, deviations or causes that give rise to non-compliance of the product in the different production stages. Through various actions taken at each stage of production, there are aims to reduce the possibility of occurrence and any negative consequences that may result from the presence of risk or causes of undesired deviations. The effectiveness of the actions will be reflected in the reduction in the occurrence of risks and nonconformity of the product.
The matrix of actions is built on MS Excel worksheets and its structure sequentially shows the causes or risks identified in the different processes that affect the product. In the worksheets the risks are described -what they are and how these risks are presented. Subsequently, the risk assessment is presented in terms of possibility and consequence. This is in order to focus attention on the risk values that are higher, because they represent a greater impact on the deterioration of quality, resource consumption and delays in production and delivery times.
Additionally, containment actions, reaction and prevention are proposed in case of occurrence of the risk. This will allow the operation of any process to make decisions in real time to prevent or contain more serious results.
3.5. Monitoring and review
Samples are collected to update the analysis tools in the glass production line are taken at least every two days. This is to maintain the proper functioning of the methodological design. This will help identify any unnatural cause that affects the process or will otherwise recognize if the proposed actions to mitigate the risks are efficient and definitely include them in the process.
Also, the updating of the risks in each of the processes should be performed in a period not exceeding 90 working days, after implementing the action or actions needed to reduce or eliminate these risks in order to identify new causes of deviations. If the actions are effective and permanently eliminate or reduce some of the identified risks, management must keep records of the results contributing to the theme of lessons learned within the organization.
4. Conclusions
We have presented a methodological design for the identification, treatment, mitigation and monitoring of deviations from product specifications in production processes. In developing the paper we were able to combine statistical and quality tools with international management standards. In addition, we have proposed solutions to mitigate the causes or risks that generate deviations or non-conformances to the monitored product. During the validation of methodological design, some improvements were implemented to minimize the occurrence of risks and to take the best course of action based on the operating characteristics of the company.
The statistical and quality tools helped process the data collected, contributed to the analysis, and helped with understanding and monitoring of processes. Also, graphics monitoring identified any positive or negative change due to the treatment of risks.
Also, the design and implementation of the "Matrix of Actions", based on the ISO 31000:2009 for risk management, allowed us to make a diagnosis for each of the processes and propose actions to prevent significant risks for the organization.
Finally, The Risk Management process establishes a course of action and proposed activities that guide the operator of the production process to make decisions in real time and to prevent or contain undesirable results. It is suggested that these are applied in an environment of services or production processes that require the use of different types of control charts or instrument for monitoring processes.
References
[1] ISO 9000. (International Standardization for Organization). Basic concepts and language. ISO 9000:2005. Ginebra, Suiza. 2005.
[2] Cachutt-Alvarado, C., Illada-García, R.A., Barreto-Alvarado, J.R. y Pinto-Rodríguez, F.E., Análisis de los procesos de fabricación en una empresa manufacturera mediante gráficos de control integrado. Revista Universidad, Ciencia y Tecnología, 12 (49), pp. 227-234, 2008.
[3] Díaz, E., Díaz, C., Flores, L. and Heyser, S., Estudio de la variabilidad de proceso en el área de envasado de un producto en polvo. Revista Información Tecnológica, 20 (6), pp. 105-113, 2009. DOI: 10.4067/s0718-07642009000600013
[4] Pineda, U., Estrada, M. and Parra, C.M., Aplicación del modelo Servqual y herramientas de ingeniería de la calidad para la planificación del servicio en la Biblioteca Central de la Universidad de Antioquia. Revista Interamericana de Bibliotecología, 34 (3), pp. 243-255, 2011.
[5] Pérez, P., Control estadístico de calidad multivariado, para el monitoreo e identificación de causas de variabilidad en procesos de crédito del sector financiero. 2012. Obtenido de Universidad Nacional: www.bdigital.unal.edu.co/8232/1/8910504.2012.pdf
[6] Zapata-Gómez, A. Efecto de las técnicas de ingeniería de la calidad en el diseño de productos. Revista Ingeniería y Universidad, 17 (2), pp. 409-425, 2013.
[7] Lee-Ho, L. and Costa-Quinino, R., An attribute control chart for monitoring the variability of a process. Int. J. Production Economics, 145, pp 263-267, 2013. DOI: 10.1016/j.ijpe.2013.04.046
[8] Epprecht, E., Aparisi, F., Ruiz, O. and Veiga, A., Reducing sampling costs in multivariate SPC with a double-dimension T2 control chart. Int. J. Production Economics, 144, pp. 90-104, 2013. DOI: 10.1016/j.ijpe.2013.01.022
[9] Peñabaena-Niebles, R., Oviedo-Trespalacios, O., Cuentas-Hernandez, S. and García-Solano, E., Methodology for the implementation of an economic and/or statistical design for x-bar charts with variable parameters (VP). DYNA, 81 (184), pp. 150-157, 2014. DOI: 10.15446/dyna.v81n184.35510.
[10] Peach, R.W., Manual de ISO, 3ra ed., México D.F., México: McGraw Hill, 2001.
[11] Arbeláez, J., et al, Riesgo operacional: Reto actual de las entidades financieras. Revista Ingenierías Universidad de Medellín, 5 (9), pp. 97-110, 2006.
[12] Botín, J.A.,Guzmán, R.R. and Smith, M.L., A methodological model to assist in the optimization and risk management of mining investment decisions. DYNA, 78 (170), pp. 221-226, 2011.
[13] Gasca-Hurtado, G.P., Estudio de similitud del proceso de gestión de riesgos en proyectos de outsourcing de software: utilización de un método. Revista Ingenierías Universidad de Medellín, 9 (17), pp. 119-130, 2010.
[14] López, C. and Salmerón, J., Ranking risks in ambient intelligence projects. Journal of Applied Research and Technology, 9 (3), pp. 419-429 2011.
[15] Espinosa, F., Dias, A. and Salinas, G., Un procedimiento para evaluar el riesgo de la innovación en la gestión del mantenimiento industrial. Ingeniare. Revista Chilena de Ingeniería, 20 (2), pp. 242-254, 2012. DOI: 10.4067/S0718-33052012000200011
[16] Martínez, G., Moreno, B. and Rubio, M.C., Gestión del riesgo en proyectos de ingeniería. El caso del campus universitario PTS. Universidad de Granada (España). DYNA, 79 (173), pp. 7-14, 2012.
[17] Pérez-Vidal, A., Amézquita-Marroquín, C.P. and Torres-Lozada, P., Identificación y priorización de peligros como herramientas de la gestión del riesgo en sistemas de distribución de agua potable. Revista Ingeniería y Universidad, 16 (2), pp. 449-469, 2012.
[18] Gómez, R., Pérez, D., Donoso, Y. y Herrera, A., Metodología y gobierno de la gestión de riesgos de tecnologías de la información. Revista de Ingeniería, 31, pp. 109-118, 2010. DOI: 10.16924/riua.v0i31.217
[19] Montgomery C.D., Introduction to statistical quality control, 6th Ed., United States of America, John Wiley & Sons, Inc. 2009.
[20] Poveda-Orjuela, P. and Lopez-Giraldo, M., Configuración de herramientas guía para la gestión integral de riesgos de inocuidad según ISO 31000 e ISO 22000 (Vol. 1). Barranquilla, Colombia: Ediciones Uninorte, 2010.
[21] NTC-5254 (Norma Técnica Colombiana), Directrices para la Gestión de Riesgos, Bogotá, Colombia: ICONTEC, 2007.
[22] Australian/New Zealand Standard ISO 31000, AS/NZ ISO 31000 Risk Management. Principles and Guidelines. Sidney: AS/NZ S Standards, 2009.
A.D. Pulido-Rojano, received his BSc. Eng in Industrial Engineering in 2006 from the Universidad de la Costa, Barranquilla, Colombia, his MSc. degree in Industrial Engineering in 2012 from the Universidad del Norte, Barranquilla, Colombia, and is currently undertaking his Doctoral Program in Statistics and Optimization, at the Universitat Politècnica de València. Valencia, España. He has worked on various research projects. He is currently a professor in the Industrial Engineering Program at the Universidad Simón Bolivar de Barranquilla, Colombia. His research interests include: inventory, operations management, statistical process control and optimization of process and services. ORCID: 0000-0001-5599-7977
Cómo citar
IEEE
ACM
ACS
APA
ABNT
Chicago
Harvard
MLA
Turabian
Vancouver
Descargar cita
CrossRef Cited-by
1. Ana Julia Acevedo Urquiaga, Rogelio Suárez Mella. (2022). Administración de la innovación. , p.182. https://doi.org/10.7476/9786287725157.0006.
2. Jeniffer Tatiana Orozco-Sánchez, Adriana Castro-Rivera, Gerardo Martínez-Díaz. (2018). Evaluación del riesgo inicial en un proceso misional de una caja de compensación familiar con base a la norma NTC-ISO 31000:2011. Clío América, 12(24) https://doi.org/10.21676/23897848.2868.
3. Vicente González-Prida, Jesús P. Zamora, Pablo Viveros Gunckel. (2021). Advanced Models and Tools for Effective Decision Making Under Uncertainty and Risk Contexts. Advances in Business Strategy and Competitive Advantage. , p.185. https://doi.org/10.4018/978-1-7998-3246-1.ch006.
4. J. Carlos García-Díaz, Alexander Pulido-Rojano. (2017). Monitoring and control of the multihead weighing process through a modified control chart. DYNA, 84(200), p.135. https://doi.org/10.15446/dyna.v84n200.58518.
Dimensions
PlumX
Visitas a la página del resumen del artículo
Descargas
Licencia
Derechos de autor 2015 DYNA

Esta obra está bajo una licencia internacional Creative Commons Atribución-NoComercial-SinDerivadas 4.0.
El autor o autores de un artículo aceptado para publicación en cualquiera de las revistas editadas por la facultad de Minas cederán la totalidad de los derechos patrimoniales a la Universidad Nacional de Colombia de manera gratuita, dentro de los cuáles se incluyen: el derecho a editar, publicar, reproducir y distribuir tanto en medios impresos como digitales, además de incluir en artículo en índices internacionales y/o bases de datos, de igual manera, se faculta a la editorial para utilizar las imágenes, tablas y/o cualquier material gráfico presentado en el artículo para el diseño de carátulas o posters de la misma revista.


