Publicado
A study of co-movements between U.S. and Latin American stock markets: A cross-bicorrelations perspective
DOI:
https://doi.org/10.15446/dyna.v83n196.49737Palabras clave:
Financial crisis, cross-bicorrelations, nonlinear dependence, co-movement, financial markets. (es)Descargas
DOI: https://doi.org/10.15446/dyna.v83n196.49737
A study of co-movements between U.S. and Latin American stock markets: A cross-bicorrelations perspective
Un estudio de comovimientos entre las bolsas de valores de Estados Unidos de Norteamérica y América Latina: Una perspectiva de la bicorrelación cruzada
Semei Coronado a, Omar Rojas b, Rafael Romero-Meza c & Francisco Venegas-Martínez d
a Department of Quantitative Methods, Universidad de Guadalajara,
Zapopan, México, semeic@cucea.udg.mx
b School of Business and Economics, Universidad Panamericana,
Guadalajara, México. orojas@up.edu.mx
c Facultad de Administración y Negocios, Universidad Autónoma de
Chile, Región Metropolitana, Chile, rafael.romero@uautonoma.cl
d Superior School of Economics, Instituto Politécnico Nacional,
Ciudad de México, México. fvenegas1111@yahoo.com.mx
Received: March 20th, 2015. Received in revised form: November 24th, 2015. Accepted: December 10th, 2015
This work is licensed under a Creative Commons Attribution-NonCommercial-NoDerivatives 4.0 International License.

Abstract
This work applies a test that detects
dependence between pairs of variables. The kind of dependence is a non-linear
one, and the test is known as cross-bicorrelation, which is associated with
Brooks and Hinich [1]. We study dependence periods
between U.S. Standard and Poor's 500 (SP500), used as a benchmark, and six
Latin American stock market indexes: Mexico (BMV), Brazil (BOVESPA), Chile
(IPSA), Colombia (COLCAP), Peru (IGBVL) and Argentina (MERVAL). We have found
windows of nonlinear dependence and co-movement between the SP500 and the Latin
American stock markets, some of which coincide with periods of crisis, leading
to an interpretation of a possible contagion or interdependence.
Keywords: Financial crisis; cross-bicorrelations; nonlinear dependence; co-movement; financial markets.
Resumen
Este trabajo aplica
una prueba para detectar dependencia entre pares de variables. Este tipo de
dependencia es no linear, y la prueba es conocida como bicorrelación cruzada,
la cual es asociada a Brooks y Hinich [1]. Estudiamos periodos
de dependencia no-lineal entre el índice Standard and Poor's 500 (SP500) de EUA
y seis índices de mercados accionarios latinoamericanos: México (BMV), Brasil
(BOVESPA), Chile (IPSA), Colombia (COLCAP), Perú (IGBVL) and Argentina (MERVAL).
Hemos encontrado ventanas de dependencia no-lineal y de co-movimiento entre el
SP500 y los mercados accionarios latinoamericanos, algunas de las cuales
coinciden con períodos de crisis, lo cual da paso a posibles interpretaciones
de contagio o interdependencia.
Palabras clave: Crisis financiera; bicorrelaciones cruzadas; dependencia no lineal; co-movimiento; mercados financieros.
1. Introduction
The study of the transmission of shocks from one country to another and the correlations between several countries and co-movements that cannot be explained by strong economic arguments has attracted the attention of researchers in economics and finance, as well as of practitioners. Research on this topic has significant effects, on both asset pricing, allocation and forecasting, as well as on other elements cf. [2-4].
Recently, co-movements between financial markets have been studied, with emphasis on the return on stock market indexes, through econometric or time series models that allow for a better understanding of the behavior of markets, especially through periods of crisis. A lot of this research has studied interdependencies and co-movements from the point of view of contagion, cf. [5-10]. Several approaches are adopted to analyze the co-movements between financial markets, some of which use quantitative tools borrowed mostly from physics and computational sciences, cf. [11-13].
According to [6], if two markets are highly correlated, and the correlation does not increase in one of the markets after a financial crisis, but on the contrary, there is a continuous variation in its co-movement, then both markets are highly interdependent and contagion cannot be considered as the cause of the relationship between the two markets. Thus, for these authors the privileged dimension is a linear dependency. However, there is an important line of research that emphasizes the need for an empirical verification of nonlinear univariate and multivariate dependencies. Several arguments have been put forward in favor of this route of investigation, according to [14]. On the one hand, if after running a regression there is an indication of nonlinear dependence in the error terms of a standard model, the most common being the linear one, it can be argued that the standard model does not represent the data sufficiently well. On the other hand, if the evidence of nonlinear behavior is found in the first moment, the conditional mean, the formulation of a trading scheme built on this finding would be conceivable. This would ensure that benefits greater than a passive trading plan are obtained.
In order to explore these -less known and less obvious- nonlinear relationships between financial markets and how they co-move, in this work we use the Brooks and Hinich [1] nonlinearity test, that uses a measure of the dependence between pairs of variables called the cross-bicorrelations between time series, using bivariate autoregressive vectors in high frequency data. According to [15] these tests can be viewed as natural multivariate extensions of Hinich's portmanteau bicorrelation and whiteness statistics, but in this case the test examines nonlinear characteristics for pairs of variables. The advantage in using the cross-bicorrelation test is that it addresses the specific window frames in which the nonlinear dependence is present and also signals the direction of the nonlinear dependence, which is not provided by the Granger causality test
Both univariate [16-24] and multivariate [25-27] tests have been successfully applied to analyze the nonlinear behavior of different financial and economic time series. However, to the best of our knowledge, this is the first time that such a multivariate nonlinear test is used to uncover how stock markets co-move.
Seminal works analyzing Latin American stock markets as [24] and [22] use the univariate test, as is the case of the bicorrelation. In our case, we implement a bivariate test, the cross-bicorrelation that allows us to study co-movement between pairs of variables. Thus, the cross-bicorrelation is a multivariate extension of the bicorrelation, and the cross-bicorrelation can capture most types of dependence between pairs of series of the third-order statistics.
In this paper, we use the non-linearity test proposed by [1] in order to uncover the cross-covariances and cross-correlations between U.S. Standard and Poor's 500 (SP500), used as a benchmark, and six Latin American stock market indexes: Mexico (BMV), Brazil (BOVESPA), Chile (IPSA), Colombia (COLCAP), Peru (IGBVL) and Argentina (MERVAL). We found windows of nonlinear dependence between the SP500 and the Latin American stock markets, some of which coincide with periods of crisis, leading to an interpretation of possible contagion or interdependence.
The organization of the document is the following: Section 2 presents the information collected. Section 3 describes the methodology used. Section 4 reports the empirical results. Finally, the main conclusions are presented in Section 5.
2. The data
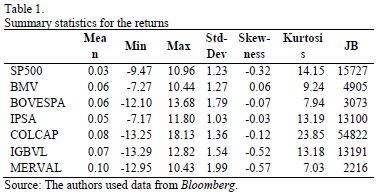
For this study we consider daily returns of seven stock market indexes, namely the U.S. Standard and Poor's 500 (SP500) is taken as a baseline market for comparison against six Latin American stock market indexes: Mexico (BMV), Brazil (BOVESPA), Chile (IPSA), Colombia (COLCAP), Peru (IGBVL) and Argentina (MERVAL). Daily closing prices from January 2nd, 2003 to January 8th, 2015, for a total of 3025 observations of each index were obtained from Bloomberg. The data was sampled for this period of time in order to capture the effects that the U.S. might have had on the Latin American equity markets during the sub-prime financial crunch and to have a broad view of other possible cross-bicorrelation phenomena. Prices were converted into a continuous rate of returns, taking natural log differences between consecutive daily closing prices of equity markets. Table 1 presents summary statistics for these returns. The statistics are consistent, as expected, with some of the characteristic particularities of financial variables [28,29]. In particular, the kurtosis indicates that return distributions are leptokurtic. Furthermore, the Jarque-Bera statistic (JB) confirms returns not normally distributed. Although the results of the KPSS test for seasonality are not listed, it does not reject the null hypothesis of seasonality or the results of the ADF and PP tests, under the null hypothesis of a unit root. Both tests with a 5% significance level are available upon request.
3. Methodology
Brooks and Hinich [1] claim that the cross-bicorrelation test would allow a researcher
identify any existence of nonlinear dependence between two pairs of variables.
The size of the sample series is N,
with two stationary variables and
and  . As we are working with the first percentual logged differences and
small sub-samples of the total series, to assume stationarity is more than
reasonable. Each series is separated into equal length non-overlapping moving
time windows or frames, where t is an
integer and k represents the k-th window and, both series are jointly
covariance stationary, which have been standardized. The test's null hypotheses
states that the two variables
  and
and  have no dependence and in
fact are pure white noise. The alternative hypothesis states that the series
have cross-covariances,
  defined as
  or any of the
cross-bicovariances,
  defined as
  , different from zero.
Under the null hypothesis,  and
and  are zero for every
  except when
 . According to the test, there is dependence between a pair of
variables if
  or
or  for at least one value of r or a pair of values of
  and
and , respectively. Next, we present the statistics that give the
  sample
  cross-correlation and the
  sample
  cross-bicorrelation,
respectively
for  , and
, and
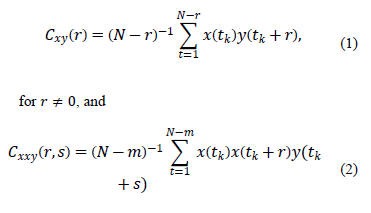
where  .
.
We can interpret the cross-bicorrelations
as the degree of relation of the value of one variable with the value of the
cross-correlation of the two variables. The second-order test does not include
current elements, and is executed on the errors terms of an  fit to clean out the
univariate autocorrelation arrangement. Thus current correlations will not be
reason for rejecting the null hypothesis. To perform the third-order test, we
apply the test on the errors terms of a
  model having a current term
in one of the equations (the order p of the
  and
and  models is chosen to optimize
the Schwartz (BIC) criterion). The pre-whitening step is grounded on the
elimination of any presence of linear correlation or cross-correlation.
Therefore any outstanding dependence between the variables should be classified
as nonlinear. Let
  where
where  (for our case of study we use
  , and thus we have 121 non-overlapped windows of length 25 days).
The corresponding test statistics for non-zero cross-correlations and
cross-bicorrelations are

And

for  , respectively. In these statistics
  is the number of times that
the correlations are verified and
  is the number times that the
cross-bicorrelations are probed. Following [15], we state that
  and
and are asymptotically
  with
with  and
and  degrees of freedom,
respectively, as
4. Empirical results
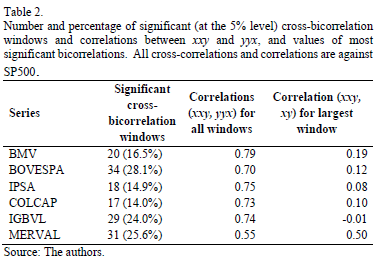
In Table 2, we report the results for the cross-bicorrelation test. All tests are run taking SP500 as the benchmark for comparison, since the effects of the U.S. on Latin America are the ones we wanted to test. We present the number and percentage of significant (at the 5% level) cross-bicorrelation windows, correlation for all windows and the correlation for the largest window. As can be seen, the countries with the most significant cross-bicorrelation windows are Brazil (BOVESPA), Argentina (MERVAL) and Peru (IGBVL), with 28.1%, 25.6% and 24.0% of significant windows, respectively. On the other hand, Colombia (COLCAP), Chile (IPSA) and Mexico (BMV) are the countries with less significant windows (14.0%, 14.9% and 16.5%, respectively). As for the correlations for all windows, most countries present a correlation between 0.70 and 0.79, with the exception of Argentina (0.55). Furthermore, the country with an episode of largest correlation (0.50) was Argentina, whereas the one with the lowest correlation for a single episode was Peru (-0.01). These results shed light on the degree of dependence and co-movement between economies.
In Table 3 we present the dates of significant cross-bicorrelation windows between the SP500 benchmark and the six Latin American stock market indexes, labeled in the following way: BMV (A), BOVESPA (B), IPSA (C), COLCAP (D), IGBVL (E) and MERVAL (F). All windows are of 25 labor days of length, for a total of 121 windows. During 2003, Brazil and Argentina showed significant cross-bicorrelation windows with the U.S. For the years of 2004 to April 2007, the markets do not co-move, with the exception of a significant window from 6/26 to 7/31 between SP500 and BMV. In the middle of 2007 the effects of the U.S. are visible on some Latin American countries: Mexico, Brazil and Peru are affected earlier than Chile, Colombia and Argentina. However, the effects of the sub-prime financial crisis were felt on all countries from September 2008 lasting till July 2009 (Table 3 (cont.)). From August 2009 to June 2011, there was not much co-movement, Peru being the exception with significant cross-bicorrelation windows during these years. Another block of co-movement was visible from July to December 2011, which might have happened due to the European sovereign debt crisis and some of the concerns over the U.S.'s slow economic growth and its credit rating being downgraded. From 2012 to January 2015, the countries that continued to show significant cross-bicorrelations with the U.S. were Brazil and Argentina.
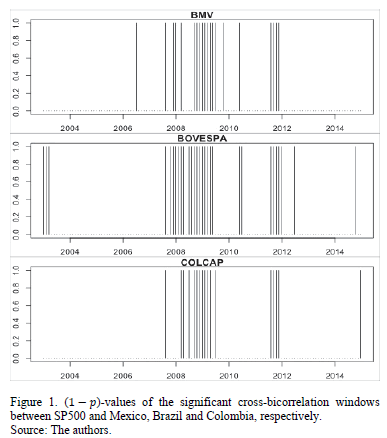
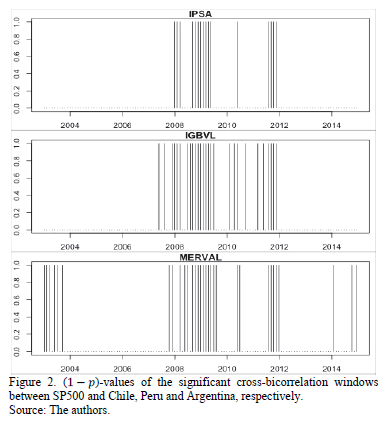
In Fig. 1 and Fig. 2, we plot the ( -values of the significant
cross-bicorrelation windows between SP500 and Mexico, Brazil and Colombia (Fig.
1), and Chile, Peru and Argentina (Fig. 2). These windows correspond to the
ones reported in Table 2 and 3. It is clear how there are two main periods of
nonlinear dependence between U.S. and Latin American stock markets: 2008-2009
and 2011. Brazil and Argentina showed cross-bicorrelations with the U.S. in
2003.
In Fig. 3 we
plot the normalized prices for the SP500, BOVESPA and COLCAP indexes. The SP500
is the benchmark and it is compared with BOVESPA that presents the most
significant cross-bicorrelation windows (28.1%) and COLCAP that presents the
least significant percentage of windows (14.0%). We also plot the returns and
the ( -values of the significant
cross-bicorrelation windows. As can be seen in the prices and returns plots, it
is clear how for the year 2008 and the year 2011, the SP500 falls in prices and
has a higher volatility before the other indexes.
5. Conclusions
In this document we have successfully applied the Brooks and Hinich [1] cross-bicorrelation test to uncover the cross-covariances and cross-correlations between U.S. Standard and Poor's 500 (SP500), used as a benchmark, and six Latin American stock markets indexes: Mexico (BMV), Brazil (BOVESPA), Chile (IPSA), Colombia (COLCAP), Peru (IGBVL) and Argentina (MERVAL). We found windows of nonlinear dependence between SP500 and the Latin American stock markets, some of which coincide with periods of crisis, giving way to an interpretation of possible contagion or interdependence. Using a different but related methodology, [23] found that there are several periods where there were international financial crises that present strong univariate nonlinearity for several Latin American financial markets.
This nonlinearity test presents several advantages, since it would be capable of detecting any form of nonlinear dependence of the third-order statistics between two pairs of variables. Furthermore, it offers a helpful tool for academics to study the functional form of the nonlinear association between the pairs of variables by defining in which direction the cross-bicorrelations flow and which of the lags are important. Given that this test allows the researcher to determine the third-order nonlinear dependency forms between pairs of series, it can be used as a supplementary instrument to the Granger causality test.
We have identified some moments of cross-bicorrelations that might be interesting to explore from a deeper economic point of view and it is left as a work in progress. Furthermore, following [23], it would be interesting to run a test including overlapped windows in a rolling scheme. Thus, like [23] it would be possible to identify the start, the end, the intensity and persistence of the cross-bicorrelation instead of just the bicorrelation.
Acknowledgements
The authors would like to acknowledge Jorge Ahumada García (MSc in Economics student, ITAM) for his help providing some of the data used in this paper and Itzel Cano (Universidad Panamericana) for her help formatting some of the tables. All errors remain the sole responsibility of the authors.
The authors are grateful for the support of FONDECYT (Project 1111034).
References
[1] Brooks, C., and Hinich, M.J., Cross-correlations and cross-bicorrelations in sterling exchange rates, Journal of Empirical Finance. 6(4), pp. 385-404, 1999. DOI: 10.1016/S0927-5398(99)00007-9
[2] Velásquez, J.D., Franco, C.J. and Camacho, P., Nonlinear time series forecasting using MARS, DYNA. 81(184), pp. 11-19, 2014. DOI; 10.15446/dyna.v81n184.39699
[3] Velásquez, J.D., Zambrano, C. and Franco, C.J., A comparison of exponential smoothing and neural networks in time series prediction, DYNA. [Online]. 80(182), pp. 66-73, 2013. [date of reference December 1rd of 2015]. Available at: http://revistas.unal.edu.co/index.php/dyna/article/view/41564/43245
[4] Velásquez, J.D., Morales, Y.O. and Franco, C.J., Time series analysis and forecasting in energy markets using the R language, DYNA. [Online]. 78(165), pp. 287-296, 2011. [date of reference December 1rd of 2015]. Available at: http://revistas.unal.edu.co/index.php/dyna/article/view/25670
[5] Aloui, R., Ben Aïssa, M.S. and Nguyen,D.K., Global financial crisis, extreme interdependences, and contagion effects: The role of economic structure?, Journal of Banking & Finance. 35(1), pp. 130-141, 2011. DOI: 10.1016/j.jbankfin.2010.07.021.
[6] Forbes, K.J. and Rigobon, R., No contagion, only interdependence: measuring stock market comovements, The Journal of Finance. 57(5), pp. 2223-2261, 2002. DOI: 10.1111/0022-1082.00494.
[7] Kenourgios, D., Samitas, A. and Paltalidis, N., Financial crises and stock market contagion in a multivariate time-varying asymmetric framework, Journal of International Financial Markets, Institutions and Money 21(1), pp. 92-106, 2011. DOI: 10.1016/j.intfin.2010.08.005.
[8] Caramazza, F., Ricci, L. and Salgado, R., International financial contagion in currency crises, Journal of International Money and Finance. 23(1), pp. 51-70, 2004. DOI: 10.1016/j.jimonfin.2003.10.001
[9] Corsetti, G., Pericoli, M. and Sbracia, M., Some contagion, some interdependence: More pitfalls in tests of financial contagion, Journal of International Money and Finance. 24(8), pp. 1177-1199, 2005. DOI: 10.1016/j.jimonfin.2005.08.012
[10] Chiang, T.C., Jeon, B.N. and Li, H., Dynamic correlation analysis of financial contagion: Evidence from Asian markets, Journal of International Money and Finance. 26(7), pp. 1206-1228, 2007. DOI: 10.1016/j.jimonfin.2007.06.005
[11] Laloux, L., Cizeau, P., Bouchaud, J.P. and Potters, M., Noise dressing of financial correlation matrices, Physical Review Letters. 83(7) pp. 1467-1470, 1999. DOI: 10.1103/PhysRevLett.83.1467.
[12] Plerou, V., Gopikrishnan, P., Rosenow, B., Amaral, L.A.N., Guhr, T. and Stanley, H.E., Random matrix approach to cross correlations in financial data, Phys. Rev. E. 65(6), pp. 66126-66144, 2002. DOI: 10.1103/PhysRevE.65.066126
[13] Evans, T. and McMillan, D.G., Financial co-movement and correlation: evidence from 33 international stock market indices, International Journal of Banking, Accounting and Finance. 1(3), pp. 215-241, 2009. DOI: 10.1504/IJBAAF.2009.022711
[14] Czamanski, D., Dormaar, P., Hinich, M.J. and Serletis, A., Episodic nonlinearity and nonstationarity in Alberta's power and natural gas markets, Energy Economics. 29(1), pp. 94-104, 2007. DOI: 10.1016/j.eneco.2006.08.002
[15] Hinich, M.J., Testing for dependence in the input to a linear time series model, Journal of Nonparametric. Statistics. 6(2-3), pp. 205-221, 1996. DOI: 10.1080/10485259608832672
[16] Coronado-Ramírez, S., Celso-Arellano, P.L.,and Rojas,O., Adaptive market efficiency of agricultural commodity futures contracts, Contaduria y Administración. 60(2), pp. 389-401, 2015. DOI: 10.1016/S0186-1042(15)30006-1
[17] Romero-Meza, R., Bonilla, C.A. and Hinich, M.J., Nonlinear event detection in the Chilean stock market, Applied Economics Letters. 14(13), pp. 987-991, 2007. DOI:10.1080/13504850600706024
[18] Hinich, M.J. and Serletis, A., Episodic nonlinear event detection in the Canadian exchange rate, Journal of the American Statistical Association. 102(477), pp. 68-74, 2007. DOI: 10.1198/016214506000001004
[19] Bonilla, C.A., Maquieira, C.P. and Romero-Meza, R., Nonlinear behaviour of emerging market bonds spreads: The Latin American case, Applied Economics. 40(2), pp. 2697-2702, 2008. DOI: 10.1080/00036840600970245
[20] Lim, K.P.R., Brooks, D. and Hinich, M.J., Nonlinear serial dependence and the weak-form efficiency of Asian emerging stock markets, Journal of International Financial Markets, Institutions and Money. 8(5), pp. 527-544, 2008. DOI: 10.1016/j.intfin.2007.08.001
[21] Coronado-Ramírez, S., Ramírez-Grajeda, M. and Celso-Arellano, P.L. Inefficiency in the international coffee market: The case of Colombian arabica, African J. Agric. Res. 9(5), pp. 556-561, 2014. DOI: 10.5897/AJAR11.2228
[22] Bonilla, C.A., Romero-Meza, R. and Maquieira, C., Nonlinearities and garch inadequacy for modeling stock market returns: Empirical evidence from Latin America, Macroeconomics Dynamics. 15(5), pp. 713-724, 2011. DOI: 10.1017/S1365100510000295
[23] Romero-Meza, R., Bonilla, C., Benedetti, H. and Serletis, A., Nonlinearities and financial contagion in Latin American stock markets. Economic Modelling, 51, pp. 653-656, 2015. DOI: 10.1016/j.econmod.2015.09.012
[24] Bonilla, C.A., Romero-Meza, R. and Hinich, M.J., Episodic nonlinearity in Latin American stock market indices. Applied Economics Letters, 13(3), 195-199, 2006. DOI: 10.1080/13504850500392750
[25] Brooks, C. and Hinich, M.J., Bicorrelations and cross-bicorrelations as non-linearity tests and tools for exchange rate forecasting, Journal of Forecasting. 20(3), pp. 181-196, 2001. DOI: 10.1002/1099131X(200104)20:3<181::AIDFOR781>3.0.CO;2-R
[26] Serletis, A., Malliaris, A.G., Hinich, M.J. and Gogas, P., Episodic nonlinearity in leading global currencies, Open Economics. Review. 23(2), pp. 337-357, 2012. DOI: 10.1007/s11079-010-9194-9
[27] Romero-Meza, R., Coronado, S. and Serletis, A., Oil and the economy: A cross bicorrelation perspective, The Journal of Economics Asymmetrics. 11, pp. 91-95, 2014. DOI: 10.1016/j.jeca.2014.08.003
[28] Cont, R., Empirical properties of asset returns: Stylized facts and statistical issues, Quantitative. Finance. 1, pp. 223-236, 2001. DOI: 10.1080/713665670
[29] Rojas, O. and Trejo-Pech, C., Financial time series: Stylized facts for the Mexican stock exchange index compared to developed markets, in Nonlinear Time Series and Finance, Coronado-Ramírez, S., Celso-Arellano, P.L. and Trejo-Pech, C., Eds. Universidad de Guadalajara, Mexico, 2014, pp. 228-245.
S. Coronado, obtained a PhD. degree in Business and Economics from the University of Guadalajara, in Guadalajara, Mexico. He is a research professor in the Department of Quantitative Methods at the University of Guadalajara. He is currently a member of the Mexican National System of Researchers (Level I, CONACYT) where his research areas of interest are time series, emerging market finance and applied statistics. ORCID: 0000-0002-7945-7155
O. Rojas, received his PhD in Mathematics from La Trobe University, Melbourne, Australia. He is associate professor and research Director at the School of Business and Economics at Universidad Panamericana, Guadalajara, Mexico. His research areas of interest are: nonlinear time series and multivariate statistical methods applied to business. He is a member of Mexican National System of Researchers (Level C, CONACYT). ORCID: 0000-0002-0681-3833
R. Romero-Meza, received a Dr. of Business Administration (DBA) from Boston University. He is research professor at Facultad de Administración y Negocios at Universidad Autónoma de Chile, and he is also Director of Global Council of PKF International Finance. Dr. Romero-Meza has over twenty academic articles in applied economics, applied economics letters, macroeconomic dynamics, economic modelling, the Journal of Economic Asymmetries among others. He participates as referee in several journals: Energy Economics, Economics Letters, INNOVAR, Emerging Markets. His research and teaching interests are in emerging markets, efficient markets, nonlinear time series, and corporative finance. ORCID: 0000-0001-5108-2681
F. Venegas-Martinez, was a PhD. researcher in Finance at Oxford University. He received his PhD in Mathematics and a second PhD in economics from Washington State University. He is a professor in Instituto Politécnico Nacional, Mexico. Dr. Vengas-Martínez is a member of the Mexican National System of Researchers (Level III, CONACYT). He participates in more than 20 editorial boards and scientific research journals, in Mexico and internationally. Dr Venegas-Martínez has over a hundred academic articles in The Brazilian Journal of Probability, Journal of the Inter-American Statistics and Econometrics, Journal of Economic Dynamics and Control, International Journal of Theoretical and Applied Finance, Journal of Economic Modeling, Journal of Development Economics, among others. His research areas of interest are stochastic process, econometrics, time series, and economic development. ORCID: 0000-0002-1528-5593
Cómo citar
IEEE
ACM
ACS
APA
ABNT
Chicago
Harvard
MLA
Turabian
Vancouver
Descargar cita
CrossRef Cited-by
1. Luciana S. Malagrino, Norton T. Roman, Ana M. Monteiro. (2018). Forecasting stock market index daily direction: A Bayesian Network approach. Expert Systems with Applications, 105, p.11. https://doi.org/10.1016/j.eswa.2018.03.039.
2. Simeon Coleman, Vitor Leone, Otavio R. de Medeiros. (2019). Latin American stock market dynamics and comovement. International Journal of Finance & Economics, 24(3), p.1109. https://doi.org/10.1002/ijfe.1708.
3. Diego Ferreira, Andreza A. Palma. (2022). On the subprime crisis and the Latin American financial markets: A regime switching skew‐normal approach. International Journal of Finance & Economics, 27(3), p.3300. https://doi.org/10.1002/ijfe.2322.
4. Amrita Kaur, Prabhat Mittal. (2023). Wavelet based analysis of oil price shocks, exchange rate and stock market behaviour: Evidences from emerging markets. OPEC Energy Review, 47(3), p.163. https://doi.org/10.1111/opec.12277.
Dimensions
PlumX
Visitas a la página del resumen del artículo
Descargas
Licencia
Derechos de autor 2016 DYNA

Esta obra está bajo una licencia internacional Creative Commons Atribución-NoComercial-SinDerivadas 4.0.
El autor o autores de un artículo aceptado para publicación en cualquiera de las revistas editadas por la facultad de Minas cederán la totalidad de los derechos patrimoniales a la Universidad Nacional de Colombia de manera gratuita, dentro de los cuáles se incluyen: el derecho a editar, publicar, reproducir y distribuir tanto en medios impresos como digitales, además de incluir en artículo en índices internacionales y/o bases de datos, de igual manera, se faculta a la editorial para utilizar las imágenes, tablas y/o cualquier material gráfico presentado en el artículo para el diseño de carátulas o posters de la misma revista.


