


Publicado
New methodology to diagnose reliability of a single distribution circuit in Colombia
Nueva metodología para el diagnóstico de la confiabilidad de un circuito individual de distribución en Colombia
DOI:
https://doi.org/10.15446/dyna.v84n201.54330Palabras clave:
Assess reliability, Colombian electric utilities, methodology, diagnose the reliability, single distribution circuit, reliability indexes, causes of failure, files, applications, Microsoft Excel, EMCALI EICE ESP, case study, ETAP software (en)Evaluar la confiabilidad, empresas del sector eléctrico colombiano, metodología, diagnosticar la confiabilidad, circuito individual de distribución, índices de confiabilidad, causas de falla, archivos, aplicaciones, Microsoft Excel, EMCALI EICE ESP, caso (es)
Descargas
Recibido: 23 de noviembre de 2015; Revisión recibida: 1 de octubre de 2016; Aceptado: 25 de noviembre de 2016
Abstract
A reliable electric power supply is of ever increasing importance in the Colombian electricity market. As such, the Energy and Gas Regulation Commission, (CREG for its acronym in Spanish), has contracted technical studies to be undertaken in order to assess reliability for Colombian electric utilities. This paper focuses on a new methodology to diagnose the reliability of a single distribution circuit that is to be used in Colombian electric utilities. The proposed methodology includes calculating known reliability indexes (SAIFI, SAIDI, CAIDI, etc.) as well as new reliability indexes in order to determine the incidence of causes of failure. This paper explains some of the required files´ characteristics (input and output files) in order to execute two applications associated with the previously mentioned methodology. These two applications were developed using Microsoft Excel for the Strategic Energy Business Unit at EMCALI EICE ESP, located on Santiago de Cali, Valle del Cauca, Colombia, South America. This article describes some features of these applications. The first case study presented, about the first application, is calculated based on this methodology, and results obtained are compared with those obtained using ETAP software. Finally, the second case study, regarding the second application, is calculated based on this methodology and results obtained are shown in this document.
Keywords :
Assess reliability, Colombian electric utilities, methodology, diagnose the reliability, single distribution circuit, reliability indexes, causes of failure, files, applications, Microsoft Excel, EMCALI EICE ESP, case study, ETAP software.Resumen
El suministro confiable de energía eléctrica es cada vez más importante en el mercado eléctrico colombiano. De esta manera, la Comisión de Regulación de Energía y Gas, (CREG por su sigla en español), ha contratado estudios técnicos a ser llevados a cabo a fin de evaluar la confiabilidad de las empresas del sector eléctrico colombiano. Este trabajo se enfoca en una nueva metodología para diagnosticar la confiabilidad de un circuito individual de distribución a ser utilizado en las empresas del sector eléctrico colombiano. La metodología propuesta incluye el cálculo de índices de confiabilidad conocidos (SAIFI, SAIDI, CAIDI, etc.), así como nuevos índices de confiabilidad con el fin de determinar la incidencia de las causas de falla. Este documento explica algunas características de los archivos requeridos (archivos de entrada y salida) con el fin de ejecutar dos aplicaciones asociadas con la metodología mencionada anteriormente. Estas dos aplicaciones fueron desarrolladas utilizando Microsoft Excel para la Unidad Estratégica de Negocio de Energía de EMCALI EICE ESP, localizada en Santiago de Cali, Valle del Cauca, Colombia, Sudamérica. Este artículo describe algunas características de estas aplicaciones. El primer caso de estudio presentado, sobre la primera aplicación, se calcula sobre la base de esta metodología y los resultados obtenidos se comparan con aquellos obtenidos utilizando el software ETAP. Por último, el segundo caso de estudio, con respecto a la segunda aplicación, se calcula sobre la base de esta metodología y los resultados obtenidos se muestran en este documento.
Palabras clave :
Evaluar la confiabilidad, empresas del sector eléctrico colombiano, metodología, diagnosticar la confiabilidad, circuito individual de distribución, índices de confiabilidad, causas de falla, archivos, aplicaciones, Microsoft Excel, EMCALI EICE ESP, caso de estudio, software ETAP.1. Introduction
The two approaches to reliability assessment of electrical power systems are historical evaluation and predictive evaluation. Historical reliability evaluation involves the collection and analysis of an electric system’s outage and interruption data.
Predictive evaluation determines the long-term behavior of systems by combining component failure rates and the duration of repair, restoration, and switching and isolation activities that describe the tendency of an entire utility’s distribution system for given network configurations [1,2].
The Energy and Gas Regulation Commission, (CREG for its acronym in Spanish), has contracted technical studies to be undertaken regarding historical reliability assessment. The SAIFI and SAIDI indexes per each electric utility have been calculated in these studies [3]. Colombian electric utilities require a methodology to be used, which allow a reliability diagnosis to be performed from a historical assessment point of view. It is necessary to start with a historical reliability assessment in order to later continue with predictive reliability assessment. In terms of the Colombian electricity market, a good starting point is a methodology that allows for a reliability diagnosis to be undertaken of a single distribution circuit. Colombian electric utilities require a reliability diagnosis, which allows them to calculate known reliability indexes to measure the quality of service as well as new indexes to determine the incidence of causes of failure. It is also important to determine of the incidence of causes of failure as this allows the investments to be defined that are aimed at improving the reliability of distribution circuits [10-12].
2. Brief description of the methodology
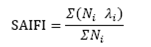
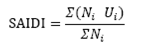
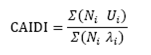
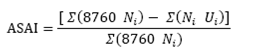
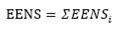
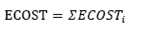
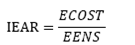
Two applications were developed for the methodology using Microsoft Excel, which allowed the reliability diagnosis of a single distribution circuit to be performed. These applications are RELIABILITY-INDEXES-CALCULATION.xlsm and RELIABILITY-INPUT-DATA-AND-STATISTICS.xlsm. Initial information corresponds to causes.xls and circuit.xls files. RELIABILITY-INPUT-DATA-AND-STATISTICS.xlsm opens and processes these two files in order to generate two output files. The output files are RELIABILITY-INPUT-DATA.xls and RELIABILITY-STATISTICS.xls. This last file is used to show the values of new reliability indexes to determine the incidence of causes of failure. RELIABILITY-INPUT-DATA.xls is used to show the reliability input data required to calculate known reliability indexes. The known reliability indexes are SAIFI (System Average Interruption Frequency Index), SAIDI (System Average Interruption Duration Index), CAIDI (Customer Average Interruption Duration Index), ASAI (Average Service Availability Index), ASUI (Average Service Unavailability Index), EENS (Expected Energy Not Supplied Index), ECOST (Expected Interruption Cost Index), AENS (Average Energy Not Supplied Index), and IEAR (System Interrupted Energy Assessment Rate Index) [4-6].
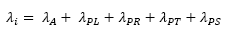
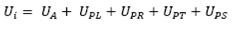
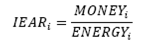
RELIABILITY-INPUT-DATA-AND-STATISTICS.xlsm calculates the reliability input data and the reliability statistics. The reliability input data are λA (active failure rate), λPR (passive failure rate on the primary line, the failures of which can be cleared using a recloser), λPL (passive failure rate on the primary line, the failures of which cannot be cleared by means of a recloser), λPT (passive failure rate of primary electrical equipment, which is composed of a transformer, fuses and a surge arrester), λPS (passive failure rate for the secondary network system), UA (active outage duration), UPR (passive outage duration on the primary line, the failures of which can be cleared by means of a recloser), UPL (passive outage duration on the primary line, the failures of which cannot be cleared by means of a recloser), UPT (passive outage duration for primary electrical equipment, which is composed of a transformer, fuses and a surge arrester), UPS (passive outage duration for the secondary network system), MONEYi, ENERGYi, IEARi, Ni and Pi. Based on the above, the mathematical formulas associated with reliability input data and selected reliability indexes are as follows:
 (1)
(1)
 (2)
(2)
 (3)
(3)
 (4)
(4)
 (5)
(5)
 (6)
(6)
 (7)
(7)
 (8)
(8)
 (9)
(9)
 (10)
(10)
 (11)
(11)
 (12)
(12)
 (13)
(13)
 (14)
(14)
 (15)
(15)
 (16)
(16)
 (17)
(17)
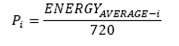
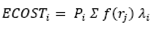
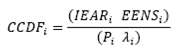
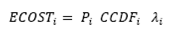
Where λi is the average failure rate at load point i, Ui is the annual outage duration at load point i, Pi is the average load of load point i, ENERGYAVERAGE-i is the average monthly active energy consumption in the last year at load point i, EENSi is the expected energy not supplied index at load point i, ECOSTi is the expected interruption cost index at load point i, f(rj) is the CCDF (Composite Customer Damage Function) for element j, IEARi is the interrupted energy assessment rate index at load point i, MONEYi is the last month´s sum of invoiced values for active energy consumed by customers connected to load point i, ENERGYi is the sum of energies consumed by customers over the last month connected to load point i, CCDFi is the CCDF at load point i, and Ni is the number of customers at load point i [7,8]. For Colombian electric utilities, a load point i is the same as a primary node with an associated load. The sum of invoiced values related to the MONEYi calculation is performed through the Unitary Cost per each customer according to Colombian electricity market regulations [9].
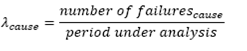
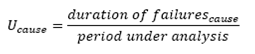
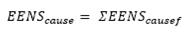
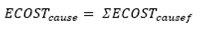
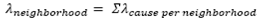
RELIABILITY-INPUT-DATA-AND-STATISTICS.xlsm also calculates new reliability indexes to determine incidence of causes of failure. These new reliability indexes are: λPR, λPL, λPT, λPS, UPR, UPL, UPT, UPS, EENScause (expected energy not supplied index associated with the cause of failure), ECOSTcause (expected interruption cost index associated with the cause of failure), EENSA (expected energy not supplied index associated with active failures), EENSPL (expected energy not supplied index associated with passive failures at the primary line, the failures of which cannot be cleared by means of a recloser), EENSPR (expected energy not supplied index associated with passive failures at the primary line, the failures of which can be cleared by means of a recloser), EENSPT (expected energy not supplied index associated with passive failures of primary electrical equipment, which is composed of a transformer, fuses and a surge arrester), EENSPS (expected energy not supplied index associated with passive failures at the secondary network system), ECOSTA (expected interruption cost index associated with active failures), ECOSTPL (expected interruption cost index associated with passive failures at the primary line, the failures of which cannot be cleared by means of a recloser), ECOSTPR (expected interruption cost index associated with passive failures at the primary line, the failures of which can be cleared by means of a recloser), ECOSTPT (expected interruption cost index associated with passive failures of primary electrical equipment, which is composed of a transformer, fuses and a surge arrester), ECOSTPS (expected interruption cost index associated with passive failures at the secondary network system), and λcause per neighborhood (average failure rate associated with the cause of failure in the given neighborhood). Thus, the missing mathematical formulas relating to the above mentioned indexes are as follows:
 (18)
(18)
 (19)
(19)
 (20)
(20)
 (21)
(21)
 (22)
(22)
 (23)
(23)
 (24)
(24)
 (25)
(25)
 (26)
(26)
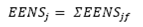
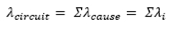
Where λcause is the average failure rate associated with the cause of failure, number of failurescause is the number of valid failure records that the given cause of failure presents, duration of failurescause is the sum of durations of valid failure records that the given cause of failure presents, period under analysis is the time period measured in years for which the reliability diagnosis is performed, Ucause is the annual outage duration associated with the cause of failure, EENScausef is the expected energy not supplied index associated with the cause of failure, which corresponds to failure record f, ECOSTcausef is the expected interruption cost index associated with the cause of failure, which corresponds to failure record f, j is the element in which the failure occurred (j can be any of these values: A, PL, PR, PT or PS), EENSj is the expected energy not supplied index associated with element j, EENSjf is the expected energy not supplied index associated with element j, which corresponds to failure record f, ECOSTj is the expected interruption cost index associated with element j, ECOSTjf is the expected interruption cost index associated with element j, which corresponds to failure record f, λcircuit is the average failure rate of the distribution circuit under study, Ucircuit is the annual outage duration of the distribution circuit under study, and λneighborhood is the average failure rate in the given neighborhood.
3. First case study
A case study was performed for RELIABILITY-INDEXES-CALCULATION.xlsm. The circuit diagram of the first case study is as follows:
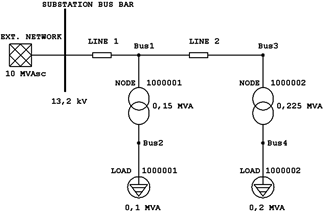
Figure 1: Diagram of the circuit for the first case study, solved by ETAP software and RELIABILITY-INDEXES-CALCULATION.xlsm.
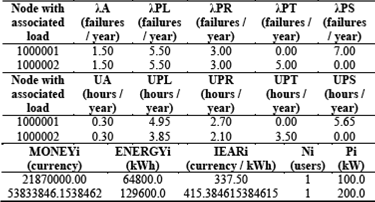
Source: The authors.Table 1: Data of RELIABILITY-INPUT-DATA.xls file.
Source: The authors.Table 2: RELIABILITY-INDEXES-CALCULATION.xlsm execution results.
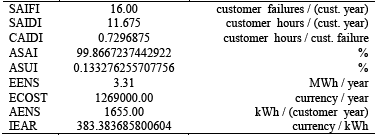
Reliability input data are shown in Table 1. Results obtained and generated by using the RELIABILITY-INDEXES-CALCULATION.xlsm application are shown in Table 2. Results obtained by using of ETAP software are shown in Fig. 2. As can be seen, the results obtained with ETAP software are the same as those obtained through the RELIABILITY-INDEXES-CALCULATION.xlsm application. According to these results, on average a customer suffers: 16 electrical faults per year, 11.675 hours without electricity per year, 0.73 hours without electricity per failure, and 1655 kWh without consuming per year.
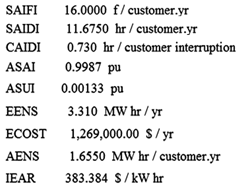
Figure 2: Results obtained by ETAP software.
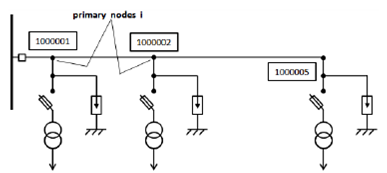
Figure 3: Unifilar diagram of the circuit for the second case study, solved by RELIABILITY-INPUT-DATA-AND-STATISTICS.xlsm.
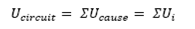
For the distribution circuit under study: The electrical service is provided for a total of 99.87% of the time, the electrical service is not provided for a total of 0.133% of the time, 3.31 MWh per year is the expected amount of energy that is not supplied, $1269000.00 per year is the expected interruption cost of this energy, and $383.384 per kWh is the interrupted energy assessment rate.
4. Second case study
A case study was performed for the RELIABILITY-INPUT-DATA-AND-STATISTICS.xlsm application. The unifilar diagram of the circuit for the second case study is shown as follows:
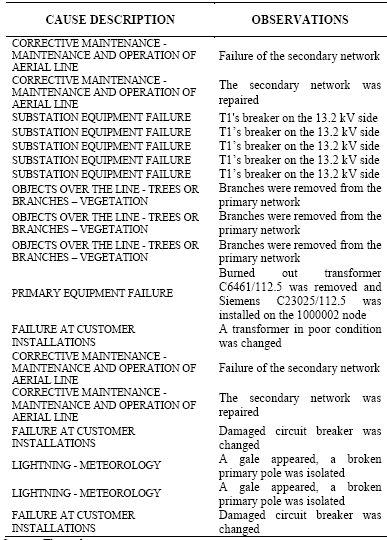
Causes of failure are shown in Table 3, and these causes appear in causes.xls file. The content of the BASIC-DATA worksheet belonging to the circuit.xls file is shown in Table 4. The content of the FINANCIAL-INFORMATION worksheet belonging to the circuit.xls file is shown in Table 5. The content of the NODE-INFORMATION worksheet belonging to the circuit.xls file is shown in Table 6. As can be seen, the circuit under study corresponds to UNIVERSE ZONE. The application does not take into account other circuits that are different to the one which appears in the BASIC-DATA worksheet belonging to the circuit.xls file. Thus, PLANET ZONE circuit was not taken into account by RELIABILITY-INPUT-DATA-AND-STATISTICS.xlsm.
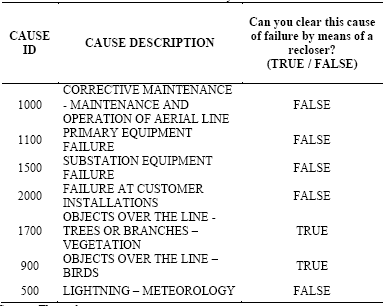
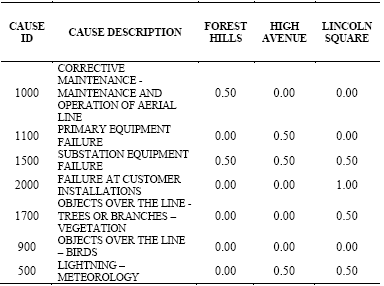
Source: The authors.Table 3: Causes of failure used for the second case study.
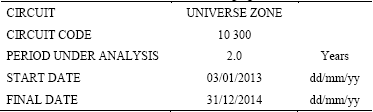
Source: The authors.Table 4: Content of the BASIC-DATA worksheet belonging to the circuit.xls file.
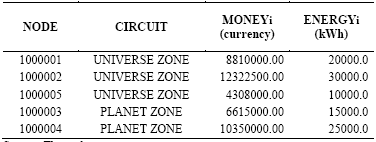
Source: The authors.Table 5: Content of the FINANCIAL-INFORMATION worksheet belonging to the circuit.xls file.
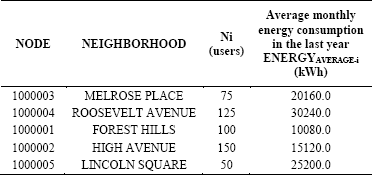
Source: The authors.Table 6: Content of the NODE-INFORMATION worksheet belonging to the circuit.xls file.
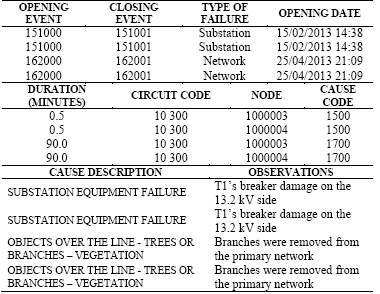
Source: The authors.Table 7: Content of columns A, B, C and D from the FAILURES worksheet belonging to the circuit.xls file.
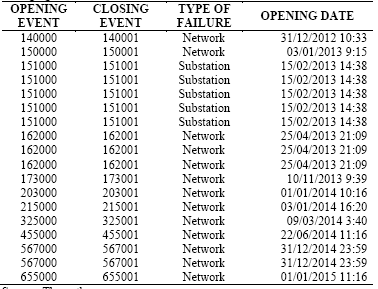
Source: The authors.Table 8: Content of columns E, F, G and H from the FAILURES worksheet belonging to the circuit.xls file.
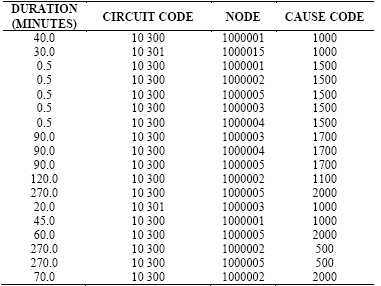
The content of the FAILURES worksheet belonging to the circuit.xls file is shown in Tables 7, 8 and 9. Executing the RELIABILITY-INPUT-DATA-AND-STATISTICS.xlsm application completes the content of the RELIABILITY-INPUT-DATA.xls file, as can be seen in Table 10. As such, the RELIABILITY-INDEXES-CALCULATION.xlsm application can process this last file in order to calculate the selected reliability indexes.
RELIABILITY-INPUT-DATA-AND-STATISTICS.xlsm allows all the data contained in the worksheets belonging to the RELIABILITY-STATISTICS.xls file to be completed. Consequently, the results of the worksheet CAUSES-GENERAL-REPORT are shown in Table 11. The results of the FAILURES-PER-NEIGHBORHOOD worksheet can be seen in Table 12. The results from the EENS-ECOST-PER-ELEMENT worksheet are shown in Table 13.
Source: The authors.Table 9: Content of columns I and J from the FAILURES worksheet belonging to the circuit.xls file.
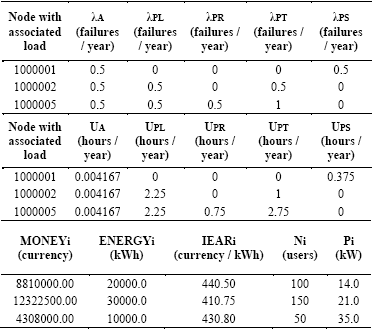
Source: The authors.Table 10: Data from the RELIABILITY-INPUT-DATA.xls file are completed using RELIABILITY-INPUT-DATA-AND-STATISTICS.xlsm.
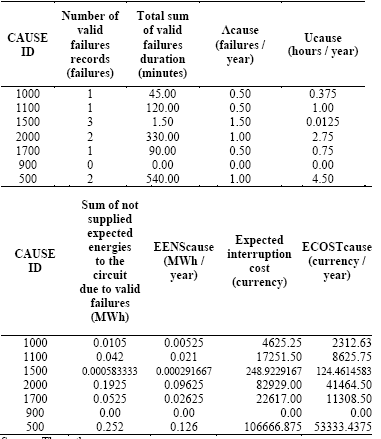
Source: The authors.Table 11: Data contained in Columns A, C, D, E, F, G, H, I and J are from the CAUSES-GENERAL-REPORT worksheet, which is part of the RELIABILITY-STATISTICS.xls file.
Source: The authors.Table 12: Data from the FAILURES-PER-NEIGHBORHOOD worksheet, which was taken from the RELIABILITY-STATISTICS.xls file.
RELIABILITY-INPUT-DATA-AND-STATISTICS.xlsm allows for the content of the INVALID-FAILURES worksheet to be completed, as can be seen in Table 15. This application also completes the content of the GENERAL-INFORMATION worksheet, as can be seen in Table 14.
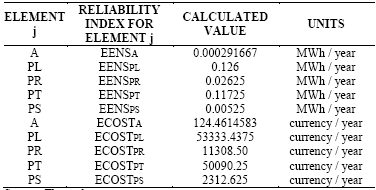
Source: The authors.Table 13: Contents of the EENS-ECOST-PER-ELEMENT worksheet, which was taken from the RELIABILITY-STATISTICS.xls file.
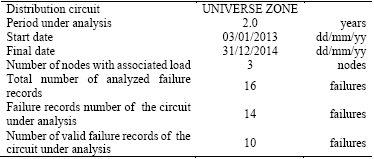
Source: The authors.Table 14: Contents of the GENERAL-INFORMATION worksheet, which was taken from the RELIABILITY-STATISTICS.xls file.
Source: The authors.Table 15: Contents of the INVALID-FAILURES worksheet, which was taken from the RELIABILITY-STATISTICS.xls file.
According to Table 10: Node 1000001 only has active failures and passive failures in the secondary network system. For this node, failures in the secondary network system have the longest outage duration. In fact, active outage durations are the shortest for the three nodes under study. Node 1000002 has failures everywhere except in the secondary network system and on the primary line, for which faults can be cleared by means of a recloser. For this node, failures on the primary line, the faults of which cannot be cleared by means of a recloser, have the longest outage duration. Node 1000005 has failures everywhere except on the secondary network system. This node has the longest outage duration and the largest failure rate, given by passive failures, for primary electrical equipment composed of a transformer, fuses and a surge arrester. According to Table 11, the largest number of failure records corresponds to cause ID 1500 (SUBSTATION EQUIPMENT FAILURE), the longest duration of the total sum of valid failures corresponds to cause ID 500 (LIGHTNING - METEOROLOGY), the largest amount of expected energy not supplied that is associated with the cause of failure is equal to 0.126 MWh / year for cause ID 500 (LIGHTNING - METEOROLOGY). This cause ID also has the largest expected interruption cost. According to Table 12, the FOREST HILLS neighborhood has the smallest number of failures per year, and the LINCOLN SQUARE neighborhood has the largest amount of failures per year.
According to Table 13, the largest amount of expected energy not supplied associated with element j is equal to 0.126 MWh per year, for which the element j corresponds to passive failures take place on the primary line, and the faults cannot be cleared by means of a recloser. The largest expected interruption cost associated with element j is equal to $53333.4375 per year, and the element j is the same as was previously mentioned. According to Table 14, the number of nodes with an associated load is equal to 3, the number of analyzed failure records is equal to 16, the number of failure records for the circuit under analysis is equal to 14, and the number of valid failure records for the UNIVERSE ZONE circuit is equal to 10.
From a practical point of view, Table 15 indicates the reconfiguration influence of the distribution circuit. In this case, nodes 1000003 and 1000004 are not listed inside the UNIVERSE ZONE circuit, as can be seen in Table 5.
5. Conclusions
For the First case study, the SAIFI index is equal to 16.0 customer failures / (customer year). Ideally, the SAIFI index should be equal to zero; however, this is, practically, impossible because in a real distribution system there are a lot of contingencies during the course of a year. Thus, it is necessary to compare the SAIFI index for the same distribution circuit for different years. In this manner, is possible to measure the electrical service quality for a certain distribution circuit. This method is valid for the rest of the known reliability indexes, with the exception of the ASAI (Average Service Availability Index). Ideally, this index should be equal to 1 (100%). For the First case study, the ASAI index is equal to 0.9987, which is a good value. The CAIDI index measures the speed that the electrical service is repaired. For the First case study, the CAIDI index is equal to 0.73 customer hours / (customer failure). This value should be smaller.
For the Second case study, according to Table 10, the largest sum of failure rate associated with element j is equal to 1.5 failures / year, which corresponds to: λA (active failure rate) and λPT (passive failure rate for primary electrical equipment composed of a transformer, fuses and a surge arrester). Based on this, the electric utility must work on frequency reduction for these types of failures. The largest sum of outage duration associated with element j is equal to 4.5 hours / year, which corresponds to: UPL (passive outage duration on the primary line, the failures of which cannot be cleared by means of a recloser). As such, the electric utility must work on increasing the reparation speed for this type of failures.
According to Table 11, the electric utility must work on reducing the frequency of cause ID 1500 (SUBSTATION EQUIPMENT FAILURE). In the same way, the electric utility must work on increasing the reparation speed for cause ID 500 (LIGHTNING - METEOROLOGY). According to Table 12, the electric utility must work on improving the quality of service for the LINCOLN SQUARE neighborhood. According to Table 13, the electric utility must work on increasing the reparation speed for faults associated with passive failures on the primary line, the faults of which cannot be cleared using a recloser.
For the EMCALI EICE ESP company, and for all Colombian electric utilities, is impossible calculate the CCDF for element j according to eq. (5). As such, it was impossible calculate the ECOSTi index. By using the new methodology presented in this document it is now possible to calculate the ECOSTi index as it is possible to calculate the Composite Customer Damage Function at load point i, CCDFi, according to eq. (7)-(8). The INVALID-FAILURES worksheet is fundamental to be able to find out the number of invalid failure records that belong to the circuit under study but present primary nodes that do not appear on the FINANCIAL-INFORMATION worksheet or the NODE-INFORMATION worksheet. Invalid failure records are very common in the Colombian electricity market due to the reconfiguration of distribution circuits. The reconfiguration of distribution circuits is widely used in the EMCALI EICE ESP company's Strategic Energy Business Unit. Thus, the new methodology presented in this document is extremely useful for this enterprise as well as for any Colombian electric utility.
References
Referencias
Chowdhury, A.A. and Koval, D.O., Value-based distribution system reliability planning. IEEE Transactions on Industry Applications, 34, pp. 23-29, 1998. DOI: 10.1109/TIA.2004.834075
Chowdhury, A.A., Distribution system risk assessment based on historical reliability performance. Electro Information Technology, 2005 IEEE International Conference on, pp. 1-7, 2005. DOI: 10.1109/EIT.2005.1626967
Mercados Energéticos Consultores., Prestación de servicios para determinar los niveles de calidad exigibles en las redes del SIN, Colombia, CREG, 2014, 236 P.
Zhu, T.X., A new methodology of analytical formula deduction and sensitivity analysis of EENS in bulk power system reliability assessment. IEEE Power Systems Conference and Exposition, pp. 825-831, 2006. DOI: 10.1109/PSCE.2006.296422
Liu, N., Zhang, L. and Han, X., Unit commitment considering expected customer interruption cost. Probabilistic Methods Applied to Power Systems (PMAPS), 2010 IEEE 11th International Conference on, pp. 120-125, 2010. DOI: 10.1109/PMAPS.2010.5528985
Lim, J., Choi, J. and Cha, J., Web based online real-time outage cost assessment information system of power system-II. Innovative Smart Grid Technologies (ISGT), 2013 IEEE PES, pp. 1-6, 2013. DOI: 10.1109/ISGT.2013.6497870
IEEE. IEEE Guide for electric power distribution reliability indices, IEEE Std 1366-2012. New York: IEEE Standards Association, 2012. DOI: 10.1109/IEEESTD.2012.6209381
Operation Technology INC. Distribution system reliability analysis [online], [consulted, 10 of november of 2015]. Avalaible at: https://www.youtube.com/watch?v=S70BIoEXLlk&feature=youtu.be
Comisión de Regulación de Energía y Gas. Resolución 119 de 2008. Bogotá: CREG, 2008.
Zapata, C.J., Granada M. y Reyes, G.A., Reposición de activos de sistemas de distribución de energía eléctrica basada en el aspecto de confiabilidad. Mundo Eléctrico, 90, pp. 56-65, 2013.
Comisión de Regulación de Energía y Gas. Resolución 179 de 2014. Bogotá: CREG, 2014.
Comisión de Regulación de Energía y Gas. Información y formatos para la presentación del plan de inversions, Resolución CREG 179 de 2014. Bogotá: CREG, 2015.
Cómo citar
IEEE
ACM
ACS
APA
ABNT
Chicago
Harvard
MLA
Turabian
Vancouver
Descargar cita
Licencia
Derechos de autor 2017 DYNA

Esta obra está bajo una licencia internacional Creative Commons Atribución-NoComercial-SinDerivadas 4.0.
El autor o autores de un artículo aceptado para publicación en cualquiera de las revistas editadas por la facultad de Minas cederán la totalidad de los derechos patrimoniales a la Universidad Nacional de Colombia de manera gratuita, dentro de los cuáles se incluyen: el derecho a editar, publicar, reproducir y distribuir tanto en medios impresos como digitales, además de incluir en artículo en índices internacionales y/o bases de datos, de igual manera, se faculta a la editorial para utilizar las imágenes, tablas y/o cualquier material gráfico presentado en el artículo para el diseño de carátulas o posters de la misma revista.


