


Publicado
High power printed circuit board design for automotive fuse block usage
Diseño de tablillas eléctricas de alta potencia para uso en cajas de fusibles automotrices
DOI:
https://doi.org/10.15446/dyna.v84n203.56448Palabras clave:
Temperature rise, trace width size, automotive fuse block, current carrying capacity (en)Incremento de temperatura, tamaño del conductor, cajas de fusibles automotrices, capacidad de manejo de corriente (es)
Descargas
Recibido: 25 de marzo de 2016; Revisión recibida: 8 de septiembre de 2017; Aceptado: 22 de septiembre de 2017
Abstract
The minimal size for the conductor calculation is always the first point of interest when an electrical designer is creating a High Power Printed Circuit Board for automotive applications; in this paper you will see the factors considered to calculate the conductor size, the math information, the background information for the factors selection and the conservative rules implemented to protect the circuits for an overload; in addition this document shows two different methods to define the conductor size for the Printed Circuit Board, one based in international standards (Actual Design) and the other based in design assumptions defined to reduce the conservative rules used to calculate the conductor size (Proposal Design). In addition, you can see the validation data and the statistical results to support the implementation for the proposal method in the fuse block design used in the automotive industry, due the Proposal Design provides High Power Printed Circuit Boards with 33% less copper compared to the Actual Design.
Keywords:
Temperature rise, trace width size, automotive fuse block and current carrying capacity..Resumen
El cálculo del tamaño mínimo de un conductor eléctrico es siempre el primer punto de interés al momento de diseñar una tablilla eléctrica de alta potencia; en este artículo se presentan los factores considerados para calcular el tamaño del conductor, las fórmulas matemáticas utilizadas, la revisión del estado del arte y las reglas de conservación definidas para proteger los circuitos de una sobrecarga eléctrica; asimismo se presentan dos métodos para definir el tamaño del conductor, uno basado en estándares internacionales (método actual) y otro basado en supuestos de diseño que reducen las reglas de conservación para calcular el tamaño del conductor (método propuesto), además se presentan los resultados de las pruebas de validación y los análisis estadísticos que respaldan la implementación del método propuesto en el diseño de las tablillas eléctricas de alta potencia utilizadas en centrales eléctricas destinadas a la industria automotriz y que ofrece una reducción del 33% del contenido de cobre de las tablillas eléctricas de alta potencia en comparación con el método de diseño actual.
Palabras clave:
Incremento de temperatura, tamaño del conductor, cajas de fusibles automotrices y capacidad de manejo de corriente..1. Introduction
One of the key aspects of High Power Printed Circuit Board development is determining the appropriate trace sizes for the current flow defined by the circuit requirements. It is necessary to consider the material used to develop the High Power Printed Circuit Boards (copper typically). The conductive material presents a certain amount of impedance to current flowing through it; with electrical energy lost in the form of heat. Usually, in order to determine a good approximation, for current carrying capacity an allowable temperature rise is pre-selected by the electrical layout designer, and the factors considered for calculations are: the width of the trace, the thickness of the trace and the resistivity of the conductor material.
The resistivity of copper is defined using standard values from the IPC-4101[1]. The width and thickness of a conductor is determined primarily on the basis of the current carrying capacity required and the maximum permissible conductor temperature rise pre-defined by the type of the automotive fuse block (the High Power Printed Circuit Board is placed inside) and the physical space allowed for the conductor path. The conductor's permissible temperature rise is defined as the difference between the maximum safe operating temperature of the laminate material and maximum temperature of the thermal environment to which the board is subjected.
This document includes a comparative analysis for two different methods to calculate the trace width size (one based on the IPC-D-275[2] and other based on the IPC-2221[3]/IPC-2152[4]) besides the design assumptions and the supportive data that shows the calculation methods do not impact the current carry capacity requirements and only incorporates the respective knowledge, the lessons learned and the international standards at the time that the specifications were released.
2. Printed circuit boards industry standards
[5] Stated could find several standards related to Printed Circuit Board design; these standards are created by the Institute of Printed Circuits (IPC - Association Connecting Electronics Industries), the Electronic Industries Alliance (EIA), the Joint Electron Device Engineering Council (JEDEC), the International Engineering Consortium (IEC), the US Department of Defense, the American National Standard Institute (ANSI) and the Institute of Electrical and Electronics Engineers (IEEE).
In automotive industries’ case and this research, the design rules are based upon the IPC Standards. The IPC is a global trade association consisting of more than 2,300 member companies. The IPC is made up of contributors from the industry and includes designers, printed circuit board manufacturers, electronics assembly companies, suppliers and original equipment manufacturers. Contributing members bring lessons learned and known good practices to the table, for discussion and debate. The IPC documents and disseminates this knowledge through its industry-accepted standards [5].
The next sections show the methodology used to calculate the trace width size for the Printed Circuit Boards, the mathematical equations, the cross-sectional fitting curve for different IPCs standards and the design assumptions used in Proposal Design to implement the international standards. For the specific case of the High Power Printed Circuit Boards, these assumptions take into consideration the years of experience of a TIER 1 company. The reason for the assumptions is due to the High Power Printed Circuit Boards designed are out of the scope of test data provided by some international standards.
3. IPC-D-275 trace size
A common model in thermodynamics was used by [6-9], and [10] to estimate the current capacity for traces in general conditions. We can start with the idea that the temperature change of the trace is proportional to I 2 R or ∆𝑇≈ 𝐼 2 𝑅, since 𝑅 is inversely proportional to the cross-sectional area, 𝐴, we can rewrite the equation as ∆𝑇≈ 𝐼 2 /𝐴; rearranging terms leads to 𝐼≈ (∆𝑇)(𝐴) or 𝐼≈ (∆𝑇) 1/2 (𝐴) 1/2 ; and finally we can obtain the more general equation for current carrying capacity:

Where, I indicate the current in amperages, ∆𝑇 the change in temperature above ambient in OC and 𝐴 the cross-sectional area in mils2. To estimate the coefficients 𝐾, 𝛽1 and 𝛽2 is convenient to convert them to linear form using logarithms, as follows:

[6] Analyzed the Equation 2 using the cross-sectional area from IPC-D-275[2] for four different traces thickness and 300 data random points. The Equation 3 displays the resulting regression model with 𝐾, 𝛽1 and 𝛽2 parameters (99.3455% r-square value).

Which leads to the estimate of 𝐼=(𝐾)( ∆𝑇 𝛽1 )( 𝐴 𝛽2 ) as:

However, there are several shortcomings to these constant values and the original data. One in particular is the lack of information contained within the cross-sectional charts reflecting the form factor of the traces under study. The main limitations are:
-
The data does not provide a way of independently obtaining the width and thickness components of the cross-sectional data except by estimating them.
-
35A maximum current value studied for outer layers.
-
17.5A maximum current value for inner layers.
-
Only four different conductor trace thicknesses (1/2, 1, 2 & 3 ounces by square feet) are considered.
-
100OC maximum ∆𝑇 for outer layers.
-
45OC maximum ∆𝑇 for inner layers.
4. IPC-2221/IPC-2152 trace size
The IPC-2221[3]/2152[4] equation parameters are different from those in IPC-D-275[2] in that they are more conservative and are implicitly derated to compensate for manufacturing effects. The values calculated with this new model are less conservative and represent better approximation of the test data used to create the cross-sectional charts placed into the IPC-2221[3]/IPC-2152[4]. The new model replaces the model in the IPC-D-275[2]. The constant values 𝐾, 𝛽1 and 𝛽2 have been updated in order to provide a better fitting curve:

Where, 𝐼 indicates the current in amperages, ∆𝑇 the change in temperature above ambient in OC and 𝐴 the area in mils2. Other authors and companies use different constants values for the fitting curve approximation.
5. Theoretical temperature rise
Determine the theoretical temperature rise (∆𝑇) is key to the design of High Power Printed Circuit Boards, because is directly related with the size of the electrical conductor; the automotive industry usually considers for the fuse blocks design a ∆𝑇= 20 𝑂 𝐶 for underhood location or close to heat sources and ∆𝑇= 30 𝑂 𝐶 for interior or rear locations. The formula used to calculate the temperature rise is:

Where, ∆𝑇 represent the temperature rise above the ambient, 𝑇 𝑇𝑟𝑎𝑛𝑠𝑖𝑡𝑖𝑜𝑛 the transition glass fibber temperature of the High Power Printed Circuit Board, 𝑇 𝐴𝑚𝑏𝑖𝑒𝑛𝑡 the ambient temperature for fuse block location and 𝑇 𝑆𝑎𝑓𝑒𝑡𝑦 the safety temperature established as a protective factor against variations between the calculated value and the reality, to reduce the risk of overheating. Fig. 1 displays the Equation 6 temperatures by fuse block location (the High Power Printed Circuit Board is placed inside).

Figure 1: Relation between temperature and automotive fuse block location.
6. Assumptions for automotive fuse block applied to proposal design
As mentioned before, the IPC Standard includes a chart with the relationship of the current carrying capacity, at various temperature rises, with respect to the cross-sectional areas, for inner and outer layers. Using these charts; a designer would be able to calculate the conductor thickness and width necessary to support a given current value and a predicted temperature rise of that system. For inner and outer traces, the former IPC-2221[3], IPC-D-275[2] and MIL-STD-275[17] are all copies of the conclusions of a National Bureau of Standards study, and are based on inadequate historic information and are empirical rather than supported by test data [11].
The IPC-2152[4] includes more factors to calculate the current carrying capacity. These factors make the width calculation based on this IPC Standard more conservative than the previous standard, but the results are restricted for currents up to 35A and for conductor traces up to 3 ounces. In addition, taking into consideration the comments from Mike Jouppi (Chairman of the Task Group in charge to develop the IPC-2152[4]) there is more to sizing conductors that just current, cross-sectional area and temperature rise. Although the current, cross-sectional area and temperature rise remain the main drivers, some of these influencing factors are the substrate thickness, the substrate material, the presence of copper planes, the environment (vacuum, air and forced convection), the power dissipation and the mounting configuration and orientation. The assumptions for the automotive fuse blocks applied to Proposal Design are:
-
The High Power Printed Circuit Boards use values out of the scope of studies placed in the IPCs. This requires the use of the extrapolation from the IPC-2152[4] chart and the use of the current, cross-sectional area and temperature rise to calculate the trace width.
-
The trace width must be calculated based on 135% of the fuse rating value, which protects the circuit application.
-
The maximum steady state current expected on each circuit will be 70% of the fuse rate value.
-
The ∆𝑇 used for underhood compartment is 20OC in which its ambient temperature does not exceed 125oC. For different 𝑇 𝐴𝑚𝑏??𝑒𝑛𝑡 the ∆𝑇 can be calculated following the Equation 6.
-
The ∆𝑇 used for internal compartment is 30OC in which its ambient temperature does not exceed 95OC. For different 𝑇 𝐴𝑚𝑏𝑖𝑒𝑛𝑡 the ∆𝑇 can be calculated following the Equation 6.
-
No constant values difference (𝐾, 𝛽1 and 𝛽2) for the width estimation of traces in the outer layers and inner layers even though the IPCs have different information for both conditions. Nevertheless, it appears that in reality the IPC inner layer data was simply derated 50% (on average) from the IPC outer layer data.
The Fig. 2 displays a graphical comparison between the methods used in this study, to calculate the trace widths versus the IPC Standard, considering ∆𝑇= 20 o C and one-ounce copper layer.
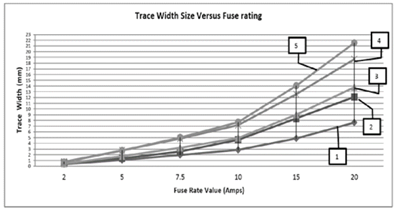
Figure 2: Trace width size versus fuse rating.
Description:
-
Representation of the width conductor size calculated for 70% of the fuse rate value which is the maximum current expected under normal conditions.
-
Representation of the width conductor size calculated for 100% of the fuse rate based on IPC-2221[3]/IPC-2152[4] charts.
-
Representation of the width conductor size calculated for 100% of the fuse rate based on IPC-D-275[2].
-
Representation of the width conductor size according to the Proposal Design, based on IPC-2221[3]/IPC-2152[4], which considers 135% of the fuse rate value.
-
Representation of the width conductor size according to the Current Design, based on IPC-D-275[2], which also considers 135% of the fuse rate value.
In conclusion, when the trace is powered, current flowing through it will generate heat creating a temperature difference between the trace and the surrounding environment (∆𝑇) and it is dependent upon the trace cross-sectional area and various factors such as thickness, dielectric material, adjacency of copper in the board and the environment condition.
However, for the above estimations not all these factors were considered, because some of them are still under investigation and the test results have proved that the safety margin ( 𝑇 𝑆𝑎𝑓𝑒𝑡𝑦 from Eq. 6) is wide enough to avoid any damage in the High Power Printed Circuit Board under normal conditions.
7. Trace width size comparison
To test the design methods, two different constants values (𝐾, 𝛽1 and 𝛽2) were used to solve the Equation 1 and determine the trace width size; the Actual Design based on the IPC-D-275[2] (Fig. 2, line 5) and the Proposal Design based on the IPC-2221[3]/IPC-2152[4] (Fig. 2, line 4). To demonstrate that the change of the constants values does not impact the validation test results for the final product, test boards were designed with equal inputs and outputs according to schematics and prototype parts were ordered to run validation test; the test performed was the Power Dissipation and Thermal Mapping. Table 1 compares the prototype parts characteristics.
Source: The author.Table 1: Actual and Proposal Design Characteristics.

A cross-sectional analysis with dimensions is shown in the Fig. 3. It verifies that the supplier has provided parts with the minimum copper thickness in accordance with table 3.11 and table 3.12 in IPC-6012[12] for the Actual Design and the Proposal Design.

Figure 3: Cross-sectional view with dimensions for Actual Design and Proposal Design.
The specification E5-5L1T-14A067-AA[13] establishes that the Power Dissipation Test, provides information about the electrical center’s ability to dissipate and manage heat (the High Power Printed Circuit Board is placed inside the fuse block) and Thermal Mapping Test provides information as to where the most critical thermal areas of the electrical center may be, and provides information about where to place thermocouples for the test that require thermal data. For both tests the temperature shall not increase above the ambient temperature by more than 55OC.
Thermal mapping test procedure:
-
Attach each conductive layer to terminal, fuse, relay,..., remove or cut housings (if applicable) to provide images of the conductor or circuit board.
-
Apply maximum steady state load current to each input-output circuit simultaneously at vehicle voltage for one hour or until temperature stabilizes.
-
Measure and record the ∆𝑇 using a thermal image. Images are to be recorded perpendicular to all heat sources wherever possible (include thermocouples if necessary).
-
Alternate ways to perform this test for multilayer fuse block, include thermocouples if necessary.
-
Power dissipation test procedure:
-
Before and after the test, measure and record the voltage drop from input to output of the circuits identified in the vehicle test load matrix.
-
Secure the fuse block in vehicle position (use the vehicle bracket).
-
Ensure that the fuse block and connectors interfaces are properly assembled (each component in the right position).
-
Place thermocouples at the critical areas.
-
Conduct test at 125OC±3OC.
-
Apply maximum load current and vehicle intermittent load as identified. Perform the test for a minimum of 48 hours or the number of cycles it takes for the temperature measurements to stabilize.
-
Measure and record ∆𝑇.
-
Inspect the fuse block for external damages and internal damages (tear down analysis).
-
For the case of the fuse block under study the maximum ambient temperature is 125OC. Table 2 shows voltage drop values for two samples before and after the Power Dissipation Test. Similar measurements are shown for both designs: actual and proposed. The electrical and electronic SMD components placed inside the fuse block meets the AEC-Q100 [16] standard.
Source: The author.Table 2: Voltage drop values before/after Power Dissipation Test.
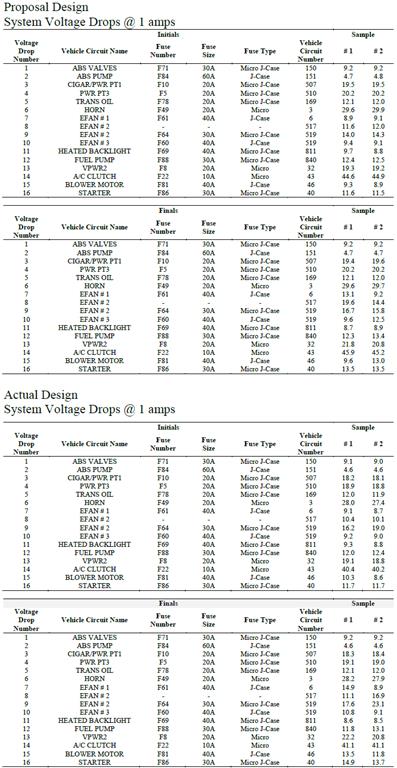
Fig. 4 includes the ∆𝑇 obtained after the Power Dissipation Test for Actual Design and Proposal Design. The highest temperature captured by measurement instrument is 161.2OC at the Actual Design component K33 (average 158.7OC). And this component also has the highest temperature for the Proposal Design at 160.9OC maximum temperature recorded (average 158.4OC). With these results, we can assume no differences at automotive fuse block level between the different designs, however in order to provide more visual evidence, Fig. 4 also displays a Thermal Mapping Images for both designs.

Figure 4: Power dissipation test and thermal mapping.
To evaluate if the two designs have the same responses (temperature) after the Power Dissipation Test a hypothesis test was evaluated for each component connected to a thermocouple. The test selected was the 2-Sample t, but before applying this statistical tool it was necessary to apply the Johnson transformation to transform the non-normal data (obtained with the thermocouples) to normal data. Fig. 5 presents one of the Johnson transformations obtained using the software Minitab, with 14 thermocouples readings for the sample size.

Figure 5: Johnson transformation from software Minitab.
Once the Johnson transformation was applied, it was necessary to evaluate the variances for each component data for the current design and the proposal design. The hypothesis test selected was the 2-Variances at 95% confidence value (alpha equal to 0.05):

Fig. 6 displays one of the 2-Variances hypothesis test for component F71, Observing the interval plot can be assuming that the standard deviation in both designs are the same. In addition, the statistical data provided by the F test (at 95% confidence level) is equal to 0.929 (P-value) that’s means that H0 cannot be rejected. So, using simple words “the variance, of the temperature collected by the thermocouples, between both designs have not shown to be different in the component F71”.
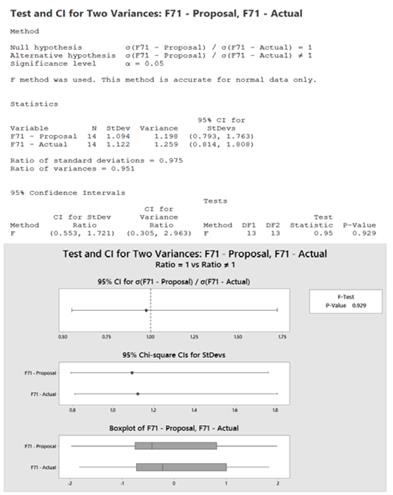
Figure 6: 2-Variances hypothesis test from software Minitab.
The 2-Sample t was performed for each component connected to a thermocouple, at 95% confidence level, with the below hypothesis:

Fig. 7 includes a boxplot chart with a mean connected line. With visual analysis, we cannot conclude that a difference of the means values exists between the two set of analyzed data. This is confirmed with the P-value equal to 0.529 observed in the statistical results.

Figure 7: 2-Sample t hypothesis test from software Minitab.
8. Conclusions
In this study, two High Power Printed Circuit Boards design alternatives were evaluated (called Actual Design and Proposal Design). To support the implementation of the design change, a Power Dissipation Test and Thermal Analysis using prototype fuse block parts were evaluated, in a test laboratory with ISO/IEC 17025:2005 (general requirements for the competence of testing and calibration laboratories) certification granted by American Association for Laboratory Accreditation, obtaining similar statistical results between the designs, which means that regardless of the design used the copper conductors can handle similar current values under a specific theoretical temperature rise.
The actual values used to calculate the conductor size of the High Power Printed Circuit Board are out of the scope of the state of the art and the international standards; this means that the companies dedicated to produce this king of product only use estimated values.
The conductor size thickness typically used in this product is 2, 3 or 4 ounces with fuse values around 5A, 7.5A, 10A, 15A, 20A, 15A, 20A, 25A, 30A, 40A, 50A, 60A and up to 350A (no differences between inner and outer layers). The industry standards are limited to 3 ounces, 35A for outer layers and 17.A for inner layers.
The statistical results allow the change of the design rules, this has an economic impact reducing the copper content of the High Power Printed Circuit Boards, due accord the automotive fuse blocks studied, the Proposal Design contains 33% less copper content versus the Actual Design.
This research is actually implemented in the automotive industry with extensive validation results for different automotive OEMs (Original Equipment Manufacturer) fuse block specifications. Including the Ford Motor Company specification ES-5L1T-14A067-AA[13], Toyota TSC 1900G[14] and General Motors GMW 3172[15].
References
Referencias
IPC, IPC-4101 Specification for base materials for rigid and multilayer printed boards, Bannockburn, Illinois: www.ipc.org, 2009.
IPC, IPC-D-275 Design standard for rigid printed board and rigid printed board assemblies, Bannockburn, Illinois: www.ipc.org, 1991.
IPC, IPC-2221 Generic standard on printed board design, Bannockburn, Illinois: www.ipc.org, 2012.
IPC, IPC-2152 Standard for determining current carrying capacity in printed board design, Bannockburn, Illinois: www.ipc.org, 2009.
Mitzner, K., Complete PCB design using OrCAD capture and PCB editors, Newnes Editors. ISBN 978-0-7506-8971-7, 2009.
Brooks, D., Temperature rise in PCB traces. Proceedings of the PCB Design Conference, West, March 23-27, 1998.
Brooks, D., Trace currents and temperature, Part 1: The basic model. The PCB Design Magazine, 1(1), pp. 56-61, 2012.
Brooks, D., Trace currents and temperature, Part 2: Empirical results. The PCB Design Magazine, 1(2), pp. 20-25, 2012.
Brooks, D., Trace currents and temperature, Part 3: Fusing currents. The PCB Design Magazine, 2(1), pp. 50-54, 2013.
Brooks, D., Trace currents and temperature, Part 4: Via heating. The PCB Design Magazine, 2(2), pp. 30-32, 2013.
Bolton Institute, The University of Bolton. 2003. [online]. Available at: http://www.ami.ac.uk/courses/ami4817_dti/u02/pdf/meah0221.pdf. [acceced: 25 September 2014].
IPC, IPC-6012 Qualification and performance specification for rigid printed boards, Bannockburn, Illinois: www.ipc.org, 2010.
Ford Motor Company, ES-5L1T-14A067-AA Engineering specification – Panel assembly fuse junction.
Toyota, TSC 1900G Test methods for junction blocks and relay for automobiles.
General Motors, GMW 3172 General specification for Electrical/Electronic components – Environmental/Durability.
Automotive Electronic Council, AEC-Q100 Failure Mechanism based stress test qualification for packaged integrated circuits., [online]. Available at: http://www.aecouncil.com, 2007.
Military Standard, MIL-STD 275 Printed wiring for electronic equipment, Department of Defense, Washington, D.C., 1984.
Cómo citar
IEEE
ACM
ACS
APA
ABNT
Chicago
Harvard
MLA
Turabian
Vancouver
Descargar cita
CrossRef Cited-by
1. Hanting Zhang, Xuefeng Shao. (2022). CAD-Assisted 3D Assembly of Automobile Electrical Switch considering PSO-BP Neural Network Algorithm. Journal of Electrical and Computer Engineering, 2022, p.1. https://doi.org/10.1155/2022/6454942.
2. Guang Bai, Wei Liu. (2022). Optimal Design of Vehicle Structure Based on Computer-Aided Technology. Journal of Electrical and Computer Engineering, 2022, p.1. https://doi.org/10.1155/2022/3326126.
Dimensions
PlumX
Visitas a la página del resumen del artículo
Descargas
Licencia
Derechos de autor 2017 DYNA

Esta obra está bajo una licencia internacional Creative Commons Atribución-NoComercial-SinDerivadas 4.0.
El autor o autores de un artículo aceptado para publicación en cualquiera de las revistas editadas por la facultad de Minas cederán la totalidad de los derechos patrimoniales a la Universidad Nacional de Colombia de manera gratuita, dentro de los cuáles se incluyen: el derecho a editar, publicar, reproducir y distribuir tanto en medios impresos como digitales, además de incluir en artículo en índices internacionales y/o bases de datos, de igual manera, se faculta a la editorial para utilizar las imágenes, tablas y/o cualquier material gráfico presentado en el artículo para el diseño de carátulas o posters de la misma revista.


