


Publicado
Monitoring and control of the multihead weighing process through a modified control chart
Monitoreo y control del proceso de pesaje multicabezal a través de un gráfico de control modificado
DOI:
https://doi.org/10.15446/dyna.v84n200.58518Palabras clave:
quality control, modified control chart, reduction of variability, combinatorial optimization, packaging process, multihead weighers (en)control de calidad, gráfico de control modificado, reducción de la variabilidad, optimización combinatoria, proceso de envasado, pesadores multicabezal (es)
Descargas
Recibido: 21 de junio de 2016; Revisión recibida: 13 de noviembre de 2016; Aceptado: 15 de diciembre de 2016
Abstract
Modified control charts are used to monitor and control manufacturing processes which are considered to be six-sigma processes. The use of these charts is based on the idea that the cost of identifying and correcting special causes is much higher than the cost of off-target products. Therefore, the process mean is essentially acceptable as long as it is anywhere within the specification limits. These concepts are applied to the packaging process in multihead weighers. The weight of the packed product, seen as the quality characteristic to be monitored, must be as close to a specified target weight as possible and comply with applicable regulations. The packaging process was previously optimized and improved using a packaging strategy, which was evaluated through a proposed packing algorithm. In this way, a set of numerical experiments were conducted to examine the solutions generated, which were subsequently monitored.
Keywords:
quality control, modified control chart, reduction of variability, combinatorial optimization, packaging process, multihead weighers.Resumen
Los gráficos de control modificados se utilizan para el seguimiento y control de procesos de fabricación que son considerados como procesos seis-sigma. El uso de estos gráficos se basa en la idea de que el costo de identificar y corregir causas especiales de variación es mucho más alto que el costo de productos alejados de su valor nominal. Por lo tanto, la media del proceso es esencialmente aceptable siempre que esté dentro de los límites de especificación. Estos conceptos han sido aplicados al proceso de envasado en pesadoras multicabezal. El peso del producto envasado, visto como la característica de calidad a ser monitoreada, debe ser lo más cercano posible a un peso objetivo y cumplir con la normativa. El proceso ha sido previamente optimizado y mejorado mediante una estrategia de envasado, la cual es evaluada a través de un algoritmo de envasado. De esta manera, un conjunto de experimentos numéricos fueron realizados para examinar las soluciones generadas, las cuales son posteriormente monitoreadas.
Palabras clave :
control de calidad, gráfico de control modificado, reducción de la variabilidad, optimización combinatoria, proceso de envasado, pesadores multicabezal.1. Introduction
Standard control charts use three-sigma control limits to monitor the quality characteristics of a process. These charts are designed to distinguish between common and special causes of variation [1]. However, when the process capability (Cp) is equal to or greater than 2 and the cost of identifying and correcting special causes is very large three-sigma control limits are not recommended. In these cases, the use of modified control charts is a good option for monitoring a process. The modified control limits of a modified control chart allow the process mean to vary over an interval, as far as 1.5 times its standard deviation (σp) from the desired target while ensuring that no out-of-specification product is produced [2,3].
The interval at which the process mean can vary is usually represented by µL and µU, which are the smallest and largest permissible values of the mean, respectively. This ensures that the nonconforming fraction will be less than a threshold known as δ. Therefore, to establish this interval, the δ value must be established in advance, normally the lowest possible value.
To specify the modified control limits of a modified x chart, it will be assumed that the process output is normally distributed (as we will see in section 2). The modified limits are established taking the µL and µU values as input. Furthermore, due to their conceptual basis, these limits are wider than the usual three-sigma limits. For the calculation of µL and µU both the specification limits and the standard deviation of the process are considered. As shown below:
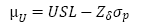
 (1)
(1)
 (2)
(2)
Where LSL and USL are the lower and upper specification limits and Zδ is the upper percentage point of the standard normal distribution [3, 4]. In this way, the lower and upper control limits can be calculated using the following equations:
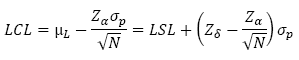 (3)
(3)
 (4)
(4)
Notice that the modified control limits are designed to monitor whether the process mean is between µL and µU.
In this paper, we have designed a modified  chart for the multihead weighing process. This process is a packaging process in which high technology machines, known as multihead weighers, are used. Prior to the application of the modified control limits, the packing process was optimised and improved through a packaging strategy which aims to reduce the variability in the weight of the packed product and at the same time, increase process capability (see later sections 3 and 4).
The present document is structured in the following way: In section 2 the multihead weighing process is introduced. In Section 3 the proposed optimization approach is presented. Section 4 shows the results and analysis of the numerical experiments. Section 5 offers the conclusions of this work.
2. Multihead weighing process
To illustrate the packing process, in this section we will present the components of multihead weigher, a brief explanation of the multihead packing process and a summary of the scientific references that were found in this field.
2.1. The multihead weigher
Multihead weighers or combinational weighers are used to provide accurate weights at high packing speed and are currently the most used dosing method for many kinds of products, also including those with heterogeneous characteristics [5]. Control of the actual content of the packaging is regulated by the European directive 76/211/EC and must be implemented by factories, packaging plants and importers. The regulations state that consumers be informed about the quantity and be protected against short measures, while allowing businesses the flexibility to control quantity on the production line within specific tolerances [6].
Combinational weighers, designed in the mid 1980s, uses combination weighing techniques to achieve dispensed weights that are closer to the desired target weight than conventional weighing techniques. They have a number of weighing heads that statically weigh the product; these weight data are fed to a computer, which calculates all of the possible combinations of product weights in order to dispense the best combination (closest match to target weight) in a packaging machine. Fig. 1 presents the schematic of the basic combinational weigher components. The weighing system consists of three elements, namely:
-
A system to automate product feeding to the weighing stations. This is normally in the form of a belt or vibratory feeder (linear vibrators); the belt is controlled to deposit a fraction of the final target weight into a product storage hopper mounted above the weigh hopper. Depending on the layout of the machine, the feed system is configured in either a radial or line form.
-
A system to collect the product and feed it into a weighing hopper. This hopper is commonly known as a pool hopper (feed hopper). It must be constructed in such a way as to act as a buffer store to contain the product from the feed system while the weigh hopper below is stabilizing. The weighing system must have a static product to ensure accurate weighing results. If the pool hopper were not present it would be necessary to employ more weigh hoppers to achieve the same levels of performance, other methods would also have to be used to ensure the product did not fall into the weigh hopper either during the stabilization time or immediately prior to discharge.
-
The weigh hopper. The construction of the weigh hopper is such that it must contain the product robustly. The weigh hopper is supported by a suitable weight transducer. The weight data is fed to an electronic system to combine the data from the other weigh hoppers on the machine to determine which hoppers should be discharged to the downstream process (weight hoppers combination) [7].
-
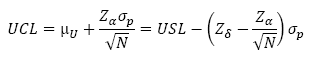
until it obtains the number of packages (Q) needed one by one [9]. The goal is to choose a subset H’ from the set H of the current n weighing hoppers to produce a goods package. Fig. 2 shows an example of the packing process for a target weight T= 100 grams.
-
It should be mentioned that the number of possible different hopper subsets 𝐻′ depends on the number k of hoppers to be combined in each packing operation. This means that the optimization problem that focuses on minimizing the difference between the actual and target package weight is seen as a NP-complete subset-sum combinatorial problem [10] when k is neither previously fixed nor constant [11]. This paper deals with the case in which the number of hoppers k to be combined at each packing operation is constant and fixed in advance.

Figure 1: Arrangement of feeders and hoppers of a radial multihead weigher
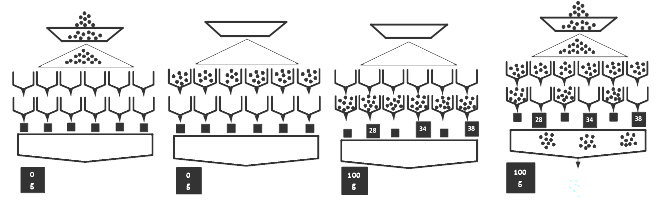
Figure 2: Packing process for a target weight of 100 gr in a multihead weigher
2.2. Packing process
The multihead packing process starts when a quantity of goods is placed into each hopper  , [8] and the weight signal is transmitted to the built-in computer. The computer calculates the combinations of weights that come closest to the desired weight T, and the combination of the closest weights is released from the corresponding hoppers. The resulting empty hoppers are supplied with new quantities of goods. The computer continuously repeats this process
If we assume that the weights  in the hoppers follow a normal probability distribution, that all the hoppers are independently filled according to the same distribution N (µ, σ) and k hoppers are randomly selected in each packing operation, then the weight of packages is known to follow a normal distribution
  where the average package mean weight kµ is expected to equal the target T.
The value of  (the standard deviation if hoppers were selected at random) is considered to be an index of quality in the packaging process. However, the subset of hoppers to be discharged H' is not actually selected at random but in a driven way, usually such that the total weight
  is as close to T as possible. Therefore,
 [12,13].
2.3. Previous related works
A summary of the scientific references that can be found in this field will now be presented. Some authors have studied the possibility of improving multiweighing proceedings in packing process performance. For example [12,13] proposed the use of the percentage variability reduction index for the reduction and control of production process variability. [7] Investigated the optimum scheme for determination of operation time of line feeders in automatic combination weighers. [5] Proposed a weighing algorithm for multihead weighers based on bit operation. In [8] a second objective called “priority” is introduced. They formulated the problem as a bi-criteria optimization problem and proposed an algorithm based on dynamic programming. The proposed approach was aimed at heuristically minimizing the maximum duration of items in the system, while attaining a total weight for each package as close to the target weight as possible. Some authors [11,14-16] have studied the possibility of improving the bi-criteria optimization model proposed by [8]. [6] proposed a set of strategies to study the filling setting of hoppers as a way to reduce variability in the packing process. In [9] the process was evaluated taking into count the "priority" of the hoppers (whose content was real weight) and considering that the relative importance of objectives is dynamically managed and adjusted. Other authors investigate different types of packing operations. Several algorithms were developed for double-layered goods packing systems and duplex packing systems, where in an operation two disjoint subsets are simultaneously selected to produce two packages [14,17].
In this work, we propose implementing a modified control chart to monitor and control the multihead weighing process, which is previously optimized and improved through a packaging strategy based on the contributions of [6].
3. The approach of optimization
The proposed optimization approach includes the packaging strategy, packaging algorithm and the mathematical optimization model. The strategy is based on study the filling setting of weighing hoppers (as proposed by [6]) while the algorithm seeks to evaluates the strategy through a procedure to carry out the packing operation.
3.1. Packaging strategy
As has been mentioned in section 2, in this work it is assumed that the number of hoppers 𝑘 to be combined in each packing operation is constant and fixed in advance. This means that the supply of product to the weighing hoppers must be set at  . However, the packaging strategy proposed considers the general case in which each hopper 𝑖 is expected to be filled with a different average quantity of goods (instead of a common value µ). In this paper we explore the case in which several hoppers weights are set in such a way that they share the same average quantity of goods, as this has been proven to be an efficient strategy to reduce package variability [5,6,13].
In addition, we use the expected coefficient of variation (CV) of the final package (say, if the hoppers were selected at random) for calculation of the standard deviation of weights in every hopper (σ) as an input in the packaging process. e.g., if / gr and k= 2. Theoretically we have  gr and therefore σ = 70.71 gr. However, as explained in subsection 2, this does not mean that
  will be the actual variability obtained in the package produced through our packing strategy.
In our particular case, the packaging strategy proposes dividing the n weighing hoppers into five subgroups (n1, n2, n3, n4 and n5 with  and provides an unequal amount of product to each subgroup, on average (µ1, µ2, µ3 , µ4 and µ5, respectively). During the packing operation the filling setting is establish in the following way: µ1= µ- 1.5 σ, µ2= µ - 1σ, µ3= µ, µ4= µ+ 1σ and µ5 = µ+ 1.5σ.
As an example in the calculation of the µ j values, suppose T= 2000 gr., k= 2, σ= 70.71 gr. In these conditions the µ j values would be: µ1= 1000 - 1.5(70.71) = 893.93 gr., µ2= 1000 - 1(70.71) = 929.29 gr., µ3= 2000/2 = 1000 gr., µ4= 1000 + 1(70.71) = 1070.71 gr. and µ5 = 1000 + 1.5(70.71) = 1106.07 gr. In this way some hoppers would share the same value for µ j depending on which subgroup (n1, n2, n3 , n4 and n5) the hopper belongs to.
3.2. Packing algorithm
The procedure proposed to carry out the packing operation is explained in this section. This enumerative procedure is made for each packed product and can be implemented in software systems installed in control unit of the multihead weigher. The packing algorithm consists in 4 steps, namely:
-
Step 1. Feed the n weighing hoppers according their respective setting (µ1, µ2, µ3 , µ4 and µ5).
-
Step 2. The weights in the hoppers are used to calculate the k weight combinations - say,
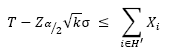
 combinations. The closest one to the target weight (T) is chosen if is within a confidence level (1 - α) of 99.73%, i.e.,
  . Where
  represents the critical value of the standard normal probability distribution N(0,1) for a significance level α. Then, the optimal combination is packed and we go to step 4.
 -
Step 3. If all the total weights (as result of all the combinations Ct of k hoppers) are outside the confidence level all hoppers are discharged. The hoppers are supplied with new weights according their respective setting and we go back to step 2.
-
Step 4. If the required total number of packages (Q) is not completed, then the empty hoppers are supplied with the next new weights according their respective setting and we go back to step 2. Otherwise, the packing process ends.

Figure 3: Flowchart for the packing procedure
Step 3 of the algorithm describes a situation in which all the hoppers should be discharged in order to avoid producing packages that would not meet the quality requirements for the final product in terms of weight. When that happens, all of the discharged product could be taken and reused in the process again, for instance. Besides, we will also calculate the percentage of discharge for the confidence level (DCL), as a way to measure the performance of the proposed strategy. Fig. 3 shows the flowchart for the proposed packing procedure.
The packing algorithm was implemented in Pascal and run on a personal computer with Windows 7 Home Premium (64bit), Intel Core i5-3317U CPU (1.7 GHz) and 4 GB memory. Fig. 4 shows the user interface of this prototype for the case in which the number of hoppers 𝑘 to be combined is equal to 5. The current version of the application lets the user enter the probability distribution setting for each subgroup of hoppers, as well as the number of hoppers in each subgroup. Other parameters such as the target weight T, the total number of hoppers n and the total number of packages to produce Q can also be entered by the user. The software outputs are: the proportion of iterations each hopper has been used, the average weight of the number total of packages produced ( ), the standard deviation of the number total of packages produced (
 ) and percentage of discharge for the confidence level (DCL).
3.3. Optimization model
The optimization model is formulated to minimize the difference between the target weight (T) and the total weight of the final package (W). In this case, the variable to be minimised is presented by D which is the minimum difference, in absolute value, between T and W.
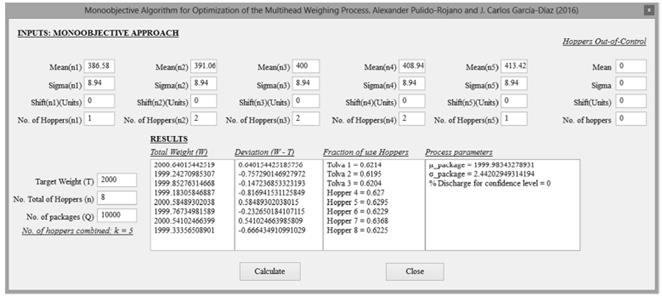
Figure 4: User interface of the prototype software developed
The solution to choose weights in the hoppers can be described in the following way:

Subject to
 (5)
(5)
 (6)
(6)
 (7)
(7)
 (8)
(8)
 (9)
(9)
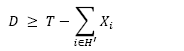
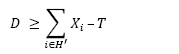
Here, eq. (5) ensures that the value of D is greater than or equal to zero. This represents the minimum absolute value and complies with restrictions Eqs. (6) and (7), i.e., it aims to attain a total weight as close to the target weight T as possible. Moreover, the confidence level constraints are represented by Eq. (8) and Eq. (9). Note that the mathematical model is presented in a generic way and does not depend upon the way in which the 𝑛 hoppers have been subdivided (see subsection 3.1).
4. Results and analysis
The packing strategy has been evaluated through the packing algorithm for 𝑘 values between 2 and 7. The numerical experiments were realized for a target weight T= 2000 gr and a number total of hoppers n= 8, n = 10, and n = 12. The way in which the hoppers are distributed in each subgroups is shown in Table 1.
During the simulation 10000 packages were produced in the packing operations for each k value. The European directive 76/211/EEC states that the maximum permissible error for T= 2000 gr is 30 gr.
Therefore, from the point of view of the products and the consumers, the lower and upper specification limits would be 1970 gr and 2030 gr, respectively.
Source: The authors.Table 1: Distribution of the weighing hoppers in the subgroups

Table 2 presents the results of the average weight of the number total of packages produced ( ), the standard deviation of the total number of packages produced (
 ), the process capability index (Cp) and percentage of discharge for confidence level (DCL) for a CV value of 5%.
Source: The authors.Table 2: Simulation results from the packing algorithm for different values of the number of hoppers to be combined and the number total of hoppers.
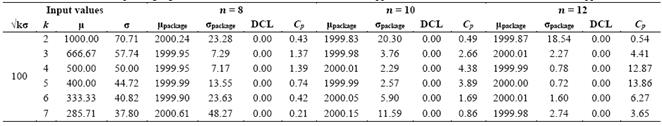
The results show that in using the packaging strategy the mean process is not affected by an increase in the n values. Note that no discharges of product from hoppers were presented; ensuring that at least one of the total weights, as a result of all combinations, was within the confidence level for each packing operation. In addition, it is observed that the variability of the weights obtained fails to improve for extreme values of k but it improves when the n value is incremented. Numerical experiments show that the lowest variability and the highest values of Cp are achieved when k= 4 and n= 8, k= 4 and n= 10 and, k= 5 and n= 12.
Furthermore, it is interesting to see that the lowest values of are achieved when k= 5 and n= 12, even though combinations of five hoppers not result in the highest total number of combinations to choose from. The results confirm that the packing process can be considered as a process with six-sigma capacity if three, four or five hoppers are combined when n= 10 and also when k is greater than 2 when n= 12.
Based on the above analysis, the modified control limits for a value of k= 5 and a n = 12 are calculated. This is the optimum operating condition which permits minimizing the variability in the weight of the package. We used eq. (1)-(4) with Zδ and Zα replaced by 3.72 and 3.0, respectively. In this particular case, the Zδ value corresponds to a nonconforming fraction of at most δ = 0.0001.

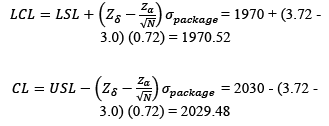
The values of µL and µU have been obtained assuming that the mean may drift as much as 1.5 / from target weight, as already mentioned. Furthermore, it is important to note that σp is replaced by . All these values are presented in Table 3 for a sample size of 𝑁 = 1.
Fig. 5 is the modified control chart for monitoring the total weight (W) for 200, 500, 1000 and 5000 packed products. Graphs show the process behaviour after establishing the modified control limits through the standard deviation () estimated by simulation of our packing algorithm. In this regard, the process does not present an untypical behaviour and therefore the modified control chart is established for monitoring the packing process.
Source: The authors.Table 3: Parameters of the modified control chart for the multihead weighing process

5. Conclusions
We have designed a modified 𝑥 chart to monitor and control the multihead weighing process. The modified control limits have been established to ensure a nonconforming fraction of at most 0.0001. Prior to this, the process was optimised and improved through a packing strategy which sought to reduce the variability in the selection of the total weight of the package with respect to a desired target weight. The strategy was evaluated through a proposed packing algorithm which simulated the packing process for different values of the number of hoppers combined on multihead weighers with eight, ten and twelve weighing hoppers. In this line, exact algorithms were developed to evaluate the many values of the number of combined hoppers.
The results indicate that both the packaging strategy and algorithm can resolve the packing problem in an efficient way, to the point where the process can be considered to be a process with six-sigma capacity.
It was concluded that variability in the packing process does not improve when low or high values of combined hoppers are used, but it does improve when the total number of hoppers is incremented. We recommended, that future research, conducts in-depth studies of the relationship between the number of combined hoppers and the total number of hoppers in the multihead weigher.
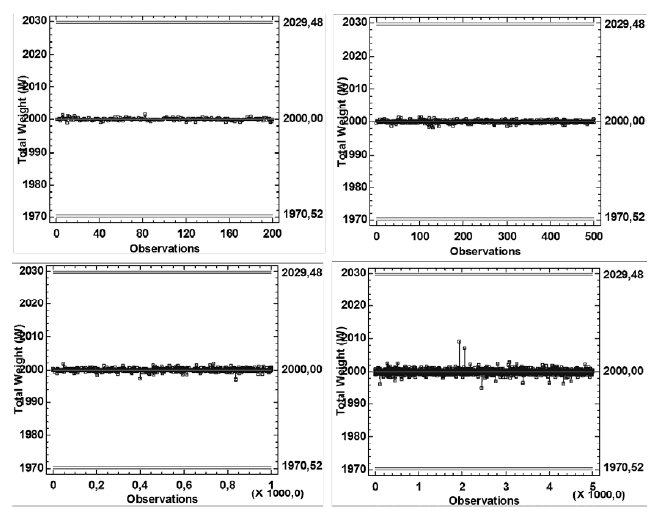
Figure 5: Modified control chart for the multihead weighing process simulating different values for the number of needed packages
References
Referencias
Pulido-Rojano, A., Methodological design for the prevention of risk in production processes, DYNA, 82(193), pp. 16-22, 2015. DOI: 10.15446/dyna.v82n193.42903
Duncan, A.J., Quality control and industrial statistics. Illinois: Irwin, 1986.
Montgomery, D.C., Statistical Quality Control. New York: John Wiley & Sons, 2009.
Grant, E.L. and Leavenworth, R., Statistical Quality Control. New York: McGraw-Hill, 1996.
Keraita, J.N. and Kim, K.H., A weighing algorithm for multihead weighers, International Journal of Precision Engineering and Manufacturing, 8(1), pp. 21-26, 2007.
Pulido-Rojano, A. and García-Díaz, J.C., Optimization of multihead weighing process using the Taguchi loss function, Proceedings of IIE International 8th International Conference on Industrial Engineering and Industrial Management and XX International Conference on Industrial Engineering and Operations Management, 2014. pp. 305-312.
Keraita, J.N. and Kim, K.H., A study on the optimum scheme for determination of operation time of line feeders in automatic combination weighers, Journal of Mechanical Science and Technology, 20(10), pp. 1567-1575, 2006. DOI: 10.1007/BF02916261
Karuno, Y., Nagamochi, H. and Wang, X., Bi-criteria food packing by dynamic programming, Journal of the Operations Research Society of Japan, 50(4), pp. 376-389, 2007.
Pulido-Rojano, A., García-Díaz, J.C., Giner-Bosch, V., A multiobjective approach for optimization of the multihead weighing process. In: Framinan, J.M., Perez, P., Artiba, A., (eds). The road ahead: Understanding challenges and grasping opportunities in industrial and systems engineering, Spain, IEEE, 2015. 67. DOI: 10.1109/IESM.2015.7380192.
Garey, M.R. and Johnson, D.S., Computers and Intractability: A guide to the theory of NP-completeness. New York: WH Freeman and Company, 1979.
Imahori, S., Karuno, Y., Nagamochi, H. and Wang, X., Kansei engineering humans and computers: Efficient dynamic programming algorithms for combinatorial food packing problems, International Journal of Biometrics, 3(3), pp. 228-245, 2011. DOI: 10.1504/IJBM.2011.040817
Salicrú, M., González, C. and Barreiro, J.J., Variability reduction with multiweighing proceedings, Top, 4(2), pp. 319-329, 1996. DOI: 10.1007/BF02568515
Barreiro, J.J., González, C. and Salicrú, M., Optimization of multiweighing packing proceeding, Top, 6(1), pp. 37-44, 1998. DOI: 10.1007/BF02564797
Imahori, S., Karuno, Y., Nishizaki, R. and Yoshimoto, Y., Duplex and quasi-duplex operations in automated food packing systems, Proceedings of IEEE/SICE International Symposium on System Integration (SII), 2012. pp. 810-815. DOI: 10.1109/sii.2012.6427267
Karuno, Y., Takahashi, K. and Yamada, A., Dynamic programming algorithms with data rounding for combinatorial food packing problems, Journal of Advanced Mechanical Design, System, and Manufacturing, 7(2), pp. 233-243, 2013. DOI: 10.1299/jamdsm.7.233
Karuno, Y. and Tateishi, K., Improved heuristics with data rounding for combinatorial food packing problems, Proceedings of IEEE 2014 7th international conference on service-oriented computing and applications, 2014, pp. 81-88. DOI: 10.1109/soca.2014.15
Karuno, Y., Nagamochi, H. and Wang, X., Optimization problems and algorithms in double-layered food packing systems, Journal of Advanced Mechanical Design, System and Manufacturing, 4(3), pp. 605-615, 2010. DOI: 10.1299/jamdsm.4.605
Cómo citar
IEEE
ACM
ACS
APA
ABNT
Chicago
Harvard
MLA
Turabian
Vancouver
Descargar cita
CrossRef Cited-by
1. Harold Manuel Madrid‐Alvarez, Juan Carlos García‐Díaz, Víctor G. Tercero‐Gómez. (2024). A CUSUM control chart for gamma distribution with guaranteed performance. Quality and Reliability Engineering International, 40(3), p.1279. https://doi.org/10.1002/qre.3464.
2. Alexander D. Pulido-Rojano, Rafael García-Jiménez, Harold Madrid-Álvarez, J. Carlos García-Díaz, Leonardo Yañez-Valenzuela. (2026). Optimization algorithm for indivisible products to improve the packaging process in multi-head batch weighers. Journal of Industrial and Production Engineering, 43(4), p.615. https://doi.org/10.1080/21681015.2025.2600339.
3. Julia Isabel Hartmann, Michael Olbrich, Marcus Hamann, Christoph Ament. (2023). Simulation of Particle Motion on Rotating Cone Feeder for a Multihead Weigher Based on Dynamic Friction Modeling. 2023 IEEE/ASME International Conference on Advanced Intelligent Mechatronics (AIM). , p.138. https://doi.org/10.1109/AIM46323.2023.10196110.
4. Harold Manuel Madrid-Alvarez, J. Carlos García-Díaz, Víctor G. Tercero-Gómez. (2025). A CUSUM control chart for the Gamma distribution with cautious parameter learning. Quality Engineering, 37(3), p.452. https://doi.org/10.1080/08982112.2024.2440368.
5. Rafael García-Jiménez, J. Carlos García-Díaz, Alexander D. Pulido-Rojano. (2023). Bicriteria food packaging process optimization in double-layered upright and diagonal multihead weighers. Journal of Computational and Applied Mathematics, 428, p.115168. https://doi.org/10.1016/j.cam.2023.115168.
6. Nhựt Thanh Trần, Công Thương Dương, Phước Ân Nguyễn, Tiến Trung Đái, Hoàng Dũng Nguyễn. (2024). Thiết kế, chế tạo và thử nghiệm hệ thống cân đa đầu. CTU Journal of Science, 60(SDMD), p.305. https://doi.org/10.22144/ctujos.2024.462.
7. Christal Clashing, Ian Smith, Maria F. Montoya, Rakesh Patibanda, Swamy Ananthanarayan, Sarah Jane Pell, Florian Floyd Mueller. (2022). Going into Depth: Learning from a Survey of Interactive Designs for Aquatic Recreation. Designing Interactive Systems Conference. , p.1119. https://doi.org/10.1145/3532106.3533543.
8. Pom An, Chol-Jun Hong, Ryong-Yon Ri, Chol-Jun Yu, Chol-Jun O. (2024). An Improved Single Objective Optimization Approach for Double-Layered Multi-Head Weighing Process . Mathematical Modelling and Applications, 9(3), p.61. https://doi.org/10.11648/j.mma.20240903.12.
9. Rafael García-Jiménez, J. Carlos García-Díaz, Alexander D. Pulido-Rojano, José-Fernando Camacho-Vallejo. (2024). Packaging process optimization for multihead weighing machines with vertical and diagonal double-layered systems: A bi-level approach. Expert Systems with Applications, 240, p.122591. https://doi.org/10.1016/j.eswa.2023.122591.
10. Dor Ma'ayan, Itai Dabran. (2019). Case Study: Implementing an Industrial IoT solution for a Multihead Weighing Machine (MWM). 2019 IEEE International Conference on Microwaves, Antennas, Communications and Electronic Systems (COMCAS). , p.1. https://doi.org/10.1109/COMCAS44984.2019.8958013.
11. Rafael García-Jiménez, J. Carlos García-Díaz, Alexander D. Pulido-Rojano. (2021). Packaging Process Optimization in Multihead Weighers with Double-Layered Upright and Diagonal Systems. Mathematics, 9(9), p.1039. https://doi.org/10.3390/math9091039.
Dimensions
PlumX
Visitas a la página del resumen del artículo
Descargas
Licencia
Derechos de autor 2017 DYNA

Esta obra está bajo una licencia internacional Creative Commons Atribución-NoComercial-SinDerivadas 4.0.
El autor o autores de un artículo aceptado para publicación en cualquiera de las revistas editadas por la facultad de Minas cederán la totalidad de los derechos patrimoniales a la Universidad Nacional de Colombia de manera gratuita, dentro de los cuáles se incluyen: el derecho a editar, publicar, reproducir y distribuir tanto en medios impresos como digitales, además de incluir en artículo en índices internacionales y/o bases de datos, de igual manera, se faculta a la editorial para utilizar las imágenes, tablas y/o cualquier material gráfico presentado en el artículo para el diseño de carátulas o posters de la misma revista.


