


Publicado
Design and optimization of a reverse electrodialysis stack for energy generation through salinity gradients
Diseño y optimización de una pila de electrodiálisis inversa para generación de energía a partir de gradiente salino
DOI:
https://doi.org/10.15446/dyna.v84n202.59321Palabras clave:
Reverse Electrodialysis, salinity gradient power, design, optimization (en)Electrodiálisis inversa, energía a partir de gradiente salino, diseño, optimización (es)
Descargas
Recibido: 27 de julio de 2016; Revisión recibida: 22 de mayo de 2017; Aceptado: 7 de julio de 2017
Resumen
Se presenta y resuelve un modelo para diseño de pilas de Electrodiálisis inversa. Se propuso una nueva función de optimización para RED, que tienen en cuenta el consumo de agua de río, la densidad de potencia neta y la eficiencia termodinámica del proceso. Los parámetros de tiempos de residencia y espesor de compartimientos fueron optimizados correctamente usando la nueva función propuesta. Los resultados sugieren pequeños tiempos de residencia, compartimientos de espesores delgados, poca área transversal y relaciones bajas de Longitud/ Ancho del compartimiento para máxima generación de energía.
Palabras clave:
Electrodiálisis inversa, energía a partir de gradiente salino, diseño, optimización..Abstract
A model for design of Reverse Electrodialysis stacks for energy generation is presented and solved. A new optimization function is proposed for RED, which accounts for river water consume, net power density and thermodynamic efficiency of the process. The parameters of residence time and thickness of the compartments are successfully optimized using the new proposed function. Results suggest small residence time, compartments thickness, and transversal area and Long/Width ratio for maximum energy generation.
Keywords:
Reverse Electrodialysis, salinity gradient power, design, optimization..1. Introduction
Salinity gradients are found in nature when rivers meet the sea. Artificially, they are found in desalination plants which have concentrated salt brines effluents that are usually discharged directly to the sea, and bring adverse impacts on vulnerable ecosystems like mangrove forests, salt marshes, coral reefs, or generally, low energy intertidal areas [1-3].
Estimations of practical global energy potential for salinity gradients between river and sea water, suggests that 3% of the world energy demand could be satisfied [4]. Only for Magdalena River in Colombia, taking into account its environmental constrains, a technical potential for an installed capacity greater than 15 GW has been calculated [5], which makes it the sixth river with more extractable energy in the world [4].
Colombia is rich in both, river and sea water, and its oceanographic and climate conditions favor the harnessing of Salinity Gradient Power (SGP) more than other types of marine energy [6]. This power could be a clean source of energy for Colombia, replacing coal plants, small diesel generators from rural and off grid areas, and even used for cogeneration systems, mitigating environmental impacts in desalination plants [7,8].
Electrical power cannot be extracted under spontaneous mixing conditions, because the process is thermodynamically irreversible [9]. The technologies for extracting SGP allow to transform the diminution of Gibbs free energy available when mixing two solutions with different salt content, in electrical energy, performing the mixing under controlled conditions.
Several technologies are being developed for harnessing artificial or natural SGP [10-13]: Pressure Retarded Osmosis (PRO) uses the Osmotic pressure difference with membranes selective for water [14,15], Capacitive Mixing uses the expansion and contraction effect of the electrical double layers using activated carbon capacitors [12], and Reverse Electrodialysis (RED) uses the electrochemical potential difference with ion selective membranes (IEM) [16].
RED is one of the most extensively studied technology in the recent years, it has been demonstrated that it can be suitable for different applications like waste heat recovery using artificial solutions [17], wastewater treatment when coupled with biological processes [18] and energy extraction with redox or capacitive electrodes [13]. Due to its possibilities and advantages, RED is the focus of this work.
Fig. 1 shows the sketch of a RED cell. It consists in a set of ion exchange membranes, alternating cation (CEM), and anion exchange membranes (AEM), which are charged negatively and positively respectively. Using this membrane arrangement, river and sea water flow between membranes and in this way compartments are formed. Due to the difference in salt concentration between the waters, there is an electrochemical potential difference, which is the motive force for ions to flow through the membranes from the sea water compartments, to the river water compartments. This part of the system is called ionic circuit, and it is in charge of performing the mixing process in a thermodynamically reversible way.

Figure 1: Schematic view of a RED cell.
Using this membrane circuit allows cations to move in one direction and anions to move in the opposite direction. As a result of the controlled ion movement, an electrical potential difference arises in the membranes. The total voltage obtained from the stack, is the sum of electrochemical potential of each of the membranes.
In order to convert the ionic flux in the membrane circuit into electrical current, the generated voltage is used to perform reversible reduction/oxidation reactions in the electrodes that allow to transport electrons through an external circuit, and thus power is produced.
2. Theoretical model
2.1. Maximum obtainable energy
The theoretical available energy in mixing (m) a concentrated (c) and a diluted (d) solution, corresponds to the Gibbs free energy of mixing  [19].
[19].

Where  ,
,  and
and  are the Gibbs energy of the mix, concentrated and diluted solution respectively. After replacing the definition of Gibbs free energy of each of the initial and final states of the process becomes:

Where R is the universal gas constant (8.314 J/mol K), T is absolute temperature (K),  and
and  are volumetric flow of concentrated and diluted solution, and
  ,
,  , and
, and  are the salt concentration of concentrated, diluted and mix solutions respectively. Factor 2 corresponds to dissociation of NaCl. , it is calculated as

2.2. Mass balance
Fig. 2 shows a mass balance scheme for concentrated and diluted compartments with length , width
 and thickness
 . Water flows in the x direction. Transport of ions through the membranes occurs from the concentrated to the diluted compartments, while water passes in the reverse direction due to an osmotic effect and the non-ideal behavior of membranes. The mass balance leads to the differential equations that describe the change in salt concentration within the compartments in stationary state [20].


Where  is salt flux across the membranes (mol /m2 s) and
  is volumetric water flux across the membranes (m/s). Water transport is given by

Where  is the water diffusion coefficient (m2/s),
  is the membrane thickness (m),
  is water’s molar mass and
  is water density. The factor of molar mass over molar density is added for making a volumetric flow.

Figure 2: Mass balance for concentrated and diluted compartments.
Transport of NaCl through the membranes is driven by two major effects: Migration of counter-ions due to electrochemical potential difference, and diffusion of co-ions due to non-idealities in membrane selectivity.

Diffusion transport is described by Fick’s model.

Where is the diffusion constant of salt through membranes. For describing migration, Ohm’s principle is used.

Where  is the electrical potential,
  is the cell resistance and F is the faraday constant, which is needed to convert coulombic flux into mol flux.
  Can be calculated with Nernst equation:
Where  is the permselectivity of the membranes and
  is the activity coefficient of each of the ions in the different solutions. For diluted and concentrated solutions, activity coefficients may be estimated from the Pitzer model [21], which can be simplified for symmetric electrolytes to eq. (11)-(14).


Where  is the ionic strength of the solution,
  is the Debye-Huckel coefficient for osmotic function (0.392 for water at 25 °C), values of and b are 2 y 1.2 respectively and values of
 y
y  vary depending on the electrolyte used [21].
On the other hand, the resistance of the cell is the sum of resistances of anion and cation exchange membranes ( ), the river water compartment (
 ) and the sea water compartment (
 ).
).

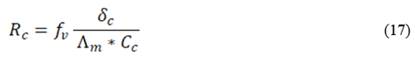
The resistivity of the membranes is a property given by the membrane manufacturer. The resistance of the compartments eq. (16)-(17) depend on the thickness of the compartments  (m), the molar conductivity
  (S m2/mol) and on the solution concentration (mol/m3). Is dependent on concentration, but if a suitable value is used for low concentration compartment, calculated resistance of the river compartment is reliable [20]. As the sea water compartment resistance is much lower, its value has low influence on the total stack resistance. A correction factor is introduced for the volume occupied by the spacer material
 , which is a measure of the increase in electrical resistance due to negative effect of spacers, such as tortuosity in the ion flux trajectory and decrease in available volume for solution to flow.

2.3. Net power produced
Once the system of equations is solved through the flow trajectory x, local power density  delivered to an external circuit can be found. In the particular case of maximum power, external resistance
  should be equal to the internal resistance
 .
.

Where N is the number of cells, and  is the migration current multiplied by the Faraday constant (A/m2). The factor ½ is due to the fact that area is duplicated because of the use of two membranes (CEM y AEM). Total power density produced is obtained with the integration of
  over the length of the compartment L in the x direction, divided by the total membrane area.
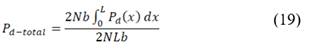
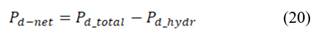
Net power density produced is calculated as the difference between total power produced and hydrodynamic losses of the stack corrected for total membrane area.
Where hydrodynamic losses  are calculated as the pressure drop over the stack, times the volumetric flow of each stream, divided by total membrane area.

For calculating the pressure drop over the stack, Reynolds number is used to know flow regime of streams inside the compartments

In this case  represents mean velocity, D is the hydraulic diameter,
  is liquid density and
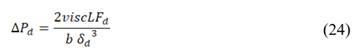
  is the dynamic viscosity (0.9 x 10⁻³ Pa s for water). For the flow between to plane parallel plates, hydraulic diameter is equal to 2 times the distance between them. Applying this equation to small cells (0.1 m x 0.1 m and a thickness compartment of 200 m), for low residence times, a Reynolds number of the order of 0.01 is obtained, which can be interpreted as laminar flow over the compartments [20]. For laminar flow, pressure drop over the compartments is defined as:

Flow rate is calculated as the dimensions of the compartments over the residence time of the solutions.
Fig 3 shows the behavior of total power and hydrodynamic losses with residence time. From the figure it can be seen that very low values of residence times lead to very high pressure drops, which results in unpractical values of net power (Fig 3 up)
From Fig. 3 (Down) it can be seen that net power is a parameter suitable for optimization because the function presents a maximum value. Nonetheless, it is important to notice that it does not account for thermodynamic efficiency of the process.

Figure 3: (Up) Total power density and hydraulic losses behavior with residence time. (Down) Net power density Vs residence time.
2.4. Lost work
If optimization is performed using only the net power density parameter, low values of thermodynamic efficiency are achieved, due to the fact that favoring power density, leads to higher velocity of the processes and thus, more thermodynamically irreversible losses. Thus it is important to optimize taking into account thermodynamic efficiency of the process
Lost power  is defined as the difference between maximum energy theoretically obtainable and real energy obtained by the RED stack, divided by total membrane area

 Corresponds to the available energy when mixing process is complete, as defined in eq. (2).
  Is the actual extracted energy from the RED stack.
Where  y
y  are the outlet salt concentrations in the concentrated and diluted streams respectively.
Fig 4 shows the behavior of net power density and lost work with residence time. From Fig 4 (up) it can be seen that further refines the optimization of net power output, taking into account the lost power when concentrations are not in equilibrium at the RED stack outlet.
2.5. Optimization objective function
Using the parameters described in the previous section, a new optimization function is proposed. It includes all the response parameters relevant for optimization of RED stacks mentioned in literature [20], and it comprises them in one optimization function that has a mathematical minimum. This function allows to minimize lost work and maximize net power output, using power density as the common unit to make calculations. Net power is negative because optimization looks for minimization of objective function.

Taking into account that fresh water is the limiting factor for energy generation through salinity gradients, and in order to minimize the use of this valuable resource, sea water fraction  is used in the optimization function to maximize sea water consume.

Several individual parameters have been introduced in literature that account for energy efficiency or power density to optimize power output in RED. Nonetheless an optimization function with a theoretical minimum that accounts for all of these parameters together had not been proposed until now. Fig. 4 (Down) shows the behavior of the objective function with residence time. It can be observed that there is a minimum in the objective function, which gives at the same time maximization of net power and minimization of lost work and river water use.

Figure 4: (Up) Comparison between lost work and net power with residence time. (Down) Behavior of defined objective function ( with residence time.
3. Results and discussion
In order to validate the model with previous results reported in literature, parameters used for evaluation of the model are the same used by Veerman et al. for a 10x10 cm cell [16,20]. Residence time for river and sea water was 60 s, obstruction factor was 2,  membranes selectivity of 0.88, thickness of the compartments of 200 µm, NaCl diffusion coefficient of
  and input salt concentrations are 512.8
  for concentrated stream and 17.1 for the diluted stream. The model was solved with Matlab ® software.
Fig. 5 shows model results for co-current mode (left) and counter-current mode (right), which are in agreement with model and experimental results presented by Veerman et al [16,20]. Counter current mode presents better ionic current distribution than co-current as may be seen from power profiles in Fig 5. This may seem as an operational advantage, nonetheless, counter current operation introduces high local pressure differences between the compartments, which increases chances of possible leakages [20,22].
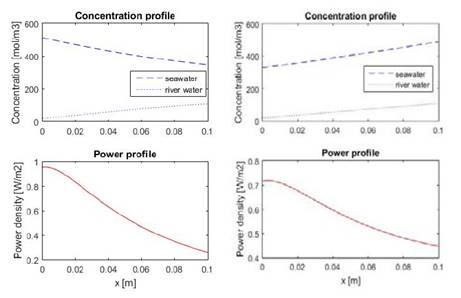
Figure 5: Model results for co-current operation (left) and counter-current operation (right). Local concentration inside the compartments (up) and local net power denisity (down) are shown.
Due to the fact that counter current operation presents more technical issues than co-current, and net power generated is very similar for both modes of operation, optimization is performed only for co-current mode.
After validation of the model is done with previous literature, optimization is performed for a stack with Fujifilm membranes and no spacers (Table 1). Effect of the length of the flow path is evaluated for a width of the compartment b of 0.1 m. Optimized parameters are residence times of sea and river water, and thickness of the compartments.
Source: The authors.Table 1: Optimized parameters and net power density obtained for different length of the compartments.

Results of optimizations show that residence time of river water is bigger than sea water, suggesting less river water consume for energy generation. This proves that optimization function, satisfactory fulfills the requirement to reduce river water consume. For the optimization of the compartments thickness, results in Table 1 suggest that sea water compartments could be up to ten times the thickness of the river water compartment. This result is due to the fact that river water has more electrical resistance than sea water because of its low salts content.
Nonetheless this last result might not very practical in real conditions, because having 1 micrometer thickness compartments for river water, would cause frequently clogging of the stack. Besides, it has been proven that a good antifouling strategy is to exchange the streams in the compartments every now and then, but in order to apply it, it is necessary that the compartments are symmetrical [23]. Moreover, other energy generation methods have been proposed like using electric double layer capacitors instead of electrodes, but this method requires to exchange the waters between compartments regularly [13]. However, the advantage of the model is the possibility to choose the parameters to optimize. Thus, it would be interesting to optimize for symmetrical compartments.
On the other hand, results for residence times for river and sea water agree with other results obtained in literature [20]. Linear velocities between 1 and 7 cm/s are recommended for river water, while higher velocities between 4 and 14 cm/s are recommended for sea water, depending on the compartment length and membrane area.
From Table 1 it can also be noticed that net power density decreases when increasing cell length. As power density is directly related to the cost of a RED stack, increasing cell length will only increase cost, while decreasing economic efficiency or viability of the process.
Table 2 presents a comparison between  ,
,  and thermodynamic efficiency
  for the same values presented in Table 1, in terms of area. It is important to notice that, although bigger areas present in general higher total power generation and better thermodynamic efficiencies, it has a decreasing effect on net power density.
Source: The authors.Table 2: Comparison between net power, net power density and thermodynamic efficiency of the process with transversal area of the stack.
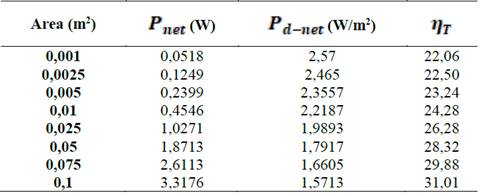
Natural processes follow the maximum entropy principle, sacrificing efficiency in order to get more power. Thus it is reasonable to design RED stacks with smaller areas because they favor net power per square meter membrane over thermodynamic efficiency, decreasing the cost of investment of the plant up to 60 % according to the results in Table 2.
An optimization was performed in order to study the effect of Long (L) / Width (b) ratio (keeping a constant area of 0.01 m2) on Net power density, and thermodynamic efficiency. Table 3 shows clearly how increasing cell length, increases thermodynamic efficiency of the process, due to the fact that longer paths allow more ion exchange through the membranes, but they also increase hydrodynamic losses. Smaller L/b ratios achieve 30% more net power density, and thus bigger widths than lengths are recommended for stack design.
Source: The authors.Table 3: Analysis of net power density and thermodynamic efficiency with L/b ratio for a constant area of 0.01 m2.

Taking all the previous considerations, as well as technical and practical construction issues, a cell with dimensions b=0.3 m and L=0.03 m is proposed. For this dimensions, optimized parameters are shown in Table 4.
Source: The authors.Table 4: Optimized parameters for the proposed cell design.

Concentration and power profiles within the compartments for the optimized design are shown in Fig. 6. From the figure it is possible to notice that river water compartment develops a concentration profile, while sea water compartment does not. This happens due to the fact that smaller residence leads to higher volumetric flow for sea water, which causes that the change in concentration of sea water inside the compartment is very small compared to the change in concentration of the river water compartment.

Figure 6: Concentration (up) and power (down) profiles for the optimized cell design.
It is also possible to notice that local power is bigger at the fluid entrance, this is caused because there is bigger concentration difference at the beginning, which is traduced in more electromotive force, and thus more power.
4. Conclusions
A new proposed objective function was used for optimizing a RED stack which minimizes river water use, maximizes net power output, and introduces the concept of lost work as a way of taking thermodynamic efficiency into account in the same units as net power density. This allows to calculate and find a theoretically minimum value of the difference between lost work and net power density. It was proven that the function has a mathematical minimum of exists, thereof accounting for all of the parameters proposed in literature together in one function.
In comparison with other optimizations done in the past, the new optimization function will allow a straightforward optimization of RED stacks for different operation parameters. Results agree with optimizations performed in literature, and with linear velocities suggested in different RED studies. The optimization suggest small areas and L/b ratios for obtaining better net power densities.
Acknowledgments
This work was performed thanks to the support of research group GRIEQUI and OCEANICOS, and Colciencias, agency of science and technology in Colombia through the programs Jóvenes Investigadores and 700 - proof of concept.
Bibliografía
Referencias
Höpner, T. and Windelberg, J., Elements of environmental impact studies on coastal desalination plants. Desalination, 108, pp. 11-18, 1997. DOI: 10.1016/S0011-9164(97)00003-9.
Höpner, T. and Lattemann, S., Chemical impacts from seawater desalination plants — A case study of the northern Red Sea. Desalination, 152, pp. 133-140, 2003. DOI: 10.1016/S0011-9164(02)01056-1.
Bleninger, T. and Jirka, G.H., Modelling and environmentally sound management of brine discharges from desalination plants. Desalination, 221(1–3), pp. 585-597, 2008. DOI: 10.1016/j.desal.2007.02.059
Alvarez-Silva, O.A., Osorio, A.F. and Winter, C., Practical global salinity gradient energy potential, Renew. Sustain. Energy Rev., 60, pp. 1387-1395, 2016. DOI: 10.1016/j.rser.2016.03.021.
Alvarez-Silva, O., Salinity Gradient Energy Harnessing at River Mouths, 2014. DOI: 10.1021/ez500239n.
Osorio, A., Agudelo, P., Otero, L. y Correa, J., Las energias del mar, Propiedad Pública, 2013.
Tedesco, M., Scalici, C., Vaccari, D., Cipollina, A., Tamburini, A. and Micale, G., Performance of the first reverse electrodialysis pilot plant for power production from saline waters and concentrated brines. J. Memb. Sci., 500, pp. 33-45, 2016. DOI: 10.1016/j.memsci.2015.10.057.
Tedesco, M., Cipollina, A., Tamburini, A., Bogle, I.D.L. and Micale, G., A simulation tool for analysis and design of reverse electrodialysis using concentrated brines, Chem. Eng. Res. Des., 93(January), pp. 441-456, 2015. DOI: 10.1016/j.cherd.2014.05.009.
Pattle, R.E., Production of electric power by mixing fresh and salt water in the hydroelectric pile, Nature, 174(4431), pp. 660-660, 1954. DOI: 10.1038/174660a0.
Veerman, J., Reverse electro- dialysis, s.a.
Post, J.W., Veerman, J., Hamelers, H.V.M., Euverink, G.J.W., Metz, S.J., Nymeijer, K. and Buisman, C.J.N., Salinity-gradient power: Evaluation of pressure-retarded osmosis and reverse electrodialysis, J. Memb. Sci., 288(1–2), pp. 218-230, 2007. DOI: 10.1016/j.memsci.2006.11.018.
Jiménez, M.L., Fernández, M.M., Ahualli, S., Iglesias, G. and Delgado, A.V., Predictions of the maximum energy extracted from salinity exchange inside porous electrodes, J. Colloid Interface Sci., 402, pp. 340-349, 2013. DOI :10.1016/j.jcis.2013.03.068.
Vermaas, D.A., Bajracharya, S., Sales, B.B., Saakes, M., Hamelers, B. and Nijmeijer, K., Clean energy generation using capacitive electrodes in reverse electrodialysis, Energy Environ. Sci., 6 P., 643, 2013. DOI: 10.1039/c2ee23562e.
Jia, Z., Wang, B., Song, S. and Fan, Y., Blue energy: Current technologies for sustainable power generation from water salinity gradient, Renew. Sustain. Energy Rev., 31, pp. 91-100, 2014. DOI: 10.1016/j.rser.2013.11.049.
Cui, Y., Liu, X.Y. and Chung, T.S., Enhanced osmotic energy generation from salinity gradients by modifying thin film composite membranes, Chem. Eng. J., 242, pp. 195-203, 2014. DOI: 10.1016/j.cej.2013.12.078.
Veerman, J., Reverse electro-dialysis. Design and optimization by modeling and experimentation. 2010.
Luo, X., Cao, X., Mo, Y., Xiao, K., Zhang, X., Liang, P. and Huang, X., Power generation by coupling reverse electrodialysis and ammonium bicarbonate: Implication for recovery of waste heat, Electrochem. Commun., 19(1), pp. 25-28, 2012. DOI: 10.1016/j.elecom.2012.03.004.
D’Angelo, A., Galia, A. and Scialdone, O., Cathodic abatement of Cr(VI) in water by microbial reverse-electrodialysis cells, J. Electroanal. Chem., Vi, 2015. DOI: 10.1016/j.jelechem.2015.04.010.
Veerman, J., Saakes, M., Metz, S.J. and Harmsen, G.J., Reverse electrodialysis: Performance of a stack with 50 cells on the mixing of sea and river water. J. Memb. Sci., 327, pp. 136-144, 2009. DOI: 10.1016/j.memsci.2008.11.015.
Veerman, J., Saakes, M., Metz, S.J. and Harmsen, G.J., Reverse electrodialysis: A validated process model for design and optimization. Chem. Eng. J., 166, pp. 256-268, 2011. DOI: 10.1016/j.cej.2010.10.071.
Pitzer K.S. and Mayorga, G., Thermodynamics of electrolytes. II. Activity and osmotic coefficients for strong electrolytes with one or both ions univalent. J. Phys. Chem., 77(19), pp. 2300-2308, 1973.
Veerman, J., Saakes, M., Metz, S.J. and Harmsen, G.J., Electrical power from sea and river water by reverse electrodialysis: a first step from the laboratory to a real power plant. Environ. Sci. Technol., 44(23), pp. 9207-9212, 2010. DOI: 10.1021/es1009345.
Cómo citar
IEEE
ACM
ACS
APA
ABNT
Chicago
Harvard
MLA
Turabian
Vancouver
Descargar cita
CrossRef Cited-by
1. Milad Shadman, Mateo Roldan-Carvajal, Fabian G. Pierart, Pablo Alejandro Haim, Rodrigo Alonso, Corbiniano Silva, Andrés F. Osorio, Nathalie Almonacid, Griselda Carreras, Mojtaba Maali Amiri, Santiago Arango-Aramburo, Miguel Angel Rosas, Mario Pelissero, Roberto Tula, Segen F. Estefen, Marcos Lafoz Pastor, Osvaldo Ronald Saavedra. (2023). A Review of Offshore Renewable Energy in South America: Current Status and Future Perspectives. Sustainability, 15(2), p.1740. https://doi.org/10.3390/su15021740.
2. Sajjad Khudhur Abbas Al-Amshawee, Mohd Yusri Bin Mohd Yunus. (2024). Electrodialysis membrane with concentration polarization – A review. Chemical Engineering Research and Design, 201, p.645. https://doi.org/10.1016/j.cherd.2023.10.060.
3. Mateo Roldan-Carvajal, Sara Vallejo-Castaño, Oscar Álvarez-Silva, Sebastián Bernal-García, Santiago Arango-Aramburo, Carlos I. Sánchez-Sáenz, Andrés F. Osorio. (2021). Salinity gradient power by reverse electrodialysis: A multidisciplinary assessment in the Colombian context. Desalination, 503, p.114933. https://doi.org/10.1016/j.desal.2021.114933.
4. Michele Ciofalo, Mariagiorgia La Cerva, Massimiliano Di Liberto, Luigi Gurreri, Andrea Cipollina, Giorgio Micale. (2019). Optimization of net power density in Reverse Electrodialysis. Energy, 181, p.576. https://doi.org/10.1016/j.energy.2019.05.183.
5. Juan Carlos Alcérreca-Huerta, Mariana Elvira Callejas-Jiménez, Laura Carrillo. (2022). Small-scale energy potential from salinity gradients at a transboundary riverine estuary in the Yucatán Peninsula. Cleaner Engineering and Technology, 11, p.100562. https://doi.org/10.1016/j.clet.2022.100562.
6. Muhammad M. Generous, Naef A.A. Qasem, Syed M. Zubair. (2021). Entropy generation analysis of electrodialysis desalination using multi-component groundwater. Desalination, 500, p.114858. https://doi.org/10.1016/j.desal.2020.114858.
7. Zhaozhe Han, Xi Wu, Lin Xu, Ping He. (2026). Experimental Performances of Titanium Redox Electrodes as the Substitutes for the Ruthenium–Iridium Coated Electrodes Used in the Reverse Electrodialysis Cells for Hydrogen Production. Membranes, 16(1), p.26. https://doi.org/10.3390/membranes16010026.
Dimensions
PlumX
Visitas a la página del resumen del artículo
Descargas
Licencia
Derechos de autor 2017 DYNA

Esta obra está bajo una licencia internacional Creative Commons Atribución-NoComercial-SinDerivadas 4.0.
El autor o autores de un artículo aceptado para publicación en cualquiera de las revistas editadas por la facultad de Minas cederán la totalidad de los derechos patrimoniales a la Universidad Nacional de Colombia de manera gratuita, dentro de los cuáles se incluyen: el derecho a editar, publicar, reproducir y distribuir tanto en medios impresos como digitales, además de incluir en artículo en índices internacionales y/o bases de datos, de igual manera, se faculta a la editorial para utilizar las imágenes, tablas y/o cualquier material gráfico presentado en el artículo para el diseño de carátulas o posters de la misma revista.


