


Publicado
Assessment of evaporative cooling efficiency in greenhouses equiped with wetted porous plates
Evaluación de la eficiencia de equipos de enfriamiento evaporativo usando placas porosas en invernaderos
DOI:
https://doi.org/10.15446/dyna.v84n203.59564Palabras clave:
Greenhouse, mathematical modeling, simulation, heat and mass transfer (en)Invernadero, modelo matemático, simulación, transferencia de calor y masa (es)
Descargas
Recibido: 12 de septiembre de 2016; Revisión recibida: 14 de septiembre de 2017; Aceptado: 25 de septiembre de 2017
Abstract
The main objective of this study was to experimentally validate a mechanistic model for predicting the cooling efficiency (η) of wetted porous plates built with expanded clay. The expanded clay material was physically characterized by specific mass, surface area, and volume. The model was validated with dry bulb temperature (Tdb, °C) and air relative humidity (RH, %) data, which were continuously monitored in two different points, upstream and downstream the direction of the air passing through the porous plate. Data collection was carried out consecutively for a period of 10 days, between 11:00 a.m. and 4:00 p.m. Average values for η, simulated and observed, were 74.8 ± 7.4% and 68.3 ± 8.3%, respectively. Based on the developed model, it was observed that η was higher than 40% for Tdb > 30 °C and constant RH at 45%. The simulation for predictions indicates that the increase in the air temperature greater than 20 °C may affect negatively the production in greenhouses from states located in tropical and subtropical countries as Minas Gerais, Brazil, if some design criteria in the evaporative cooling system are not revised.
Keywords:
Greenhouse, mathematical modeling, simulation, heat and mass transfer..Resumen
El objetivo principal de este estudio fue validar experimentalmente un modelo mecánistico para predecir la eficacia de enfriamiento (η) de placas porosas construidas con arcilla expandida. El material de arcilla expandida fue físicamente caracterizado encontrando su masa específica, área superficial y volumen. El modelo fue validado con datos de temperatura de bulbo seco (Tdb, ° C) y humedad relativa del aire (humedad relativa,%) que fueron continuamente monitoreados en dos puntos diferentes, en contra y a favor de la dirección del aire que pasa a través de la placa porosa. La recolección de datos se llevó a cabo de forma consecutiva durante un período de 10 días entre las 11:00 y 4:00 p.m. Los valores medios de η, simulados y observados, fueron 74,8 ± 7,4% y 68,3 ± 8,3%, respectivamente. Basado en el modelo desarrollado, se observó que η fue mayor del 40% para Tdb> 30 ° C y HR constante en 45%. La simulación indicó que el aumento de la temperatura del aire puede afectar negativamente la producción en invernaderos en Estados como Minas Gerais, Brazil, si no se revisan algunos criterios de diseño en el sistema de enfriamiento por evaporación.
Palabras clave:
Invernadero, modelo matemático, simulación, transferencia de calor y masa..1. Introduction
Climate change is no longer considered a questionable scientific hypothesis, but an inevitable paradigm [1]. One of its consequences is that some regions of the globe are being exposed to extreme (high or low) temperatures. Specifically, tropical regions are facing abnormally warm summers, impacting both natural ecosystems and human intervened environments. In the latter, agriculture may be the sector of society that is mostly sensitive to extreme temperatures.
Production efficiency in greenhouse systems are inherently dependent on external factors such as climatic agents (dry bulb temperature - Tdb, relative humidity - RH, solar radiation, etc.), and design factors such as the roofing and walls materials and the presence of insect protection screens [2,3]. Climate control mechanisms, such as the ventilation and evaporative cooling systems [4], are essential for allowing optimum convective transfer of water vapor, gases and heat, keeping the internal environment at healthy levels.
Typical forms of evaporative cooling systems for protected environments consist of misting systems (low and high pressure), or forced passage of air through wetted porous plates by means of a ventilation system. According to [5], depending on the climatic conditions of the region where the evaporative cooling system is developed, Tdb may be reduced up to 11°C. In tropical regions such as in Brazil, the average temperature drop is about 6°C.
The operating principle of evaporative cooling systems involves processes induced by heat and mass transfer, where water (either in its liquid or vapor state) and air are the working fluids. This process consists in evaporating water induced by the passage of an airflow, thus decreasing the Tdb [6-8].
In order to evaluate and compare different evaporative cooling systems, various research studies have been conducted in the field [9-11]. However, limitations such as insufficient number of greenhouses with similar systems at the same location, and the high costs for conducting experimental research, have hampered the conduction of field studies covering a significant number of variables and factors.
A possible solution to this problem can be the use of models and computer simulations, followed by field validations. Subsequently, such validated models may be used to indicate the most relevant factors or variables, which, ultimately, are to be tested experimentally. Currently, a number of modeling techniques have been applied to simulate evaporative cooling systems in greenhouses [12,13]. These modeling approaches are still labor-intensive and require the acquisition of expensive specific commercial packages.
The development or adaptation of a mechanistic model for evaporative cooling systems that is relatively simpler but still able to accurately represent reality needs to be further evaluated. Evaporative coolers have been widely used for crop production in greenhouses due to their relatively good cost/benefit ratio. In these systems, the quantification of the efficiency (η) is of great importance.
The aim of the present work was: a) to describe and validate a mechanistic model developed to predict the evaporative cooling efficiency (η) of a wetted porous plate (PAD) system applied to a greenhouse, and b) present some experimental results in future scenarios of climate change.
2. Material and methods
2.1. Model description
The evaporative cooling efficiency (η) is calculated from the variables dry bulb temperature (Tdb) and wet bulb temperature (Twb) of the air, measured both upstream and downstream the pads, according to Eq.1 [14].
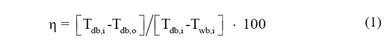
Where: η - evaporative cooling efficiency (%); Tdb,i and Tdb,o - dry bulb temperature of the air upstream and downstream the pad cooling system, respectively (oC); and Twb,i - wet bulb temperature of the air upstream the pad cooling system, (oC).
Fig. 1 can be observed the schematic representation of an evaporative cooling system of the wetted porous material type, where: a) Variable of air upstream the PAD cooling system: Tdb,i - dry bulb temperature (oC), ωa,i - mixing ratio gradient (kg kg-1); Patm - Atmospheric pressure (kPa),  - flow of water passing through the cooling plate (kg s-1); b) Variable of water: Twater,i - water temperature used to wet the cooling plate (° C) and
  - water flow through the cooling plate (kg s-1); c) Variable of PAD cooling: W - cooling plate width (m); H - cooling plate height (m) and L - thickness of the cooling plate (m); d) Variable of air downstream the PAD cooling system: Tdb,o - dry bulb temperature of the air upstream (° C) and ωa,o - air mixture ratio after going through the cooling plate (kg kg-1).

Figure 1: Schematic representation of an evaporative cooling system.
Hence, a mathematical model for predicting η in pad cooling systems was developed, based on the heat and mass transfer equations proposed by [15]. The transfer of sensible heat between the air and the existing water film of the porous material can be expressed by Eq. 2, which, after integration (Eq. 3), resulted in Eq. 4, that predicts the temperature of the air after crossing the cooler (Tbs,o).

Where: dqa,s - sensible heat gradient (W); ma - mass flow of air across the cooling plate (kg s-1); cp,a - specific heat of air (kJ kg-1 K-1); dTbs - dry bulb air temperature gradient (°C); h - convective heat transfer coefficient (W m-2 K-1); Twater - temperature of the water used in the cooling plate wetting (ºC); and dA - area gradient (m2).
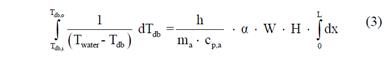
Where: α - surface area of wetted porous plate, per unit volume (m2 m-3); W - cooling plate width (m); H - cooling plate height (m); L - thickness of the cooling plate (m); and dx - infinitesimal variation of the cooling plate thickness (m).

Where: Tdb,o - air temperature before crossing the plate (ºC).
Similar to the heat balance performed in equations 1 through 4, a mass balance was performed for water vapor (Eq. 5), which, after substitutions and subsequent incorporation into (Eq. 6) resulted in Eq. 7, used for the prediction of air mixing ratio after crossing the plate (ωa,o).

Where: dωa - mixing ratio gradient (kg kg-1); kd - mass transfer coefficient based on the use of the mixing ratio (kg m-2 s-1); ωA,s . (Tw) - mixing ratio to saturation conditions, depending on water temperature (kg kg-1); and ωA - mixing ratio in saturation conditions, depending on the water temperature (kg kg-1).
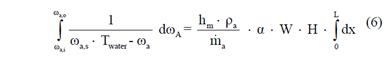
Where: ωa,i - air mixture ratio that passes through the cooling plate (kg kg -1); ωa,o - air mixture ratio after going through the cooling plate (kg kg-1); hm - mass transfer coefficient (m s-1); and ρa - air density (kg m-3).

For the calculation of the mass transfer coefficient (hm), Eq. 8 was used, and the Colburn factor jh was calculated by Eq. 9, as proposed by [16]. Eq. 9 is valid for the Prandtl number of about 0.7 and a Reynolds number between 90 and 4000.

Where: jh - J factor of Colburn (dimensionless); and υ - mass flow of air across the cooling plate (kg s-1).

Where: ReD - Reynolds number defined according to the diameter of the spheres (dimensionless); and ε - porosity of the cooling plate filling material (decimal).
Based on temperature and relative humidity inputs before crossing the wet porous plate (Tdb,i and RH,i respectively), wet bulb temperature was calculated (Twb,i). With the values of Tdb,i and Twb,i associated with Tdb,o, obtained by Eq. 4, the ηsimulated was obtained with Eq. 10. For the calculation of these and other psychometric properties, the methodology proposed by [17] was used.

The equations demonstrated above were implemented into MS Excel®, where all calculations and simulations of this study were performed.
2.2. Characterization of the porous material
It was used expanded clay pebbles as the porous material in this experiment. It was physically characterized by determining the bulk density, porosity, average diameter, average volume and surface area. Each sample consisted of 50 expanded clay pebbles collected randomly from the porous plate. The density of the porous material, Eq. 11, was determined using the methodology of volume complementation, similar to that adopted for determining the bulk density of grain [18].

Where: ρ - density of the porous material (g cm-3); m - mass of porous material (g); and V - volume of the porous material (cm 3).
The porosity, Eq. 12, was determined indirectly, by filling the pores of the expanded clay sample with a fluid until saturation, and from the measured volume of the liquid and the sample, determining the total porosity [19].

Where: P - total porosity of clays (%); V - porous volume (cm3); and Vtotal - total volume of the container (cm3).
The average diameter, volume and the surface area of the samples were obtained by taking photographs of 50 expanded clay with a digital camera (4.0 Mega-pixels) at different angles. These images were processed via Autocad program® 2012 (Autodesk). The results were used to calibrate the equations in order to characterize the modeled porous material as expanded clay.
2.3. Experimental setup and data collection for model validation
In order to check whether or not the model was able to realistically represent the cooling process of porous plates made of expanded clay, field measurements were performed at a greenhouse equipped with such a cooling system. The greenhouse was located in the Department of Plant Pathology, Federal University of Lavras (UFLA), in Lavras, Minas Gerais state, Brazil. Local geographical coordinates were 21° 14' south latitude, 45° 00' latitude west of Greenwich and 918 m above sea level. Measurements took place for ten consecutive days, between 11:00 a.m. and 4:00 p.m.
The greenhouse had dimensions of 22.1 m Length × 12.8 m Width × 2.9 m Heigth, covered with two arches of transparent plastic, east-west orientated, with four hoods. It was equipped with negative pressure tunnel ventilation system, and a series of 8 wetted porous pads measuring in total 12.8 m Length × 1.6 m Heigth × 0.1 m Depth, made of expanded clay. Fig. 2 shows the representation of the greenhouse studied.

Figure 2: Schematic representation of the greenhouse performed in this study. Unit: meters (m).
Portable recorders were installed and pre-programmed to collect Tbs and relative humidity (RH) (Hobo®, mod. U12-012, resolution: temperature of 0.03°C and RH of 0.03%) next to the two sides of the wetted porous plate at two-second intervals. In order to assure accuracy of measurements, the sensors were calibrated using a weather station following the manufacturer's instructions.
The variable Twater was monitored at the water reservoir with a digital thermometer (Instrutherm®, mod. TH-060, resolution of ± 0.1ºC and precision of 0.1%), at intervals of 30 minutes.
In order to determine the airflow rate through the wetted porous plate, one of the plates (dimensions 1.6 m Height × 1.5 m Length) was randomly selected and divided into nine equidistant sampling points according to the scheme of Fig. 3. Air velocity measurements were made via a digital propeller anemometer (Kestrel®, mod. 4000, precision of ± 3%), at 12 locations. The airflow values used in the simulations was obtained by the product of measured air velocity and area of the plate.

Figure 3: Schematic representation of equidistant points used to collect air velocity in wetted porous plate. Unit: meters (m).
2.4. Prediction of evaporative cooling efficiency for future scenarios
The composition of the future scenarios was developed in accordance to the forecast reported from [1], adding to the air temperature 2.0°C and 2.5ºC to the scenario B2 (more optimistic) in 2050 and 2100, respectively. For the composition of the scenario A2 (less optimistic) it was added 3.0°C e 8.0ºC for the years of 2050 and 2100 respectively.
The simulations were performed considering the dimensions of the cooling pad used for validation. The relative humidity, average temperature, maximum temperature and maximum atmospheric pressure were obtained from official climatologic maps for Minas Gerais state, in the period of 1961-1990 [20]. The simulations via mathematical model were performed using the empirical equations adjusted in this experiment in order to estimate the efficiency of the pad cooling.
3. Results and discussion
3.1. Summary of experimental data
Table 1 shows the average values of the main physical properties of the porous materials (volume, surface area, mean diameter, density and porosity), and variables form the cooling pads.
Source: The authors.Table 1: Physical properties of the cooling pads (mean ± standard error).
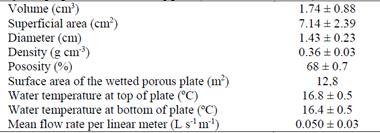
The diameter of the porous material was found to be (1.43 ± 0.23) cm, a result inferior to that described by [21], who found an average diameter of 2.7 cm for expanded clay. When evaluating different materials in wetted porous plates [22] found the best cooling efficiency with expanded clay average diameter of 2.4 cm. In Fig. 4, it is observed the values of the histogram for the diameter of the sampled expanded clay pebbles, with the largest occurrence lying between the diameters of 1.2 and 1.6 cm.

Figure 4: Values of relative frequencies for the diameters (Ø, cm) of the samples.
The density of expanded clay characterized in this study showed the average calculated value of 0.36 ± 0.03 g cm-3, which was lower than that found by [23], of 0.45 g cm-3. In addition, the found value for porosity of (68 ± 0.7) %, did not coincide with the value of 50% found by [23].
To the extent that the thickness of the porous material increases, resistance to airflow usually increases and therefore the air contact time with the moist porous material increases. If, for a given thickness, porosity and capillary action of the porous material is increased, the water distribution will be more uniform; however, a larger volume of water is necessary, thereby increasing the resistance to the ventilation of the air [24].
The measured water flow rates of (0.05 ± 0.03) L s-1 m-1 was much lower value than that described by [21], 0.14 L s-1 m-1 adopted for cellulose plates 10 and 15 cm thick. According to [21], the flow of water passing through the plate should be high enough to clean the dirt and mineral salts, without allowing their accumulation. Relatively lower flow value could cause clogging of pipes and holes due to algae growth as observed in their system. These algae can also grow within the porous material, thereby increasing resistance to airflow and decreasing the cooling efficiency.
The average air speed of (0.9 ± 0.31) ms-1 was similar to that found by [22], which varied between 0.74 to 1.09 ms-1 for expanded clay plates with 120 mm thick. According to [22], the evaporative cooling efficiency is greater for any air velocity between 0.44 and 1.28 ms-1.
The mean airflow rate calculated by the product of average speed and area of the porous plate was 2.04 m3s-1, which was higher than that found by [23] which ranged between 0.85 and 1.25 m3 s-1.
3.2. Heat transfer coefficient and evaporative cooling efficiency
The heat transfer coefficient by convection (h) is corrected (h') in Eq. 13 as a function of a set factor (F1) which is the difference between the simulated and observed values of h as a function of the air temperature as shown in Eq. (14), r² = 0.8005.
This correction was required because the original equation used to calculate the convective heat transfer coefficient was set to porous plates with spherical materials and expanded clay has an irregular shape approaching spherical, and has a roughened, porous surface.


To determine the independent variable that most influenced the F1 values, we proceeded to the regression analysis based on the maximum coefficient of determination (r2) using the PROC REG of SAS® [24].
After applying the correction factor in heat and mass transfer coefficient, cooling efficiency results improved, whose mean values, observed and simulated, were 74.8 ± 7.4% and 68.3 ± 8.3%, respectively. Fig. 5 shows the behavior of the observed efficiency as a function of time, and it is further observed that in general the simulated values underestimated the real efficiency.

Figure 5: Simulated and observed cooling efficiencies (η, %) over time (a) and (b) plotted against one another as compared to a 45o slope line.
In Fig. 5a, it is observed graphically the behavior of the average of air temperature before crossing the plate and cooling efficiency observed and simulated throughout the day. Little variation was observed in the efficiencies values, more variation occurring at the start of data collection, during which the evaporative cooling system is on and off frequently, staying on for approximately 1-3 minutes, not therefore reaching state balance (Fig. 5b). In turn, the next 16 hours, the system was kept engaged for longer periods, 30 to 120 minutes, providing better equilibrium conditions.
3.3. Model sensitivity
Simulations were performed for prediction of the behavior of Tdb,o, RH,o and η in function of air temperature before crossing the pad (Tdb,i of 25 °C to 45°C), as can been seen in Fig. 6. The dimensions of the evaporative cooling plate were considered to be 11.70 m x 2.00 m x 0.075 m, diameter of the material used to fill the evaporative cooling plate (D) of 10 mm, external relative humidity (RH,i) 45%, atmospheric pressure (Patm) 101.32 kPa, mean air velocity inside the shed (V) 1.2 m s-1, mass flow of air across the pad (ma) 41 kg s-1, water temperature applied to the porous plate (Twater) of 20 °C and the relationship between surface area and volume of the porous material (α) of 170 m2 m-3.

Figure 6: Sensitivity of cooling efficiency (η, oC) to inlet dry bulb temperature (Tdb,i, oC, A), inlet water temperature (Tw,i, oC, B), inlet air relative humidity (RHi, %, C) and expanded clay average diameter (D, mm).
From Fig. 6 the capacity for reducing temperature and variation of RH,o can be seen as Tdb,i increases causing the increase in η. Later, adopting Tdb,i equal to 35 °C, D = 5, 10, 15 and 20 mm, corresponding to values of 157.08 m2 m-3, 78.54 m2 m-3, 52.36 m2 m-3 and 23.56 m2 m-3 respectively, and assuming the values of the other variables described above, the behavior of Tdb,o, RH,o and η were simulated.
As it can be seen in Fig. 6, as the D increases it reduces the cooling capacity of the air RH,o and η (Fig. 6c and 6d). The calculated evaporative cooling efficiency was 54%. This value is in accordance to [25], who found η values of from 43% to 55% for plates with 5 cm thick and velocity ranging from 1.0 to 1.3 m s-1.
3.4. Prediction of evaporative cooling efficiency for future scenarios
It can be observed in Fig. 7, the behavior of the average air temperature (Tdb,i) and (Tdb,o), and the evaporative cooling system efficiency (η) according to average temperature of the period 1961-1990 and the scenarios B2 and A2 for the years of 2050 and 2100.

Figure 7: Behavior of average air temperature before (Tdb,i) and after (Tdb,o) crossing the wetted porous plate (a) and evaporative cooling efficiency (η) due to the variation of the air temperature (Tdb,i) before crossing the wetted porous plate (b) according to the estimated average air temperature for the period of 1961-1990 and according to the B2 and A2 scenarios (IPCC, 2013), for the years 2050 and 2100.
The simulation results for (Tdb,i) and (Tdb,o) are shown in Fig. 7a, which indicates the gradual increase of Tdb,o in time into the greenhouse. The simulations indicate the need of dimensioning the evaporative cooling systems in order to adequate the internal environment of the greenhouse to the plants needs. The simulations results present general tendencies that might be important in the definition of strategies for ventilation projects.
Evaluating predictions of climate changes, it could be observed negative impacts in the agriculture production (Fig. 7b) [26-28]. If no precaution is taken, there might occur the migration of plant production to regions in order to achieve better thermal environment [29]. It can be harmful to the Brazilian economy, once Brazil is one of the countries most susceptible to the impacts of climate changes [30].
4. Conclusions
-
The mathematical model developed is suitable to simulate the PAD cooling systems, allowing the simulation of different system configurations, and may thus be used as a tool in the decision making process during the phase of design and dimensioning of evaporative cooling systems of the wetted porous plate type built with expanded clay;
-
With the variation of the diameter of the expanded clay filler used in the evaporative cooling plate, it was detected reduction of the capacity and efficiency of air cooling; and
-
The increase in the air temperature predicted in future scenarios can affect negatively the plant production in greenhouses from Minas Gerais state, especially during the warmest period in the year.
Acknowledgements
The authors thank the CAPES, CNPq and FAPEMIG for their financial support of the project.
References
Referencias
Intergovernmental Panel on Climate Change – IPCC, Climate Change 2013: The physical science basis, contribution of working group I to the fifth assessment, Report of the Intergovernmental Panel on Climate Change, edited by T.F. Stocker et al., Cambridge University Press, Cambridge, U.K.
Soni, P., Salokhe, V.M. and Tantau, H.J., Effect of screen mesh size on vertical temperature distribution in naturally ventilated greenhouses tropical. Biosystems Engineering, 92(4), pp.469-482, 2005. DOI: 10.1016/j.biosystemseng.2005.08.005
Duarte, L.A., Schoffel, E.R., Mendez, M.E. and Schallenberger, E., Changes in temperature of the air through the screens on the sides planted with tomato greenhouses. Journal of Agricultural and Environmental Engineering, 15(2), pp.148-153, 2011.
Voltan, D.S., Barbosa, R.Z. and Martins, J., Spatial variability of relative humidity inside a greenhouse in tropical climate. Journal of Agricultural Sciences, 9(2), pp.251-257, 2014.
Tinôco, I.F.F., Effect of different environment conditioning systems, and metabolizable energy levels in the diet on performance of broiler headquarters in summer and autumn conditions, PhD Thesis, Department of Agricultural Engineer, Universidade Federal de Minas Geris, Belo Horizonte, Brazil,1996.
Camargo, J.R., Ebinuma, C,D. and Cardoso, S.A., Mathematical model for direct evaporative cooling air conditioning system. Thermal Engineering, 2(2), pp.30-34, 2003. DOI: 10.5380/ret.v2i2.3473
Justino, E., Nääs, I.A., Carvalho, T.M.R. and Salgado, D.A., Efeito do resfriamento evaporativo e do balanço eletrolítico sobre a lactação de porcas em condições de verão tropical. Arq. Bras. Med. Vet. Zootec. 67(2), pp.455-464, 2015.
Medeiros, J.M., Lopes, B.S.O., Freire, J.M.S., Silva, J.P.L., Viana, F.C.A., Silva, M.G. and Braga, A.H.G., Analysis of a prototype of adsorptive evaporative air conditioner for hot and humid weather. Scientific Journal Principia-Disclosure and Technological, 1(26), pp. 27-41, 2015.
Ahmed, I.N., Abaas, O., Ahmed, M. and Ismail, M.R., Performance evaluation of three different types of location evaporative cooling pads in greenhouses in Sudan. Saudi Journal of Biological Sciences, 18(1), pp.45-51, 2011. DOI: 10.1016/j.sjbs.2010.09.005
Kouchakzadeh, A. and Brati, A., The evaluation of the bulk charcoal greenhouse evaporative cooling pad. Agricultural Engineering International: CIGR Journal, 15(2), pp. 188-193, 2013.
Chen, J., Cai, Y., Xu, F., Hu, H. and Oh, Q., Analysis and optimization of the fan-pad evaporative cooling system for greenhouse based on CFD. Advances in Mechanical Engineering, 1(8), pp. 1-8, 2014. DOI: 10.1155/2014/712740
Franco, A., Valera, D.L., Pena, A. and Pérez, A.M., Aerodynamic analysis and CFD simulation of evaporative cooling pads several cellulose used in Mediterranean greenhouses. Computers and Electronics in Agriculture, 76(2), pp.218-230, 2011. DOI: 10.1016/j.compag.2011.01.019
Montazeria, H., Blockena, B. and Hensena, J.L.M., Evaporative cooling by water spray systems: CFD simulation, experimental validation and sensitivity analysis. Building and Environment, 83(1), pp. 129-141, 2015. DOI: 10.1016/j.buildenv.2014.03.022
ASHRAE. Evaporative air cooling. Chapter 19. In: HVAC Systems and Equipment Handdbook. Atlanta, Ga: American Society of Heating, Refrigerating, and Air-Conditioning Engineers, Inc. 1992.
Yanagi Jr, T., Carvalho, V.C., Yanagi, S.N.M. and Damasceno, F.A, Cooling efficiency of evaporative Modeling in wetted porous plates
systems. Proceedings of XXXV Brazilian Congress Agricultural Engineering, 2006. pp. 1-9.
Wilhelm, L.R., Numerical calculation of psychrometric properties in SI units. Transactions of the ASAE, St. Joseph, 19(2), pp. 318-321, 1976.
Moreira, S.M.C., Chaves, M.A. and Oliveira, L.M., Net efficiency of comparison in the determination of the bulk density of agricultural grains. Journal of Storage, 9(1), pp. 22-24, 1985.
Araujo, A.G., Estimation and classification of soil compaction due to agricultural machine traffic through the nebula modeling. PhD Thesis, Universidade de São Paulo, Sao Paulo, Brazil, 2004.
Brasil. Ministério da Agricultura e Reforma Agrária. Departamento Nacional de Meteorologia. Normais Climatológicas (1961-1990). Brasília: SPI/EMBRAPA, 1992.
Silva, C.E., Comparison of evaporative panels of expanded clay and cellulose for adiabatic cooling systems of air in poultry houses with negative pressure in tunnel model. MSc. Thesis, Universidade Federal de Viçosa, Brazil, 2002.
Rosa, J.F.V., Tinôco, I.F.F., Fernandes, C.M. and Zolnier, S., Dimensionamento de painéis porosos para condicionamento do ar em ambientes climatizados. Engenharia na agricultura, 20(5), pp. 404-411, 2012.
Peixoto, R.A.F., Tinôco, I.F.F., Gates, R.S., Moura, S.A.L. and Souza, C.F., Performance of different types of applied materials to coverings of facilities for animal production - Simulation. Proceedings of ASAE International Meeting, 2003. pp. 1-9.
Wiersma, F. and Short, T.H., Evaporative cooling. Proceedings of ASAE International Meeting, Ventilation of agricultural structures. 1983.
SAS. User's guide (Realese 8.2) Cary, NC, Statistical Analysis Institute Inc, 2001.
Borges, G., Yanagi Junior, T., Carvalho, L.G., Damasceno, F.A. and Yanagi, S.N.M., Climate changes influence on inside thermal environment of broiler houses. Proceedings of International Conference of Agricultural Engineering. 2008. pp. 1-37.
Nääs, I.A., Romanini, C.E.B., Salgado, D.A., Lima, K.A.O., Vale, M.M., Labigalini, M.R., Souza, S.R.L., Menezes, A.G. and Moura, D.J., Impact of global warming on beef cattle production cost in Brazil. Scientia Agricola, 67(1), pp.1-8, 2010. DOI: 10.1590/S0103-90162010000100001
Silva, T.G.F., Moura, M.S.B., Sá, I.I.S., Zolnier, S., Turco, S.H.N. and Souza, L.S.B., Cenários de mudanças climáticas e seus impactos na produção leiteira em estados nordestinos. Revista Brasileira de Engenharia Agrícola e Ambiental, 14(8), pp.863-870, 2010. DOI: 10.1590/S1415-43662010000800011.
Gomes, R.C.C., Yanagi Junior, T., Lima, R.R, Yanagi, S. de N.M., Carvalho, V.F. and Damasceno, F.A., Predição do índice de temperatura do globo negro e umidade e do impacto das variações climáticas em galpões avícolas climatizados. Ciência Rural, 41(9), pp. 1645-1651, 2011.
Ghini, R., Hamada, E. and Bettiol, W., Impacto das mudanças climaticas sobre as doencas de importantes culturas no Brasil [em Línea], Embrapa Meio Ambiente, Jaguariuna, 2011 [Consulta, 2/3 de agosto de 2016]. Available at: http://biblioteca.universia.net/html_bura/ficha/params/title/impactos-das-mudan%C3%A7as-climaticas-doen%C3%A7as-importantes-culturas-brasil/id/55558063.html
Fearnside, P.M., Tropical forests of amazonia in schneider. Climate Changes Science and Politicy: Island Press, 2009.
Cómo citar
IEEE
ACM
ACS
APA
ABNT
Chicago
Harvard
MLA
Turabian
Vancouver
Descargar cita
CrossRef Cited-by
1. Ibtissam El Aouni, Hicham Labrim, Elhoussaine Ouabida, Ahmed Ait Errouhi, Rachid El Bouayadi, Driss Zejli, Aouatif Saad. (2024). Performance Evaluation of an Evaporative Cooling Pad for Humidification -Dehumidification Desalination. Fluid Dynamics & Materials Processing, 20(10), p.2323. https://doi.org/10.32604/fdmp.2024.050611.
Dimensions
PlumX
Visitas a la página del resumen del artículo
Descargas
Licencia
Derechos de autor 2017 DYNA

Esta obra está bajo una licencia internacional Creative Commons Atribución-NoComercial-SinDerivadas 4.0.
El autor o autores de un artículo aceptado para publicación en cualquiera de las revistas editadas por la facultad de Minas cederán la totalidad de los derechos patrimoniales a la Universidad Nacional de Colombia de manera gratuita, dentro de los cuáles se incluyen: el derecho a editar, publicar, reproducir y distribuir tanto en medios impresos como digitales, además de incluir en artículo en índices internacionales y/o bases de datos, de igual manera, se faculta a la editorial para utilizar las imágenes, tablas y/o cualquier material gráfico presentado en el artículo para el diseño de carátulas o posters de la misma revista.


