Published
Genotype by environment interaction and yield stability in sugarcane
Interacción genotipo x ambiente y estabilidad del rendimiento en caña de azúcar
DOI:
https://doi.org/10.15446/rfna.v70n2.61790Keywords:
g x e interaction, phenotypic stability, rank correlation, Saccharum spp hybrid (en)Interacción G x A, Estabilidad fenotípica, Correlación de rango, Saccharum spp., Híbrido (es)
Genotype by environment interaction (GEI) reduces the association between phenotype and genotype which result in relative ranking and stability differences of genotypes across environment. The objectives of this research were (i) to select sugarcane genotypes of high yield and stable (ii) to study the interrelationships among various parametric and no parametric stability statistics. Seventeen experimental genotypes and three check cultivars of sugarcane were evaluated at seven environment using randomized completely block design. Methodologies based on analysis parametric (Regression-bi-S2di, Shukla variance, Ecovalence-W, Coefficient of variation-CV, index of Lin and Binns-PI and AMMI value) and non-parametric statistics (Nassar and Huehn- Si(1), Si(2), Si(3), Si(6), Kang-RS, Fox-TOP, and Thennarasu- NPi(1) , NPi(2), NPi(3), NPi(4)) were used for Ton of Pol per hectare (TPH). Genotypes and environment showed high significant difference (P<0.01) while GEI was significant (P<0.05). The parametric stability analysis identified the genotypes V99-236 and V00-50 as the most stable and high TPH. With non-parametric statistics were identified the genotypes V00-50, V99-236 and V98-120 as most stable. The analysis distinguished two groups of statistics using biplot: the first group (G1) formed by PI, CV, ASV, TOP, Si(3), Si(6), NPi(2), NPi(3) and NPi(4) statistics were located under the concept of dynamic stability since they are associated with TPH. The other group (G2), formed by Shukla, W, S2di, bi, RS, Si(2), Si(1), NPi(1) statistics, fell within the static concept. Finally, genotypes V99-236 and V00-50 can be recommended as the most stable genotype in terms of both, stability and TPH.
La interacción genotipo por ambiente (GEI) reduce la asociación entre el fenotipo y el genotipo lo cual genera cambios en el orden y en la estabilidad de genotipos a través de ambientes. Los objetivos de esta investigación fueron: (i) seleccionar genotipos de caña de azúcar de alto rendimiento y estables (ii) evaluar las interrelaciones entre diversos métodos de estabilidad paramétrica y no paramétrica. Diecisiete genotipos experimentales y tres cultivares testigos de caña de azúcar fueron evaluados en siete ambientes utilizando un diseño de bloques completamente aleatorizado. Metodologías basadas en el análisis estadístico paramétrico (Regression-bi-S2di, varianza de Shukla, Ecovalence-W, Coeficiente de variación-CV, índice de Lin y Binns-PI y AMMI) y no paramétrico (Nassar and Huehn- Si(1), Si(2), Si(3), Si(6), Kang-RS, Fox-TOP, and Thennarasu- NPi(1), NPi(2), NPi(3), NPi(4)) fueron usadas para evaluar el rendimiento en toneladas de Pol por Hectárea (TPH). Los genotipos y el ambiente mostraron diferencias estadísticamente significativas (P <0,01), mientras que la GEI fue significativo (P<0.05). Los estadísticos de estabilidad paramétricas identificaron los genotipos V99-236 y V00-50 como los más estables y de alto TPH y los no paramétricos distinguieron a los genotipos V00-50, V99-236 y V98-120. El biplot identifico dos grupos de estadísticos: El primer grupo formado por los estadísticos PI, CV, ASV, TOP, Si(3), Si(6), NPi(2), NPi(3), y NPi(4)) que se situaron bajo el concepto de estabilidad dinámica, ya que están asociados con TPH. El otro grupo (G2), formado por los estadísticos Shukla, W, S2di, bi, RS, Si(2), Si(1), NPi(1) caen dentro del concepto estabilidad estática. Finalmente, los genotipos V99-236 y V00-50 pueden ser recomendados como los más estables y de alto TPH.
Recibido: 28 de diciembre de 2016; Aceptado: 4 de abril de 2017
ABSTRACT
Genotype by environment interaction (GEI) reduces the association between phenotype and genotype which result in relative ranking and stability differences of genotypes across environment. The objectives of this research were (i) to select sugarcane genotypes of high yield and stable (ii) to study the interrelationships among various parametric and no parametric stability statistics. Seventeen experimental genotypes and three check cultivars of sugarcane were evaluated at seven environment using randomized completely block design. Methodologies based on analysis parametric (Regression-bi-S2di, Shukla variance, Ecovalence-W, Coefficient of variation-CV, index of Lin and Binns-PI and AMMI value) and non-parametric statistics (Nassar and Huehn- Si(1), Si(2), Si(3), Si(6), Kang-RS, Fox-TOP, and Thennarasu- NPi(1) , NPi(2), NPi(3), NPi(4)) were used for Ton of Pol per hectare (TPH). Genotypes and environment showed high significant difference (P<0.01) while GEI was significant (P<0.05). The parametric stability analysis identified the genotypes V99-236 and V00-50 as the most stable and high TPH. With non-parametric statistics were identified the genotypes V00-50, V99-236 and V98-120 as most stable. The analysis distinguished two groups of statistics using biplot: the first group (G1) formed by PI, CV, ASV, TOP, Si(3), Si(6), NPi(2), NPi(3) and NPi(4) statistics were located under the concept of dynamic stability since they are associated with TPH. The other group (G2), formed by Shukla, W, S2di, bi, RS, Si(2), Si(1), NPi(1) statistics, fell within the static concept. Finally, genotypes V99-236 and V00-50 can be recommended as the most stable genotype in terms of both stability andTPH.
Keywords:
G x E interaction, Phenotypic stability, Rank correlation, Saccharum spp., Hybrid.RESUMEN
La interacción genotipo por ambiente (GEI) reduce la asociación entre el fenotipo y el genotipo lo cual genera cambios en el orden y en la estabilidad de genotipos a través de ambientes. Los objetivos de esta investigación fueron: (i) seleccionar genotipos de caña de azúcar de alto rendimiento y estables (ii) evaluar las interrelaciones entre diversos métodos de estabilidad paramétrica y no paramétrica. Diecisiete genotipos experimentales y tres cultivares testigos de caña de azúcar fueron evaluados en siete ambientes utilizando un diseño de bloques completamente aleatorizado. Metodologías basadas en el análisis estadístico paramétrico (Regression-bi-S2di, varianza de Shukla, Ecovalence-W, Coeficiente de variación-CV, índice de Lin y Binns-PI y AMMI) y no paramétrico (Nassar and Huehn- Si(1), Si(2), Si(3), Si(6), Kang-RS, Fox-TOP, and Thennarasu- NPi(1), NPi(2), NPi(3), NPi(4)) fueron usadas para evaluar el rendimiento en toneladas de Pol por Hectárea (TPH). Los genotipos y el ambiente mostraron diferencias estadísticamente significativa (P <0,01), mientras que la GEI fue significativo (P<0.05). Los estadísticos de estabilidad paramétricas identificaron los genotipos V99-236 y V00-50 como los más estables y de alto TPH y los no paramétricos distinguieron a los genotipos V00-50, V99-236 y V98-120. El biplot identifico dos grupos de estadísticos: El primer grupo formado por los estadísticos PI, CV, ASV, TOP, Si(3), Si(6), NPi(2), NPi(3), y NPi(4)) que se situaron bajo el concepto de estabilidad dinámica, ya que están asociados con TPH. El otro grupo (G2), formado por los estadísticos Shukla, W, S2di, bi, RS, Si(2), Si(1), NPi(1) caen dentro del concepto estabilidad estática. Finalmente, los genotipos V99-236 y V00-50 pueden ser recomendados como los más estables y de alto TPH.
Palabras clave:
Interacción G x A, Estabilidad fenotípica, Correlación de rango, Saccharum spp., Híbrido.Genotype by environment interaction (GEI) is a relevant consideration for plant breeders. Sugarcane breeders usually assess a group of genotypes through environments prior to the release of a new crop for farmers' production (Rea and De Sousa-Vieira, 2002). The GEI causes the best genotype to change with the environment, and makes the selection process difficult for a particular region (Farshadfar et al., 2012). Most breeders have used the term ‘stability’ to describe a genotype which exhibits a relatively constant yield, independent of environmental conditions. This concept of stability is in accordance with the concept of homeostasis extensively used in quantitative genetics (Becker and Leon, 1988) and may be regarded as a ‘biological’ or ‘static’ concept of stability. A genotype showing an unchanging performance in all environments does not certainly respond to improved growing conditions with increased yield. Agronomists, hence, would prefer an ‘agronomic’ or ‘dynamic’ concept of stability in which it is not indispensable that the genotypic response to environmental conditions should be identical for all genotypes (Becker and Leon, 1988).
Diverse methods have been proposed to estimate GEI or yield stability. These methods can be separated into two main groups including parametric (univariate and multivariate) and non-parametric approaches based on different strategies (Dehghani et al., 2008). Univariate parametric methods have been used, such as those of Eberhart and Russell (1969), Shukla (1972) and Francis and Kannenberg (1978). These methods demand few computation and their parameters are easy to interpret biologically.
Diverse nonparametric methods have been used to describe and explain the responses of GEI (Nassar and Huehn, 1987; Kang, 1988; Fox et al., 1990; Thennarasu, 1995). In this approach, no suppositions about the observations are required and there is less susceptible to measurement errors or to outliers (Huehn, 1990; Balalić et al., 2011; Temesgen et al., 2015; Scampin et al., 2000; Rea et al., 2015).
Multivariate methods such as the additive main effects and multiplicative interaction (AMMI) model has been proposed as effective methodology to predict adaptation and stability of cultivars (Guerra et al., 2009). Purchase et al. (2000) generated the AMMI stability value (ASV) based on the AMMI model and using principal component scores (axes 1 and 2) for each genotype.
Mixed model methods also can be used to estimate GEI effects when analyzing multilocation yield trial data. If locations are random representatives of environments in the target region, the mixed model procedure stipulates best linear unbiased predictors (BLUP) of random effects. The BLUP of random effects is suitable for detecting location specific effects and estimating genotype by location interaction effects (Coutiño-Estrada and Vidal-Martínez, 2003).
The objectives of this research were (i) to select sugarcane cultivars of high cane yield (TPH) and stable through different environments in Venezuela (ii) to study the interrelationships among various parametric and no parametric phenotypic stability statistics.
MATERIAL AND METHODS
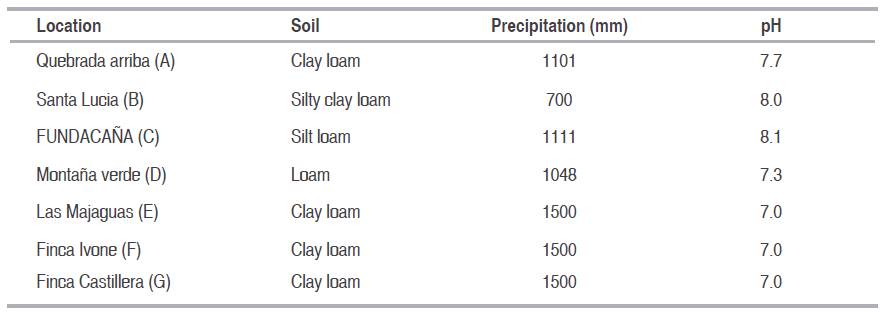
Seventeen experimental genotypes and three commercial check cultivars of sugarcane were evaluated at seven environment using randomized completely block design with three replications in the Central-Western region of Venezuela. The experimental sugarcane genotypes were: V91-1, V91-2, V91-6, V91-8, V91-15, V98-62, V98-86, V98-120, V99-117, V99-190, V99-203, V99-208, V99-213, V99-217, V99-236, V99-245 and V00-50. The check cultivars evaluated were B80-408, C323-68, and CP74-2005. All materials were evaluated at seven locations (Carora and Montaña Verde in Lara State; The Majaguas, Farm Ivonne and Farm Castillera in Portuguesa State; Santa Lucia and FUNDACANA in Yaracuy State), each with three crop-years (plant crop, first and second ratoon) during 2008-2010. Some environmental conditions of the seven experimental sites of Venezuela can be seen in Table 1. The attribute evaluated was cane yield expressed in tons of pol per hectare (TPH). The plots were three rows, with 1.5 m between rows and 10 m long. Plots were managed conventionally and followed the established local practices. All three rows were harvested for measuring cane yield (TCH). The cane was incinerated and then chopped by hand. A 10-stalk sample was randomly taken from each plot and weighed. The samples were milled and the crusher juice was analysed for sucrose content (Pol % cane). Tons of pol per hectare (TPH=t pol ha-1) was estimated as related to tons of cane per hectare (TCH) and Pol % cane by the coming formula: TPH = (TCH x Pol % cane)/100 (Guerra et al., 2009).
Table 1: Principal soil and precipitation characteristics of the appraised locations
Analysis of variance . The analysis of variance was executed contemplating the genotype and environment effects as fixed, according to the mathematics model: Yijk = µ + B/Ejk + Gi + Ej + GEij + εijk, where Yijk represents the ith genotype within the jth environment and the kth block, µ is the general mean, B/Ejk corresponds to the block within the jth environment in the kth block, Gi is the effect of the ith genotype, Ej is the effect of the jth environment, GEij is the effect of interaction of the ith genotype with the jth environment, and εijk is the effect of experimental error. The GEI was divided as stated by the additive main effect and multiplicative interaction (AMMI) models (Crossa, 1990). Data were combined over locations and analysed as combined series of RCB's with repeated measures (crop-year) using InfoStat software (Balzarini et al., 2008).
Stability analysis. Stability of the 20 genotypes for TPH was calculated by using the coefficient of regression (b), mean squared deviations from regression (S2di), ecovalence stability index (W),) Shukla’s stability variance (Shukla), Linn and Binn Index (Pi), the coefficient of variation (CV) and AMMI stability value (ASV). Several nonparametric stability statistics suggested by Nassar and Huehn (1987); Kang (1988); Fox et al. (1990) and Thennarasu (1995) were estimated.
The statistics based on yield ranks of genotypes (Nassar and Huehn, 1987) in each environment are expressed as follows: Si(1) calculates the average of the absolute differences in the orders of a genotype in all environments, Si(2) is the variance between the ranks in all environments, Si(3) and Si(6) are the sum of the absolute deviation and sum of squares of ranks for each genotype relative to the average of the ranks, respectively (Rea et al., 2015) .
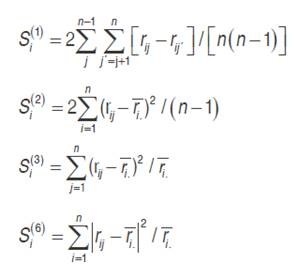
Where  is the rank of the ith genotype in the jth environment, and
  is the mean rank across all environments for the ith genotype.
Thennarasu’s (1995) nonparametric stability analysis considers adjusted ranks of genotypes within each test environment.

The adjusted rank  is calculated on the basis of the adjusted phenotype values
 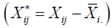 where
where  is the mean performance of the ith genotype. The ranks, obtained from these adjusted values
  , depend only on GEI and error effects;
  is the rank
  ,
,  and
and  are the mean and median ranks for adjusted values, while
  and
and  are the same parameters computed from the original (unadjusted) values.
Fox et al. (1990) suggested a non-parametric superiority procedure for general adaptability using stratified ranking of cultivars. A genotype that appeared mostly in the top third (high TOP-value) was judged a widely adapted cultivar. Kang’s (1988) rank-sum (RS) is another non-parametric stability procedure where both yield and Shukla’s (1972) stability variance were used as selection criteria. In this method, both the highest yielding genotype and the genotype with the lowest stability variance are ranked 1 and the genotype with the lowest RS value is judged the most desirable (Farshadfar et al., 2012; Rea et al., 2015).
Additionally, Spearman correlation coefficients among stability parameters and principal component analyses (PCA) based on the correlation matrix were executed to achieve an understanding of the association among stability parameter. All of the analyses were effectuated using InfoStat software (Balzarini et al., 2008) and Agricolae program (De Mendiburu, 2015) which was originated in R software (CRAN).
RESULTS AND DISCUSSION
Analysis of GE interaction
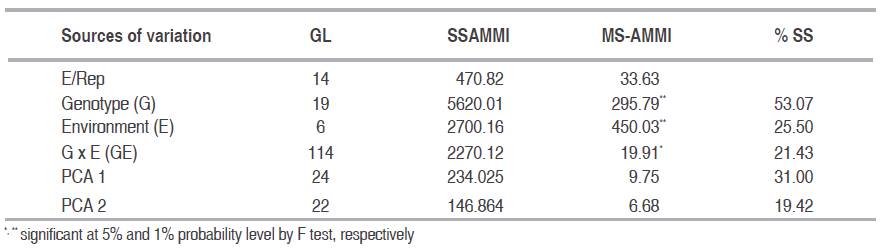
Plant breeders inevitably face GEI once testing varieties across a number of environments. Reckoning on the magnitude of the interactions or the differential genotypic responses to environment, the varietal rankings can dissent greatly across environment (Dehghani et al., 2008; Crossa, 1990). Bartlett's homogeneity test evidenced that the mean squares of individual environments were unvarying and so the combine analysis of variance was performed. The combined analysis of variance (ANOVA) for TPH is shown in Table 2. Genotypes and environment showed high significant difference (P<0.01) while GEI was significant (P<0.05) indicating rank difference in genotypes response at different environments and the need for extension of stability analysis.
Table 2: AMMI analysis for TPH (t pol ha-1) of twenty sugarcane genotypes in seven environments.
The mean TPH across environments over three years (Table 3) showed considerable changes in ranks among the genotypes, reflective the presence of high GE interactions (Rea et al., 2015). These results show that the heterogeneousness of the environments and genetic variability of the genotypes becomes manifest. The environment mean yield ranged from 13.12 TPH in Santa Lucia to 17.56 TPH in Montaña Verde indicating differences among test environments. The highest yield 23.27 TPH was obtained from genotype V98-120 at Montaña Verde, while the lowest was 8.26 TPH from genotype V91-6 at Santa Lucia. The results of the non-parametric and parametric statistics and their ranks are presented in Table 4 and 5, respectively.
Table 3: Mean yield (TPH) of twenty sugarcane genotypes tested across crops in seven environments.

Table 4: Mean yield values (TPH) and stability parameters of twenty sugarcane genotypes across seven environments.

Table 5: Ranks of twenty genotypes across environments using stability statistics

Univariate stability. In Table 4 is presented the mean yield values (TPH) and stability parameters. Finlay and Wilkinson (1963) and Eberhart and Russell (1966) considered genotypes with high mean yield, coefficients of regression equivalent to unity (bi= 1) and deviation from regression proximate zero (S2di=0) to be stable. According to these parameters only V99-236 and V00-50 genotypes meet these conditions. Francis and Kannenberg (1978) defined a stable genotype as one that provides high yield and constant performance across locations. In conformity with this definition, V99-236, V99-190, V99-213, V98-62 and V98-120 are considered stable since that presented low CV and high TPH. Rea and De Sousa-Vieira (2002) used this method and concluded that the CV could be used to identify genotypes on a group basis rather than individually; however, the method can also be used in a plant-breeding context. In the method of Lin and Binns (1988) the best genotype is considered to be the one with the greatest performance and the lowest value of Pi. Here, we found that genotypes V99-236, V00-50, V98-120, V98-62, and V99-208 showed lower Pi values, indicating greater adaptability to these environments. Wricke (1962) recommended using ecovalance (W) as a stability parameter. Genotypes with the smallest ecovalance (W) values are contemplated stable. The W was lowest for genotypes CP74-2005, V00-50 and V99-236. Shukla (1972) defined a stability variance value, which considered a genotype with relatively large variance to have low stability. By Shukla's definition, genotypes CP74-2005, V00-50 and V99-236 ranked the most highly stables. Considering all methods of univariate stability can conclude that genotypes V99-236 and V00-50 were the most stable and high yields.
Multivariate stability. The AMMI model does not make specification for a quantitative stability measure, and as such a measure is important in order to quantify and sort genotypes in terms of yield stability. Hence, AMMI stability value (ASV) suggested by Purchase et al (2000) was applied to quantify and rank genotypes according to their yield stability. The genotype with the lowest ASV value is taken as most stable. Consequently, genotypes V99-236, CP74-2005 and B80-408 were the most stable (Table 4).
Non parametric stability. The results of 10 nonparametric stability measures and genotypes mean yield are resumed in Table 4. The Si(1) and Si(2) statistics are based on ranks of genotypes across locations and they give proportional weight to each environment. Genotypes with less modification in rank are considered to be more stable. According to both Si (1) and Si (2) V99-236 and V00-50 had the smallest changes in ranks and are thus considered as the most stable genotypes. Two other non-parametric statistics, Si (3) and Si (6), integrate yield and stability based on yield orders of genotypes in each environment (Nassar and Huehn, 1987). The lowest value for each of these statistics reveals maximal stability for a certain genotype. Genotypes V99-236, V00-50, V98-120, V99-208, V99-213 had the lowest Si (3) and Si (6) values hence, these genotypes were identified as the most stable genotypes.
Results for Thennarasu's (1995) non-parametric stability statistics, estimate from ranks of adjusted yield means, are showed in Table 4. The ranks of genotypes based on these statistics are presented in Table 5. According to NPi(1), genotypes CP74-2005, V00-50, V98-120 were stable in analogy with the other genotypes. Genotypes V00-50, V99-236, V98-120, V99-236 had the lowest value of NPi(2) and were judged stable. NPi(3) and NPi(4) also recognized genotypes V00-50, V99-236 and V98-120 how the most stable genotypes and high mean yield.
Kang's (1988) non-parametric stability statistic (RS) applies both yield and stability variance (Shukla, 1972) with the genotype having the lowest rank-sum being the most promising. In this case, the genotypes V00-50, V99-236, V99-213, and CP74-2005 had the lowest values, and were stable genotypes with high yield in comparison with other genotypes. Non-parametric (TOP) superiority measure (Fox et al., 1990) identified genotypes V99-236, V98-62, V00-50 and V99-208 presented mainly in the top third, thus, these genotypes were stable. Similarly, Segherloo et al. (2008) found a highly significant association between mean yield and Fox-rank.
Correlation between mean yield (TPH) and stability statistics
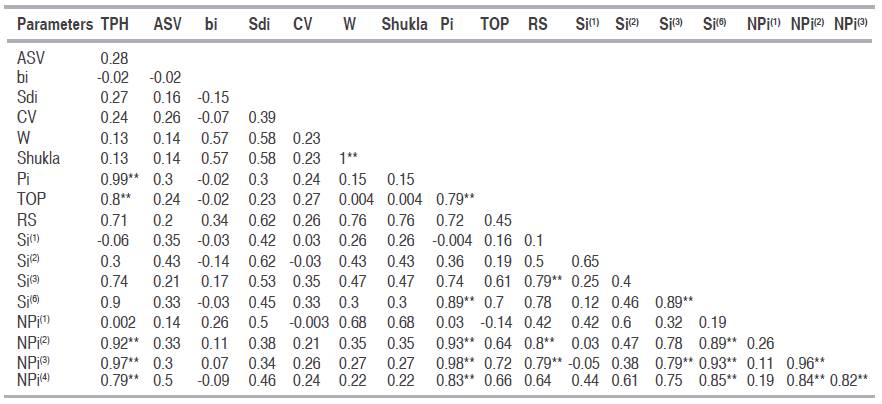
The Spearman’s rank correlations between each combination of stability measures were estimated (Table 6) and demonstrated a high positive significant rank correlation between TPH and PI, TOP, NPi(2), NPi(3), and NPi(4). The parameters NPi(2), NPi(3) and NPi(4) were associated positive with Si(6) and Si(3) with Si(6), RS, and NPi(2). Therefore, only one of these parameters would be adequate to select stable genotypes in a breeding program (Mohammadi et al., 2007). Complete correlation was found between Wricke’s and Shukla’s statistics. Kang et al. (1987) indicated that Wricke's ecovalance (W) and stability variance (Shukla) were equal; because Shukla's stability variance is a linear combination of the ecovalence so for ranking purposes these methods are equivalent (Bujak et al., 2014). To better comprehend the interrelationships among the parametric and non-parametric statistics, principal component analysis, based on the correlation matrix of rank (Table 5) was used. The first and second principal components of the rank correlation accounted for 48.10% and 18.80% of the variation, respectively, making a total of 66.90% of the original variance among the stability parameters (Figure 1). Similar results have been reported from other studies in faba bean and field pea (Flores et al., 1998), durum wheat (Kilic et al., 2010), barley (Mut et al., 2010) and sugarcane (Rea et al., 2015). Results of the biplot of the first two principal components based on the rank correlation matrix were more or less consistent with the Spearman rank correlation coefficients (Figure 1, Table 6). The stability parameters were separated into two stability concepts: Group 1, parameters that corresponded with the dynamic/agronomic stability concept which were associated to mean yield (TPH) such as PI, TOP, NPi(3), Si(6), NPi(2), NPi(4), Si(3), CV and ASV. Group 2, the remaining stability parameters corresponding with the static/ biological stability concept were assigned to RS, Si(2), Si(1), (S2di), bi, Shukla, W, NPi(1) (Figure 1). These parameters, which identify genotypes with high phenotypic stability without due consideration of mean yield, may not be appropriate, as both breeders and farmers incline toward to select genotypes of good yield with perform regularity across environments (Mohammadi and Amri, 2008; Farshadfar et al., 2012; Khalili and Pour-Aboughadareh, 2016).
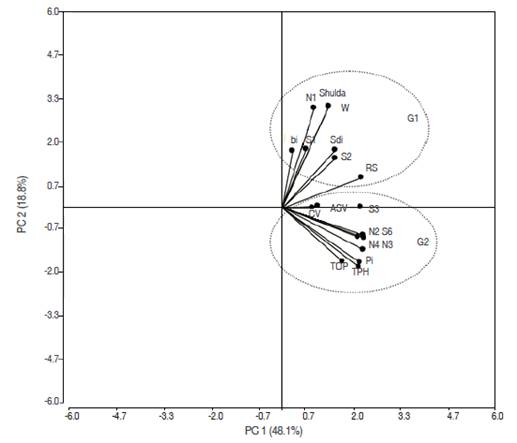
Figure 1: Biplot of IPC1 and IPC2 of the rank correlation matrix of the 17 stability parameters with mean yield (TPH).
Table 6: Spearman correlation of stability parameters and TPH in twenty sugarcane genotypes at seven environments.
CONCLUSIONS
Various stability statistics were used in this research for quantifying genotype stability in relation to yield. Both yield and stability should be examined simultaneously to deal the effect of GEI and to accomplish genotype selection more accurate and refined. Several methods have been considered to analyze phenotypic stability although some of them have their limitations and there is no superior method to be recommended in all circumstances. Besides, some methodologies are optional while others are complementary, being able to be used combined. It is also recommendable to use the parametric and non-parametric stability measures jointly since results obtained from the two groups of stability measures can complement each other. Also, to capitalize on the GEI and to select breeding materials adapted to favourable and unfavourable growing conditions, selection of specific cultivars adapted to specific environments appears to be necessary. Finally, both parametric and non-parametric estimates of stability indicated either V99-936 or V00-50 as the genotype most stable and high yield.
ACKNOWLEDGEMENTS
The research was supported by the Instituto Nacional de InvestigacionesAgrícolas (INIA, Yaracuy).
REFERENCES
References
Balalic I, Zoric M, Miklic V, Dusanic N, Terzic S and Radic V. 2011. Non-parametric stability analysis of sunflower oil yield trials. Helia 34 (54): 67-78. doi: 10.2298/hel1154067b
Balzarini MG, Gonzalez L, Tablada M, Casanoves F, Di Rienzo JA, Robledo CW. 2008. Infostat. Manual del Usuario, Editorial Brujas, Córdoba, Argentina.
Bujak H, Nowosad K and Warzecha R. 2014. Evaluation of maize hybrids stability using parametric and nonparametric methods. Maydica 59:170-175.
Crossa, J. 1990. Statistical Analysis of Multilocation Trials. Adv. Agron. 44: 55-85. http://dx.doi.org/10.1016/S0065-2113(08)60818-4
Dehghani H, Sabaghpour SH and Sabaghnia N. 2008. Genotype×environment interaction for grain yield of some lentil genotypes and relationship among univariate stability statistics. Span. J. Agric. Res. 6: 385-394. doi: 10.5424/sjar/2008063-5292
De Mendiburu F. 2015 Agricolae: Statistical procedures for agricultural research. R package version 1.2-2. http://CRAN.R-project.org/package=agricolae
Eberhart SA and Russel WA.1966. Stability parameters for comparing varieties. Crop Sci 6: 36-40.
doi:10.2135/cropsci1966.0011183X000600010011x
Farshadfar E, Sabaghpour SH and Zali H. 2012. Comparison of parametric and non-parametric stability statistics for selecting stable chickpea (Cicer arietinum L.) genotypes under diverse environments. AJCS 6 (3): 514–524.
Finlay KW and Wilkinson GN.1963. The analysis of adaptation in a plant-breeding programs. AJARs 14: 742-754. doi: 10.1071/AR9630742
Flores F, Moreno MT and Cubero JI. 1998. A comparison of univariate and multivariate methods to analyze environments. Field Crop Res 56:271-286. doi:10.1016/s0378-4290(97)00095-6
Francis TR and Kannenberg LW.1978. Yield stability studies in short-season maize. 1. A descriptive method for grouping genotypes. CJPS 58: 1029-1034. doi: 10.4141/cjps78-157
Fox PN, Skovmand B, Thompson BK, Braun HJ and Cormier R.1990.Yield and adaptation of hexaploid spring triticale. Euphytica 47: 57- 64. doi: 10.1007/bf00040364
Guerra EP, Oliveira RA de, Daros E, Zambon JLC, Ido OT and Bespalhok Filho JC. 2009. Stability and adaptability of early maturing sugarcane clones by AMMI analysis. Crop Breeding and Applied Biotechnology 9:260-267. doi: 10.12702/1984-7033.v09n03a08
Huehn M.1990b. Non-parametric measures of phenotypic stability: Part II. Applications. Euphytica 47: 195-201. doi: 10.1007/bf00024242
Kang MS. 1988. A rank sum method for selecting high yielding and stable crop genotypes. Cereal Res Commun 16: 113-115
Kang MS, Miller JD, Darrah LL.1987. A note on relationship between stability variance and ecovalence. J Heredity 78:107.
Khalili M and Pour-Aboughadareh A. 2016. Parametric and non-parametric measures for evaluating yield stability and adaptability in barley doubled haploid lines. J. Agr. Sci. Tech. 18: 789-803.
Kilic H, Mevlut A and Husnu A. 2010. Assessment of parametric and nonparametric methods for selecting stable and adapted durum wheat genotypes in multi-environments. Not. Bot.HortiAgrobo.38:271–279. doi: http://dx.doi.org/10.15835/nbha3834742
Lin CS and Binns MR.1988. A superiority measure of cultivar performance for cultivar x location data. CJPS 68: 193-198.
Mohammadi R and Amri A. 2008. Comparison of parametric and non-parametric methods for selecting stable and adapted durum wheat genotypes in variable environments. Euphytica 159: 419-432. doi: 10.1007/s10681-007-9600-6
Mohammadi R, Abdulahi A, Haghparast R and Armion M. 2007. Interpreting Genotype×Environment Interactions for Durum Wheat Grain Yields Using Nonparametric Methods. Euphytica 157:239-251. doi: 10.1007/s10681-007-9417-3
Mut Z, Gulumser A and Sirat A. 2010. Comparison of stability statistics for yield in barley (Hordeum vulgare L.). Afr. J. Biotechnol. 9: 1610-1618. doi: 10.5897/AJB10.1404
Nassar R and Huehn M.1987. Studies on estimation of phenotypic stability: Tests of significance for non-parametric measures of phenotypic stability. Biometrics 43: 45-53. doi: 10.2307/2531698
Purchase JL, Hatting H and Vandeventer CS. 2000. Genotype × environment interaction of winter wheat (Triticum aestivum L.) in South Africa: Π. Stability analysis of yield performance. South Afric J Plant Soil 17:101-107.
doi: http://dx.doi.org/10.1080/02571862.2000.10634878
Rea R and De Sousa-Vieira O. 2002. Genotype x environment interactions in sugarcane yield trials in the central-western region of Venezuela INCI 27(11): 620-624.
Rea R, De Sousa-Vieira O, Díaz A, Ramón M, Briceño R, George J, Niño M and Demey J. 2015. Assessment of yield stability in sugarcane genotypes using non-parametric methods. Agronomía Colombiana 33(2): 131-138.
doi: https://doi.org/10.15446/agron.colomb.v33n2.49324
Scapim CA, Oliveira VR, Braceini AL, Cruz CD, Andrade CA, Vidial MCG. 2000.Yield stability in Maize (Zea mays L.) and correlation among the parameters of the Eberhart and
Russell, Lin and Binns and Huehn models. Genetics and Molecular Biology 23: 387-393. doi: 10.1590/S1415-47572000000200025
Segherloo AE, Sabaghpour SH, Dehghani H and Kamrani M. 2008. Nonparametric Measures of Phenotypic Stability in Chickpea Genotypes (Cicer arietinum L.). Euphytica 162: 221- 229. doi: 10.1007/s10681-007-9552-x
Shukla GK.1972. Some statistical aspects of partitioning genotype-environmental components of variability. Heredity 29: 237-245. doi:10.1038/hdy.1972.87
Temesgen T, Kenenib G, Seferaa T, Jarsob M. 2015. Yield stability and relationships among stability parameters in faba bean (Vicia faba L.) genotypes. The Crop Journal 3: 258 – 268. http://dx.doi.org/10.1016/j.cj.2015.03.004
Thennarasu K.1995. On certain non-parametric procedures for studying genotype-environment interactions and yield stability. Ph.D. Thesis. P. J. School, IARI, New Delhi
Wricke G. 1962. Über eine Methode zür Erfassung der Okologischen Streubreite in Feldresuchen. Z. Pflanzenzuchtg 47: 92-96.
How to Cite
APA
ACM
ACS
ABNT
Chicago
Harvard
IEEE
MLA
Turabian
Vancouver
Download Citation
CrossRef Cited-by
1. Mintu Ram Meena, Ravinder Kumar, R. Karuppaiyan, Neeraj Kulshreshtha, Manohar Lal Chhabra, Amaresh, Gopalareddy Krishnappa, Aswini Nunavath, K. Mohanraj, Perumal Govindaraj, Govind Hemaprabha. (2024). Unraveling the Stability of Sugarcane Clones Using Multivariate Stability Models for Cane Yield and Quality Under Subtropical Climates. Sugar Tech, 26(6), p.1790. https://doi.org/10.1007/s12355-024-01442-9.
2. Nasrin Akbari, Reza Darvishzadeh. (2024). A Study on the Yield Stability of Oilseed Sunflower Genotypes under Drought Stress. Journal of Crop Breeding, 16(4), p.129. https://doi.org/10.61186/jcb.16.4.129.
3. Ravinder Kumar, Pooja Dhansu, Neeraj Kulshreshtha, Mintu Ram Meena, Mahadevaswamy Huskur Kumaraswamy, Chinnaswamy Appunu, Manohar Lal Chhabra, Sstish Kumar Pandey. (2023). Identification of Salinity Tolerant Stable Sugarcane Cultivars Using AMMI, GGE and Some Other Stability Parameters under Multi Environments of Salinity Stress. Sustainability, 15(2), p.1119. https://doi.org/10.3390/su15021119.
4. Sandra Lorena Álvarez Ordoñez, Oscar Eduardo Checa Coral. (2026). Genotype–Environment Interaction in Afila Pea (Pisum sativum L.) in Southwestern Colombia. International Journal of Plant Production, 20(1) https://doi.org/10.1007/s42106-026-00422-1.
5. V. Vinu, S. Alarmelu, K. Elayaraja, C. Appunu, G. Hemaprabha, S. Parthiban, K. Shanmugasundaram, R. Rajamadhan, K. G. Saravanan, S. Kathiravan, Bakshi Ram, V. Vinayaka, M. K. C. Varatharaj. (2025). Multi-environment Analysis of Yield and Quality Traits in Sugarcane (Saccharum sp.) through AMMI and GGE Biplot Analysis. Sugar Tech, 27(2), p.540. https://doi.org/10.1007/s12355-024-01498-7.
6. Dragana Brankovic-Radojcic, Marija Milivojevic, Tanja Petrovic, Snezana Jovanovic, Aleksandar Popovic, Snezana Gosic-Dondo, Jelena Srdic. (2022). Study of maize yield stability with nonparametric methods. Genetika, 54(2), p.871. https://doi.org/10.2298/GENSR2202871B.
7. Ravinder Kumar, Mintu Ram Meena, Pooja Dhansu, Manohar Lal Chhabra, Chinnaswamy Appunu, V. Sreenivasa, A. Anna Durai, H. K. Mahadeva Swamy, Amaresh. (2025). Disclosure of Productive and Stable Sugarcane Genotypes for Cane Yield and Quality Traits Using Various Stability Statistics. Tropical Plant Biology, 18(1) https://doi.org/10.1007/s12042-024-09374-0.
8. Aliya Momotaz, R. Wayne Davidson, Duli Zhao, P.H. McCord, Hardev S. Sandhu, Miguel Baltazar, Md Sariful Islam, Orlando Coto Arbelo. (2021). Genotype-by-environment interaction analysis across three crop cycles in sugarcane. Journal of Crop Improvement, 35(2), p.276. https://doi.org/10.1080/15427528.2020.1817220.
Dimensions
PlumX
Article abstract page views
Downloads
License
Copyright (c) 2017 Revista Facultad Nacional de Agronomia

This work is licensed under a Creative Commons Attribution-NonCommercial 4.0 International License.
The journal allows the author(s) to maintain the exploitation rights (copyright) of their articles without restrictions. The author(s) accept the distribution of their articles on the web and in paper support (25 copies per issue) under open access at local, regional, and international levels. The full paper will be included and disseminated through the Portal of Journals and Institutional Repository of the Universidad Nacional de Colombia, and in all the specialized databases that the journal considers pertinent for its indexation, to provide visibility and positioning to the article. All articles must comply with Colombian and international legislation, related to copyright.
Author Commitments
The author(s) undertake to assign the rights of printing and reprinting of the material published to the journal Revista Facultad Nacional de Agronomía Medellín. Any quotation of the articles published in the journal should be made given the respective credits to the journal and its content. In case content duplication of the journal or its partial or total publication in another language, there must be written permission of the Director.
Content Responsibility
The Faculty of Agricultural Sciences and the journal are not necessarily responsible or in solidarity with the concepts issued in the published articles, whose responsibility will be entirely the author or the authors.