Published
Fitting lactation curves in a Colombian Holstein herd using nonlinear models
Ajuste de curvas de lactación en un rebaño Holstein Colombiano usando modelos no lineales
DOI:
https://doi.org/10.15446/rfna.v71n2.67424Keywords:
Tropical dairy cattle, Milk yield, Parametric models, Test-day (en)Bovino lechero tropical, Producción de leche, Modelos paramétricos, Día de control (es)
Statistical characterization of dairy cows lactation curves allows prediction of total milk yield from one or a few test-day records. The objectives were the characterization of milk production in a Colombian Holstein herd under tropical dairy production and to evaluate the statistical performance of six different lactation curve models on test-day records. The data set included 425 full lactations and 244,876 test day records of 14 consecutive years. Records of adjusted milk yield at 305 days, lactation length, production peak, time to the peak, and lactation persistence were analyzed under an univariate mixed linear model, and six non-linear lactation curve models were evaluated on the basis of their goodness of fit on test day records. Cows averaged 5830 ± 59 kg of milk at 305 days, 330 ± 3 days of lactation, 27.7 ± 0.3 kg of milk at peak, 4.7 ± 0.1 wk to the peak and 63.1 ± 0.6 % of persistence calculated for a 6 month period. Adjusted milk yield, lactation length and production peak increased with the number of calving. The best goodness of fit for each lactation curve or minimum means square error for records of average daily milk production of each week was reached by the two-phase lactation curve of Grossman and Koops. Under the conditions of this tropical dairy herd, results provide substantial evidence favoring the two-phase lactation curve of Grossman and Koops for research and technical purposes, while the model of Wood would be the best choice for livestock use.
La caracterización estadística de curvas de lactación de vacas lecheras permite predecir la producción total de leche desde uno o varios registros de control-día. Los objetivos fueron caracterizar la producción de leche en un rebaño Holstein colombiano en el trópico y evaluar el desempeño estadístico de seis modelos para ajustar curvas de lactancia en base a los registros control. Los datos incluyeron 425 lactancias completas y 244.876 registros de control-día de 14 años consecutivos. Los registros de producción de leche ajustada a 305 días, duración de la lactación, pico de producción, tiempo hasta el pico de producción y persistencia de la lactación fueron analizados bajo un modelo lineal mixto univariante, y se evaluaron seis modelos no lineales para el ajuste de curvas de lactación en base a su bondad de ajuste de los registros del día de la prueba. Las vacas promediaron 5830 ± 59 kg, 330 ± 3 días, 27,7 ± 0,3 kg, 4,7 ± 0,1 semanas y 63,1 ± 0,6% para leche ajustada a 305 días, duración de lactación, producción al pico, tiempo al pico y persistencia durante 6 meses, respectivamente. La producción a 305 días, la duración de lactación, y la producción al pico aumentaron con el número de partos. El mejor ajuste para cada curva de lactancia se alcanzó con el modelo en dos fases para el ajuste de curvas de lactancia de Grossman y Koops, ideal para fines técnicos y de investigación, mientras que el modelo de Wood sería mejor para uso ganadero.
Recibido: 3 de septiembre de 2017; Aceptado: 18 de enero de 2018
ABSTRACT
Statistical characterization of dairy cows lactation curves allows prediction of total milk yield from one or a few test-day records. The objectives were the characterization of milk production in a Colombian Holstein herd under tropical dairy production and to evaluate the statistical performance of six different lactation curve models on test-day records. The data set included 425 full lactations and 244,876 test day records of 14 consecutive years. Records of adjusted milk yield at 305 days, lactation length, production peak, time to the peak, and lactation persistence were analyzed under an univariate mixed linear model, and six non-linear lactation curve models were evaluated on the basis of their goodness of fit on test day records. Cows averaged 5830 ± 59 kg of milk at 305 days, 330 ± 3 days of lactation, 27.7 ± 0.3 kg of milk at peak, 4.7 ± 0.1 wk to the peak and 63.1 ± 0.6 % of persistence calculated for a 6 month period. Adjusted milk yield, lactation length and production peak increased with the number of calving. The best goodness of fit for each lactation curve or minimum means square error for records of average daily milk production of each week was reached by the two-phase lactation curve of Grossman and Koops. Under the conditions of this tropical dairy herd, results provide substantial evidence favoring the two phase lactation curve of Grossman and Koops for research and technical purposes, while the model of Wood would be the best choice for livestock use.
Keywords:
Tropical dairy cattle, Milk yield, Parametric models, Test-day.RESUMEN
La caracterización estadística de curvas de lactación de vacas lecheras permite predecir la producción total de leche desde uno o varios registros de control-día. Los objetivos fueron caracterizar la producción de leche en un rebaño Holstein colombiano en el trópico y evaluar el desempeño estadístico de seis modelos para ajustar curvas de lactancia en base a los registros control. Los datos incluyeron 425 lactancias completas y 244.876 registros de control-día de 14 años consecutivos. Los registros de producción de leche ajustada a 305 días, duración de la lactación, pico de producción, tiempo hasta el pico de producción y persistencia de la lactación fueron analizados bajo un modelo lineal mixto univariante, y se evaluaron seis modelos no lineales para el ajuste de curvas de lactación en base a su bondad de ajuste de los registros del día de la prueba. Las vacas promediaron 5830 ± 59 kg, 330 ± 3 días, 27,7 ± 0,3 kg, 4,7 ± 0,1 semanas y 63,1 ± 0,6% para leche ajustada a 305 días, duración de lactación, producción al pico, tiempo al pico y persistencia durante 6 meses, respectivamente. La producción a 305 días, la duración de lactación, y la producción al pico aumentaron con el número de partos. El mejor ajuste para cada curva de lactancia se alcanzó con el modelo en dos fases para el ajuste de curvas de lactancia de Grossman y Koops, ideal para fines técnicos y de investigación, mientras que el modelo de Wood sería mejor para uso ganadero.
Palabras clave:
Bovino lechero tropical, Producción de leche, Modelos paramétricos, Día de control.An accurate characterization of the lactation curve in dairy cattle has become essential for herd management and animal breeding (Gipson and Grossman, 1990). Moreover, the identification of biological and environmental factors influencing its trend and slope must be of special interest for dairy farmers (Masselin et al., 1987), as these sources of variation remarkably modulate the economic profitability inherent to each cow. The statistical characterization of the lactation curves allows us to predict total milk yield from one or a few test-day records (Goodall and Sprevak, 1984), and even milk composition (Stanton et al., 1992).
The first endeavors to mathematically characterize lactation curves date from the beginning of the 20th century (Grossman and Koops, 1988), although a plethora of parametric and non-parametric designs were developed from then on (Delange et al., 1953; Pérochon et al., 1996; Grossman and Koops, 2003). Nevertheless, substantial limitations were reported in tropical dairy cattle (Val-Arreola et al., 2004) where some parameterizations such as Wood's curve (Wood, 1967) poorly fit monthly data (Papajcsik and Bodero, 1988; Val-Arreola et al., 2004). These departures from non-tropical and intensive dairy production could be linked to limited energy balance and poor forage quality.
In Colombia, where milk is produced in tropical conditions using different dairy cattle breeds and their crosses, the first genetic evaluations on a larger scale were made from 1997 with the participation of the Colombian Association of Zebu Cattle Producers (Asocebú), Colombian Agricultural Research Corporation (Corpoica) and the Universidad Nacional de Colombia in Bogota. However, there are still many limiting factors in this country to be overcome for the development and establishment of breeding programs (Quijano, 2002) and frequently the selection is not made based on the genetic evaluations of the herds, but on their phenotype. Several lactation curve works have been done, but only some of them applying adjustment models as for example those of Cañas et al. (2011, 2012) and Vargas et al. (2016).
Within this context, this research evaluated six different lactation curve models in a Colombian Holstein dairy herd data, not previously evaluated, in order to assess their performance and goodness of fit in its tropical management system and recommend the most appropriate to be used for animal breeding purposes.
MATERIALS AND METHODS
Field data source
This research focused on the experimental dairy herd of the Centro Paysandú (Santa Elena, Medellín, Colombia, 6°12'37"N and 75°30'11"W) of the Universidad Nacional de Colombia, tropical region located 2500 m of altitude, with average temperature, rainfall and humidity of 17°C, 1861 mm and 79%, respectively. This Holstein cows herd was founded in 1956 donated by the W. K. Kellogg foundation (http://www.wkkf.org), maintaining a herd size between 80 and 90. Cow feeding is based on rotational grazing of Pennisetum clandestinum meadows supplemented with 3 to 10 kg of standard concentrate (16.8% protein; 33.6% NDF) depending on production level. Colombian (40%) and international (60%; i.e. USA, Canada and Europe) Holsteins bulls were used for AI, with manual (up to 1988) or machine milking (after 1988) done twice a day at 4 am and 2 pm.
Lactation data
The data set included 425 full lactations and 244,876 test day records taken during fourteen years (1986-1999) from the Colombian Holstein herd. Data were available for the first 9 lactations although the sixth and following lactations were grouped due to their reduced incidence (first lactation: 91; second: 80; third: 76; fourth: 66; fifth: 51; sixth and following: 61). Lactation records were restricted to 305 days and records of average daily milk production of each week (AWP) were calculated by accumulating appropriate test day records; Missing records (13%) for shorter-than-305 days lactations were augmented by applying lactation number-specific persistence coefficients estimated as the average decrease between two successive production weeks for each group of lactation number. 305 days adjusted milk yield (MY305d) was calculated for each lactation by adding AWP1x7 + AWP2x7 + … + AWP42x7 + AWP43x10, where AWPk indicated the AWP record for the kth week of lactation. Lactation length (LL) was defined as the number of days elapsed between calving date and drying date. Production peak (PP) was determined as the AWP with maximum milk production, whereas the time to the PP (TPP) was the number of weeks between calving date and PP date. Lactation persistence (LP) was evaluated for a 6 month period, calculated as the percentage of milk yield still producing 27 weeks after PP, when comparing with milk yield two weeks after PP.
Statistical analysis of dairy traits
Records of actual dairy traits (i.e., MY305d, LL, PP, TPP and LP) were analyzed under the following univariate mixed linear model with ANOVA properties:

where Yijkl was the phenotypic record, eijkl was the residual, CNi was the effect of the calving number with 6 levels (1st, 2nd, 3rd, 4th, 5th, and 6th and subsequent calving), CSj was the effect of the calving season with two levels (Dry: December to March, July and August; Rainy: April to June, September to November), YCk was the effect of the year of calving with 14 levels (from 1986 to 1999), and vl was the random contribution of the lth cow. All analyses were performed with the Mixed Model procedure of SAS.
Lactation curve models
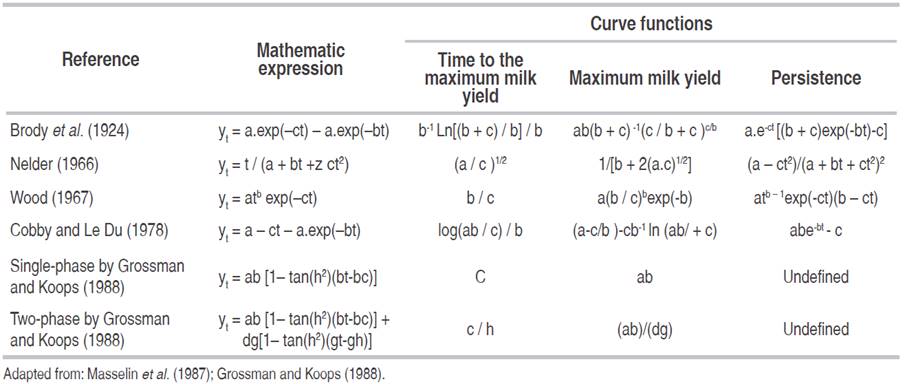
Six non-linear lactation curve models being commonly implemented for dairy cattle lactation curves worldwide were preliminary selected and evaluated on the basis of their goodness of fit on test day records. These parametric curves were the exponential model developed by Brody et al. (1924), Nelder's (1966) inverse polynomial model, Wood's (1967) incomplete gamma curve, Cobby and Le Du's (1978) model, and both single-phase, and two-phase curves, previously reported by Grossman and Koops (1988). Their Mathematical characterization is shown in Table 1, where yt was a test day record at time t (t = 0 being the calving date), and a, b, c, d, g and h where unknown parameters of the lactation curve models.
Table 1: Mathematical characterization of the lactation curve models implemented on Colombian Holstein milk production.
Comparing lactation curves and systematic sources of variation
Each lactation curve model was fitted on a lactation basis as suggested by Tekerli et al. (2000), Macciotta et al. (2005) and Dematawewa et al. (2007). Analyses were performed on AWP records and with the non-linear mixed models (NLMIXED) procedure of the SAS v.9.2 software (SAS Inst. Inc., Cary, NC). In order to compare the goodness-of-fit for each parameterization of the lactation curve, the means square error (MSE) was computed for each model. Additionally, model fit was compared by the Mixed Models procedure of SAS. The statistical model included the fixed effects of calving number (CNi) with 6 levels (1st, 2nd, 3rd, 4th, 5th, and 6th and subsequent calvings), calving season (CSj) with two levels (dry: December to March, July and August; rainy: April to June, September to November), their first-degree interaction, the lactation curve parameterization (LCk), and the random effect of each cow (vl) as follows:

Lactation curve parameters were also analyzed by the Generalized Linear Models procedure of SAS (SAS Institute, Inc.) and under the following model,

where θijk was the lactation-specific estimate for a given lactation parameter.
RESULTS AND DISCUSSION
Systematic sources of variation on dairy traits
Data from Colombian Holsteins involved in this study averaged 5830 ± 59 kg, 330 ± 3 d, 27.7 ± 0.3 kg, 4.7 ± 0.1 wk and 63.1 ± 0.6% for MY305d, LL, PP, TPP, and LP, respectively, being the age at first calving 30.0 ± 3 mo, and the average daily milk yield 19.3 ± 0.1 kg.
Results from the analyses of systematic sources of variation on MY305d, LL, PP, TPP and LP are shown in Table 2. Number of calving, calving season and year of calving significantly influenced all dairy traits (P<0.05) excepting number of calving on TPP (P=0.44) and calving season on LL (P=0.79) and LP (P=0.35). More specifically, MY305d, LL and PP increased (P<0.05) with the number of calving (from 1 to 5), although suggesting a slight decrease for older cows with more than 5 lactations (Table 3); In contrast, LP was higher (P<0.05) for first lactation cows than for the remaining categories.
Table 2: Significance level for calving number (CN), calving season (CS), year of calving (YC) and their first-degree interactions when analyzing main dairy traits.

Table 3: Values1 for the systematic effects influencing 305-d adjusted milk yield (MY305d), lactation length (LL), production peak (PP), time to the production peak (TPP), and lactation persistency (LP).

The original data set of Centro Paysandú farm was obtained between 1986-1999, but if a more recent work was done, probably the results would be similar to those presented here, since in the last 30 years there have not been any notable changes in this farm from the environmental and/or genetic point of view. Peak of production observed during the first 2 lactations was higher (+ 21% and + 9%, respectively) than indicated by Cañas et al. (2009) in Colombian Holstein cows. Both MY305d and PP, increased during the first five lactations, showing a stationary pattern afterwards, agreeing with results previously reported by Cerón-Muñoz et al. (2003) and Restrepo et al. (2008) in tropical dairy production systems. The MY305d was slightly lower (5830 vs 6212 kg) than in the case of Cañas et al. (2012) in Colombian herds, while the average PP (27.7 ± 0.3 kg) was similar to the value indicated by the same authors. On the other hand, our persistency (63.1%) can be considered normal or even higher than usual (i.e. 90% monthly) because was calculated for a period of six months.
In accordance with Macciotta et al. (2011), first calving cows showed a lower peak of production and a higher persistency, compared to later parities (Figure 1). MY305d in the fifth lactation was 27% higher than in the first one, matching the 25%-increase suggested by Hurley (2003) and attributed to the increase in body weight (~20%) and development of the mammary gland (~80%). The trends observed in first calving cows, with lower total and peak milk production, an increase in peak time and greater persistence, could be explained, according to Dijkstra et al. (1997), for the lower rate of proliferation of mammary secretory cells in primiparous, which can affect the speed to reach the peak, and, according to Stanton et al. (1992), counteract the normal decline of the lactation curve, generating greater persistence. In addition, the greatest productive increase between the first and the second may be due to a very important increase in the cells of the mammary parenchyma between both lactations (Pollot, 2000); this shape could be compatible with the phenotypic patterns shown in Colombian Holstein. On the other hand, TPP was not influenced by the lactation number, agreeing with Cañas et al. (2009) and contradicting previous results from Macciotta et al. (2004, 2011).

Figure 1: Effect of the calving number (CN) on the production of milk during lactation and the scale and shape of the lactation curve.
Differences between calving seasons evidenced a small but significant increase (P<0.05) in MY305d and PP traits for cows calving during the rainy season, and this peak of production was obtained earlier during the lactation period (Table 3). The departure between dry and rainy seasons was small for both MY305d and PP trait, increasing less than 3% during the rainy season. On the contrary, TPP was reduced by 13.6% during the rainy season. These results are comparable to the ones provided by Cerón-Muñoz et al. (2003) in Colombian herds, where cows that calved during rainy months reached higher production level.
Adjustment of lactation curve models
Average lactation curves were characterized by the estimates provided in Table 4, and corresponding average time to the production peak (wk), milk yield in he production peak (kg d-1) and persistence (%) were summarized in Table 5. Comparing with field data estimates in Table 3, time to the production peak (with values varying from 4.5 to 5.1, depending of number of calving) was clearly underestimated by all lactation curve models, with the only exception of the two-phase lactation curve (Grossman and Koops, 1988) that averaged 6.0 ± 0.2 wk (Table 5).
Table 4: Average estimates for lactation curve model parameters in Colombian Holstein cows.

Table 5: Predicted functions of the lactation curves in Colombian Holstein.

On the contrary, departures for milk yield in the production peak were small, these estimates ranging between 25.2 kg d-1 (single phase model; Grossman and Koops (1988)) and 27.4 - 27.6 kg d-1 (inverse polynomial model, Nelder (1966), and exponential model, Brody et al. (1924), respectively). Persistence showed a moderate dispersion pattern with minimum and maximum estimates provided by the two-phase model (Grossman and Koops (1988) and Wood's (1967), averaging 60.0 ± 0.5% and 74.0 ± 1.0%, respectively.
Although all models evidenced different patterns (Figure 2), some of them, particularly Single-phase (Grossman and Koops, 1988; Wood,1967), provided a bad prediction of the PP, a phenomenon previously reported by Grossman and Koops (1988) and Olori et al. (1999). These authors suggested that three-parameter exponential models suffered from important limitations during the first 90 days of lactation. On the contrary, Scherchand et al. (1995) and Vargas et al. (2000) provided evidences about a reasonable fit for the two-phase lactation curve between days 60 and 90 of lactation, whereas this model overestimated TPP and underestimated the PP in our Colombian Holstein data set.

Figure 2: General form of lactation curves standardized to 305 days adjusted by the studied models (A: Wood (1967), Brody et al. (1924), and Cobby and Le Du (1978); B: Nelder (1966), and Single-phase and Two-phase of Grossman and Koops (1988)).
Goodness of fit for each lactation curve model was evaluated by the MSE (Table 6) of estimated average daily milk yield. This statistic characterized the magnitude of the unaccounted variability for the average daily milk production of each week or AWP. On the basis of its MSE, goodness of fit for lactation curve models was maximum (P<0.05) with the two-phase model (Grossman and Koops, 1988), and progressively decreased with the incomplete gamma (Wood, 1967; Cobby and Le Du's, 1978) and the remaining models. Lactation curve parameters also departed across systematic effects such as calving number as shown for the best fitting models in Table 7.
Table 6: Goodness of fit1 of the six lactation curve models in terms of mean square error of estimated average daily milk yield.
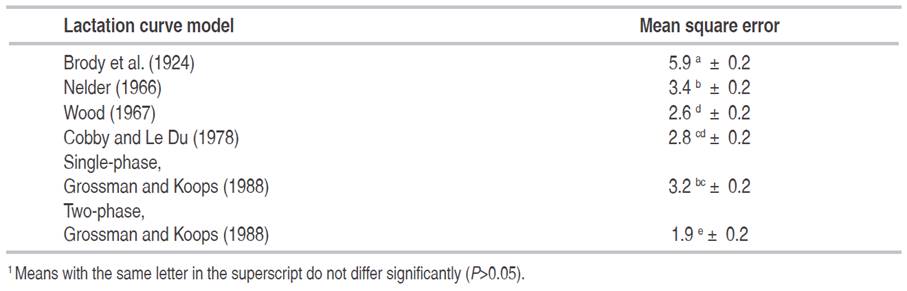
Table 7: Mathematical characterization of the lactation curve parameters regarding Grossman and Koops (1988) two-phase model and Wood (1967) model parameters implemented on Colombian Holstein milk production according to calving number (CN).

Our results agreed with Vargas et al. (2000) who favored the two-phase curve in Costa Rican Holstein dairy herds, and discarded others. In our case, the worst goodness of fit was achieved by the exponential model of Brody et al. (1924) as reported by Quinn et al. (2005), whereas Vargas et al. (2000) reported worse fits with Wood's curve. Limitations of the Wood model exist, but this model possesses the ability to fit four different shapes including the atypical curves (Macciotta et al., 2011). In addition, Dematawewa et al. (2007) and Macciotta et al. (2011) indicated the good fitting performances of the multiphasic approach but also the computational problems related to the estimation of a high number of parameters. These authors concluded in favor of simpler models, as the Wood function, particularly for routine use. Similarly, several Colombian authors Cañas et al. (2011, 2012); Vargas et al. (2016), under different circumstances, obtained the best results using the Wood model. In our case the biphasic function gave the best results, followed by the Wood model. Therefore, for research and technical purposes the two-phase model of Grossman and Koops (1988) would be recommended, but for common livestock use the simpler model of Wood would probably be the best choice.
CONCLUSIONS
Under the circumstances of this tropical Colombian Herd, and according to the MSE criteria, these results provide substantial evidence favoring the two-phase lactation curve of Grossman and Koops followed by the Wood model. The biphasic model would be recommended for research and technical purposes, while the Wood model would be the best for livestock use.
ACKNOWLEDGEMENTS
The research contract of J. Casellas was partially financed by Spain's Ministerio de Ciencia e Innovación (reference RYC-2009-04049). The authors are grateful to Neftalí Ortiz Herrea (Technical assistant of Paysandú experimental dairy herd) and to Elkin Arboleda Zapata (M.Sc., Zootechnician) for experimental help, and Llorenç Badiella (Universitat Autònoma de Barcelona) for statistical analysis advice.
REFERENCES
References
Brody S, Turner CW and Ragsdale C. 1924. The relation between the initial rise and the subsequent decline of milk secretion following parturition. The Journal of General Physiology. 6: 541–545.
Cañas JJ, Restrepo LF, Ochoa J, Echeverri A and Cerón-Muñoz M. 2009. Estimación de las curvas de lactancia en ganado Holstein y BON x Holstein en trópico alto colombiano. Revista Lasallista de Investigación 6(1): 35-42.
Cañas J, Cerón-Muñoz M and Corrales J. 2011. Modelación de curvas de lactancia para producción de leche, grasa y proteína en bovinos Holstein en Antioquia, Colombia. Revista MVZ Córdoba 16(2): 2514–2520.
Cañas J, Cerón-Muñoz M, and Corrales J. 2012. Modelación y parámetros genéticos de curvas de lactancia en bovinos Holstein en Colombia. Revista MVZ Córdoba 17(2): 2998-3003.
Cerón-Muñoz MF, Tonhati H, Costa CN, Solarte C, Benavides O. 2003. Factores de ajuste para producción de leche en bovinos Holstein colombiano. Revista Colombiana de Ciencias Pecuarias 16: 27-32.
Cobby JM and Le Du YLP. 1978. On fitting curves to lactation data. Animal Science 26(2): 127-133. doi: 10.1017/S0003356100039532
Delange J, Leroy AM and Poly J. 1953. Une étude sur les courbes de lactation. Annales de Zootechnie 2(3): 225-267. doi: 10.1051/animres:19530302
Dijkstra J, France J, Dhanoa MS, Maas JA, Hanigan MD, Rook AJ and Beever DE. 1997. A model to describe growth patterns of the mammary gland during pregnancy and lactation. Journal of Dairy Science 80(10): 2340–2354. doi: 10.3168/jds.S0022- 0302(97)76185-X
Dematawewa CMB, Pearson RE and Van Raden PM. 2007. Modeling extended lactations of Holstein. Journal of Dairy Science 90(8): 3924-3936. doi: 10.3168/jds.2006-790
Gipson TA and Grossman M. 1990. Lactation curves in dairy goats: a review. Small Ruminant Research 3(4): 383-396. doi: 10.1016/0921-4488(90)90019-3
Goodall EA and Sprevak D. 1984. A note on a stochastic model to describe the milk yield of a dairy cow. Animal Science 38(1): 133-136. doi: 10.1017/S0003356100041453
Grossman M and Koops WJ. 1988. Multiphasic analysis of lactation curves in dairy cattle. Journal of Dairy Science 71(6): 1598-1608. doi: 10.3168/jds.S0022-0302(88)79723-4
Grossman M and Koops WJ. 2003. Modeling extended lactation curves of dairy cattle: A biological basis for the multiphasic approach. Journal of Dairy Science 86(3): 988-998. doi: 10.3168/jds.S0022-0302(03)73682-0
Hurley WL. 2003. Lactation biology. University of Illinois, Urbana- Champaign, IL. http://ansci.illinois.edu/static/ansc438/. Consult: April 2014.
Macciotta NPP, Vicario D, Di Mauro C and Cappio-Borlino A. 2004. A multivariate approach to modeling shapes of individual lactation curves in cattle. Journal of Dairy Science 87(4): 1092-1098. doi: 10.3168/jds.S0022-0302(04)73255-5
Macciotta NPP, Vicario D and Cappio-Borlino A. 2005. Detection of different shapes of lactation curve for milk yield in dairy cattle by empirical mathematical models. Journal of Dairy Science. 88(3): 1178-1191. doi: 10.3168/jds.S0022-0302(05)72784-3
Macciotta NPP, Dimauro C, Rassu SPG, Steri R and Pulina G. 2011. The mathematical description of lactation curves in dairy cattle. Italian Journal of Animal Science 10(4): 213-223. doi: 10.4081/ ijas.2011.e51
Masselin S, Sauvant D, Chapoutot P and Milan D. 1987. Les modèles d’ajustement des courbes de lactation. Annales de Zootechnie 36(2): 171-206. doi: 10.1051/animres:19870206
Nelder JA. 1966. Inverse polynomials, a useful group of multifactor response functions. Biometrics 22(1): 128-141.
Olori VE, Brotherstone S, Hill WG and McGuirk BJ. 1999. Fit of standard models of the lactation curve to weekly records of milk production of cows in a single herd. Livestock Production Science 58: 55-63.
Papajcsik IA and Bodero J. 1988. Modeling lactation curves of Friesian cows in a subtropical climate. Animal Production 47: 201-207.
Pérochon L, Coulon JB and Lescourret F. 1996. Modeling lactation curves of dairy cows with emphasis on individual variability. Animal Science 63(2): 189-200. doi:10.1017/S1357729800014740
Pollot GE. 2000. A biological approach to lactation curve analysis for milk yield. Journal of Dairy Science 83(11): 2448-2458. doi: 10.3168/jds.S0022-0302(00)75136-8
Quijano JH. 2002. Resultados del programa de selección con base en Holstein y cruzamiento con la raza colombiana Blanco Orejinegro (BON) en el centro Paysandú. Universidad Nacional de Colombia. Sede Medellín. pp. 1-18. En: Seminario Internacional de Reproducción y Mejoramiento Genético Animal en Bovinos. Universidad Nacional de Panamá. Panamá.
Quinn N, Killen L and Buckley F. 2005. Empirical algebraic modelling of lactation curves using Irish data. Irish Journal of Agricultural and Food Research 44: 1-13.
Restrepo G, Pizarro EJ and Quijano JH. 2008. Índices de selección y niveles independientes de descarte para dos características productivas y reproductivas en un hato Holstein (Bos taurus). Revista Colombiana de Ciencias Pecuarias 21: 239-250.
Scherchand L, McNew RW, Kellogg DW and Johnson ZB. 1995. Selection of a mathematical model to generate lactation curves using daily milk yields of Holstein cows. Journal of Dairy Science 78(11):2507-2513. doi: 10.3168/jds.S0022-0302(95)76880-1
Stanton TL, Jones LR, Everett RW and Kachman SD. 1992. Estimating milk, fat, and protein lactation curves with a test day model. Journal of Dairy Science 75(6): 1691-1700. doi: 10.3168/jds.S0022-0302(92)77926-0
Tekerli M, Akinci Z, Dogan I and Akcan A. 2000. Factors affecting the shape of lactation curves of Holstein cows from the Balikesir province of Turkey. Jornal of Dairy Science 83(6): 1381-1386. doi: 10.3168/jds.S0022-0302(00)75006-5
Val-Arreola D, Kebreab E, Dijkstra J and France J. 2004. Study of the lactation curve in dairy cattle on farms in central Mexico. Journal of Dairy Science 87(11): 3789-3799. doi: 10.3168/jds.S0022-0302(04)73518-3
Vargas B, Koops, WJ, Herrero M and Van Arendonk JAM. 2000. Modeling extended lactations of dairy cows. Journal of Dairy Science 83(6): 1371-1380. doi: 10.3168/jds.S0022-0302(00)75005-3
Vargas O, Lasso S, Gaitán J and Corrales J. 2016. Modeling the lactation curves for milk by parity in Holstein cows in Boyacá, Colombia. Revista Colombiana de Zootécnia 2(4): 13-20.
Wood PDP. 1967. Algebraic model of the lactation curve in cattle. Nature 216: 164-165. doi: 10.1038/216164a0
How to Cite
APA
ACM
ACS
ABNT
Chicago
Harvard
IEEE
MLA
Turabian
Vancouver
Download Citation
CrossRef Cited-by
1. Emine ÇETİN TEKE, Hikmet ORHAN. (2021). Siyah Alaca Sığırlarda Zaman Serileri ile Farklı Laktasyon Eğrisi Modellerinin Karşılaştırılması. Kahramanmaraş Sütçü İmam Üniversitesi Tarım ve Doğa Dergisi, 24(3), p.679. https://doi.org/10.18016/ksutarimdoga.vi.774674.
2. Laura Jazmín Diaz-Morales, José Uriel Sepúlveda-Valencia, Beatriz E. Valdés-Duque, J. Felipe Osorio-Tobón, Mónica María Durango-Zuleta. (2023). Effect of the autochthonous starter culture on physicochemical, microbiological, and sensory characteristics of traditional colombian double-cream cheese: A kinetic approach. LWT, 185, p.115163. https://doi.org/10.1016/j.lwt.2023.115163.
3. A. F. Petrov, E. V. Kamaldinov, O. V. Bogdanova, K. S. Shatokhin, O. F. Efremova, V. A. Rogozin. (2022). The role of fixed factors in the variability of milk yield in Irmeni cattle under industrial complex conditions. Bulletin of NSAU (Novosibirsk State Agrarian University), (4), p.137. https://doi.org/10.31677/2072-6724-2021-61-4-137-149.
4. Luis Fernando Molina Paniagua, René Pinto Ruiz, Manuel Alejandro La O Arias, Francisco Guevara Hernández, Roberto Berrones Hernández, Deb Raj Aryal. (2026). Modeling the lactation curve in a herd of registered Jerseys in the dry tropics of Mexico. Tropical Animal Health and Production, 58(5) https://doi.org/10.1007/s11250-026-05125-3.
5. Luis Enrique Trejo-Díaz, Felipe de Jesús Ruiz-López, Hugo Oswaldo Toledo-Alvarado, Marina Durán-Aguilar, Adriana García-Ruiz. (2024). Modelación de curvas de lactancia para producción de leche, grasa y proteína, y evaluación de factores que las afectan en ganado Holstein en México. Revista Mexicana de Ciencias Pecuarias, 15(3), p.483. https://doi.org/10.22319/rmcp.v15i3.6528.
6. Nadia Hamdi Fahim, Mohammed Hamed Eldawy, Tharwat Imbabi, Mohammed Hamdy Farouk, Mohammed Hassan Bakr. (2025). Association between culling reasons and lactation curve components in Holstein cows. Journal of Dairy Research, 92(4), p.510. https://doi.org/10.1017/S002202992510157X.
Dimensions
PlumX
Article abstract page views
Downloads
License
Copyright (c) 2018 Revista Facultad Nacional de Agronomía Medellín

This work is licensed under a Creative Commons Attribution-NonCommercial-ShareAlike 4.0 International License.
The journal allows the author(s) to maintain the exploitation rights (copyright) of their articles without restrictions. The author(s) accept the distribution of their articles on the web and in paper support (25 copies per issue) under open access at local, regional, and international levels. The full paper will be included and disseminated through the Portal of Journals and Institutional Repository of the Universidad Nacional de Colombia, and in all the specialized databases that the journal considers pertinent for its indexation, to provide visibility and positioning to the article. All articles must comply with Colombian and international legislation, related to copyright.
Author Commitments
The author(s) undertake to assign the rights of printing and reprinting of the material published to the journal Revista Facultad Nacional de Agronomía Medellín. Any quotation of the articles published in the journal should be made given the respective credits to the journal and its content. In case content duplication of the journal or its partial or total publication in another language, there must be written permission of the Director.
Content Responsibility
The Faculty of Agricultural Sciences and the journal are not necessarily responsible or in solidarity with the concepts issued in the published articles, whose responsibility will be entirely the author or the authors.