Published
Vulnerability to climate change of smallholder cocoa producers in the province of Manabí, Ecuador
Vulnerabilidad al cambio climático de pequeños productores de cacao en la provincia de Manabí, Ecuador
DOI:
https://doi.org/10.15446/rfnam.v72n1.72564Keywords:
Coverage, deforestation, extreme weather events, rainfall, temperature, Theobroma cacao L. (en)Cobertura, deforestación, eventos climáticos extremos, precipitaciones, temperatura, vulnerabilidad (es)
The consequences of climate change in the agricultural sector worldwide expose the need to understand the scope of their impact in order to develop mitigation and adaptation strategies for them. Therefore, this research evaluated the alterations in the environmental conditions and their relation with the vulnerability of smallholder cocoa (Theobroma cacao L.) producers to climate change in the province of Manabí. A non-probabilistic sampling of 1,060 small farmers was made in five cantons of Manabí. The vulnerability was determined through indicators such as the normalized difference vegetation index (NDVI), deforestation data from 1990 to 2016, models of the changes in climate and extreme weather events, satellite images, records from the National Institute of Meteorology and Hydrology (INAMHI by its initials in Spanish), and numerical outputs of mathematical models calibrated for Ecuador climatic and environmental data. Each indicator was calculated in conventional units and then categorized into vulnerability levels: low, medium, high and very high. For the indicators’ superposition, algebraic tools of the Geographic Information Systems’ (GIS) maps were used. The results showed a very high incidence of extreme events, deforestation higher than 6,000 ha year-1, an increase of 0.8 °C in temperature between 1960 and 2006, an increase in rainfall on the coastal zone close to 90% and a decrease of it of more than 20% on the agricultural area. Furthermore, coverage showed the following distribution of the determined vulnerability levels: low (13.30%), medium (34.74%), high (45.53%), and very high (6.43%).
Las consecuencias del cambio climático en el sector agrícola a nivel mundial dejan expuesta la necesidad de entender los alcances de su impacto para así desarrollar estrategias de mitigación y adaptación para las mismas. Por lo tanto, esta investigación evaluó las alteraciones en las condiciones ambientales y su relación con la vulnerabilidad que tienen los pequeños productores de cacao (Theobroma cacao L.) al cambio climático en la provincia de Manabí. Se hizo un muestreo no probabilístico de 1.060 pequeños agricultores en cinco cantones de Manabí. La vulnerabilidad se determinó mediante indicadores como el índice de vegetación de diferencia normalizada (NDVI por sus siglas en inglés), datos de deforestación de 1990 a 2016, modelos de los cambios en el clima y eventos climáticos extremos, imágenes de satélite, registros del Instituto Nacional de Meteorología e Hidrología (INAMHI) y salidas numéricas de modelos matemáticos calibrados para datos climáticos y ambientales del Ecuador. Cada indicador se calculó en unidades convencionales y luego se categorizó en niveles de vulnerabilidad: baja, media, alta y muy alta. Para la superposición de los indicadores se usó herramientas algebraicas de los mapas del Sistema de Información Geográfica (SIG). Los resultados muestran una incidencia muy alta de eventos extremos, deforestación superior a 6.000 ha año-1, un incremento de la temperatura en 0,8 °C de 1960 a 2006, un aumento en las precipitaciones en la zona costera cercano al 90% y una disminución en las mismas superior al 20% en la zona agrícola. Además, la cobertura arrojo la siguiente distribución en los niveles de vulnerabilidad: baja (13,30%), media (34,74%), alta (45,53%), y muy alta (6,43%).
Recibido: 30 de mayo de 2018; Aceptado: 1 de noviembre de 2018
ABSTRACT
The consequences of climate change in the agricultural sector worldwide expose the need to understand the scope of their impact in order to develop mitigation and adaptation strategies for them. Therefore, this research evaluated the alterations in the environmental conditions and their relation with the vulnerability of smallholder cocoa (Theobroma cacao L.) producers to climate change in the province of Manabí. A non-probabilistic sampling of 1,060 small farmers was made in five cantons of Manabí. The vulnerability was determined through indicators such as the normalized difference vegetation index (NDVI), deforestation data from 1990 to 2016, models of the changes in climate and extreme weather events, satellite images, records from the National Institute of Meteorology and Hydrology (INAMHI by its initials in Spanish), and numerical outputs of mathematical models calibrated for Ecuador climatic and environmental data. Each indicator was calculated in conventional units and then categorized into vulnerability levels: low, medium, high and very high. For the indicators’ superposition, algebraic tools of the Geographic Information Systems’ (GIS) maps were used. The results showed a very high incidence of extreme events, deforestation higher than 6,000 ha year-1, an increase of 0.8 °C in temperature between 1960 and 2006, an increase in rainfall on the coastal zone close to 90% and a decrease of it of more than 20% on the agricultural area. Furthermore, coverage showed the following distribution of the determined vulnerability levels: low (13.30%), medium (34.74%), high (45.53%), and very high (6.43%).
Keywords:
Coverage, Deforestation, Extreme weather events, Rainfall, Temperature, Theobroma cacao L.RESUMEN
Las consecuencias del cambio climático en el sector agrícola a nivel mundial dejan expuesta la necesidad de entender los alcances de su impacto para así desarrollar estrategias de mitigación y adaptación para las mismas. Por lo tanto, esta investigación evaluó las alteraciones en las condiciones ambientales y su relación con la vulnerabilidad que tienen los pequeños productores de cacao (Theobroma cacao L.) al cambio climático en la provincia de Manabí. Se hizo un muestreo no probabilístico de 1.060 pequeños agricultores en cinco cantones de Manabí. La vulnerabilidad se determinó mediante indicadores como el índice de vegetación de diferencia normalizada (NDVI por sus siglas en inglés), datos de deforestación de 1990 a 2016, modelos de los cambios en el clima y eventos climáticos extremos, imágenes de satélite, registros del Instituto Nacional de Meteorología e Hidrología (INAMHI) y salidas numéricas de modelos matemáticos calibrados para datos climáticos y ambientales del Ecuador. Cada indicador se calculó en unidades convencionales y luego se categorizó en niveles de vulnerabilidad: baja, media, alta y muy alta. Para la superposición de los indicadores se usó herramientas algebraicas de los mapas del Sistema de Información Geográfica (SIG). Los resultados muestran una incidencia muy alta de eventos extremos, deforestación superior a 6.000 ha año-1, un incremento de la temperatura en 0,8 °C de 1960 a 2006, un aumento en las precipitaciones en la zona costera cercano al 90% y una disminución en las mismas superior al 20% en la zona agrícola. Además, la cobertura arrojo la siguiente distribución en los niveles de vulnerabilidad: baja (13,30%), media (34,74%), alta (45,53%), y muy alta (6,43%).
Palabras clave:
Cobertura, Deforestación, Eventos climáticos extremos, Precipitaciones, Temperatura, Theobroma cacao L.According to the IPCC (2014), the temperature of the planet's surface has increased by approximately 0.2 °C per decade since the 1980s; however, this phenomenon has been accelerating since the end of 1990. Likewise, the projections of mathematical climate models show increases to 2 °C in 2050 and up to 3 °C at the end of the century.
The studies of the International Center for the Investigation of the El Niño Phenomenon CIIFEN (2014), and Thieelen et al. (2015), have determined that the changes will be gradual and will be accompanied by an increase in climatic variability and extreme events, which will generate more frequent episodes of droughts and floods, as well as an increase in the intensity of rainfall. In Ecuador, future scenarios show increases in temperature in the coastal region and reductions in the precipitation in the northern center of the Manabí province where precisely much of the agricultural activity takes place, and water sources play an important role because they are mainly used for irrigation, human consumption, and hydroelectric energy generation (Muñoz, 2010).
According to Vergara et al. (2014), climate change has strong effects on agricultural activities. Considering that cocoa crops are susceptible to changes in environmental conditions, the occurrence of this variation has adverse effects on it. These extreme phenomena could cause an alteration in the development stages and rates of pests and diseases related to cocoa, a decrease in the incubation periods and development of harmful organisms, and high ease of introduction of invasive species as well as changes in their geographical distribution (Schroth et al., 2016). Cocoa crops’ productivity and all the socioeconomic variable related to it can be severely affected if those prone evens happen; therefore, it is possible that 580,000 ha dedicated to the production of cocoa (Theobroma cacao L.) in Ecuador will be at risk. Approximately 60% of that agricultural area correspond to smallholder producers that have less than 3.5 ha each, and whose total cocoa production generate 820 million dollars of earnings to the country which equivalent to 0.6% of GDP (ANECACAO, 2015).
Recent research found tremendous effects on cocoa cultivation due to drought events, reporting losses in production yields between 10 and 46% in Indonesia (Schwendenmann et al., 2010). Gateau-Rey et al. (2018) found in farms, chosen randomly in Brazil, a high mortality of cocoa trees (15%) and a severe decrease in cocoa yield (89%), as well as an increase in the rate of infection of the chronic fungal disease Moniliophthora perniciosa after the environmental conditions imposed by the Niño phenomenon between 2015 and 2016,. These findings, in the opinion of the authors, demonstrate that cocoa producers are at risk, and the increasing frequency of strong weather events will likely cause a decline in cocoa yields in the coming decades. Besides, cocoa and other crops can be the warning of the next important effects of the climate change on the natural and semi-natural vegetation.
Regarding the Ecuadorian outlook, the MAGAP (2015) reported that yields in cocoa production systematically had been increasing since 2002. Going from a national average of 0.17 to 0.60 t ha-1. Only a shrinkage has been reported in 2012 that registered a 40% decrease in the total production (133 t) compared to 2011 (230 t), which undoubtedly is related to the occurrence of the La Niña Phenomenon in the South American coast between 2010 and 2011, generating strong droughts with a devastating effect on agricultural activities.
Although there are reports about annual cocoa yields, there are no studies that show the relationship between climate change and the alteration in the environmental conditions with the production of cocoa (T. cacao L.). Therefore, this research evaluated the alterations in the environmental conditions and their relation with the vulnerability of smallholder cocoa (Theobroma cacao L.) producers to climate change in the cantons of Chone, Tosagua, Bolívar, Junín, and Portoviejo in the province of Manabí. The vulnerability was determined based on the indicators such as the normalized difference vegetation index (NDVI), deforestation data from 1990 to 2016, models of the changes in climate and extreme events, satellite images, records from the National Institute of Meteorology and Hydrology (INAMHI by its initials in Spanish), and numerical outputs of mathematical models calibrated for Ecuador climatic and environmental data. Each indicator was calculated in conventional units and then categorized into vulnerability levels: low, medium, high and very high.
MATERIALS AND METHODS
The study was carried in a total area of 2,134.50 ha in the cocoa agricultural regions of Chone (0°37’59.5”S, 79°55’17.7”W), Bolívar (0°50’31”S, 80°09’43”W), Tosagua (0°47’02.2”S, 80°14’06.8”W), Junin (01°01’20.2792”S, 080°27’38.5844”W), and Portoviejo (1°01’20.3”S, 80°27’38.6”W) in the province of Manabí, Ecuador. A non-probabilistic sample of 1,060 smallholder farmers was used, these cocoa producers were selected because they have territory extensions of less than 5 ha and are certified as organic cocoa producers. Unstructured surveys and interviews were carried out to verify the information; the collected data was complemented with the direct observation on the premises and interviews of technicians of governmental institutions and advisers of rural producers.
For the chosen cocoa agricultural areas, their vulnerability to climate change was determined through several climatic and environmental indicators such as the Normalized Difference Vegetation Index (NDVI), the deforestation coverage, the occurrence of extreme weather events, the models of climate changes as well as the superposition of the digital information of the same. Besides, the vulnerability was classified into four levels: very high, high, medium and low.
Generation of indicators based on satellite data
The satellite information and its geometric corrections were made according to the methodology proposed by Montilla Pachecho and Pacheco Gil (2017) in order to process the image of the Landsat 8 sensor, LC80110612016332LGN00, from November 2016. The objective of this procedure is to orient the pixel positions regarding Ecuador’s cartographic reference system through control points (GCP).
Radiometric corrections
The methods that tend to eliminate dispersion by subtraction were applied in order to approximate the response received by the sensor with the real object observed on the earth’s surface. The method used in this phase was the minimum histogram. According to Hum et al. (2014), it is limited to subtract in each band the minimum value observed since it assumes that in a scene there can be some pixels in total shadow, which in the absence of atmosphere would and should not reflect any solar energy. With these procedures, more accurate data were obtained than previous versions of Landsat, incorporating substantial improvements in geometrical and radiometric aspects, according to the studies of Mishra et al. (2016), Sousa and Small (2017), and Roy et al. (2016).
Calculation of the Normalized Difference Vegetation Index (NDVI)
This index was determined according to the approaches of Baihua and Burgher (2015), to determine the characteristics of the vegetation in semi-arid zones in ecological conditions similar to those present in the studied places. The NDVI is obtained with the equation:

Where:
NIR: Near-infrared band.
VISR: Red band
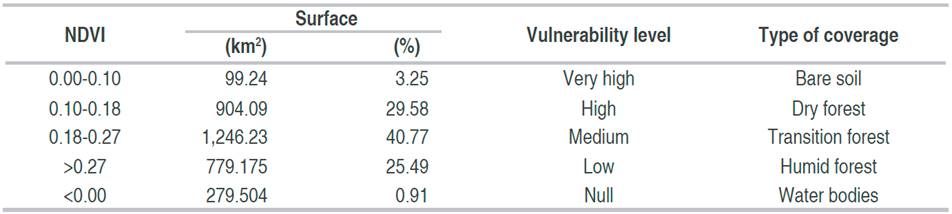
With the application of the above equation, an image with normalized magnitudes between -1 and 1 was generated, where the negative values and close to 0 indicate zones devoid of vegetation, and those leading to 1 indicate areas with very dense cover vegetation. This coverage was reclassified into four vulnerability levels through a spatial distribution analysis (Table 1).
Table 1: Categorization of vulnerability according to the normalized difference vegetation index.
Coverage of deforestation
The historical deforestation information of the MAE (2017) was used for the periods 1990-2000, 2000-2008, 2008-2014, and 2014-2016. With the Geographic Information Systems (GIS) the four coverages (bare soil, dry forest, transition forest, and humid forest) were united in a single map, which was reclassified in a Boolean image with low and very high vulnerability levels for the zones without deforestation and with deforestation, respectively.
Extreme weather events and models of climate changes
The historical data of the INAMHI were used to define the affectation due to extreme weather events, considering as extreme the cases above the last quartile and below the first one of the series of data for the period 1970-2016. On the other hand, the proposal of Schroth et al. (2016) was considered for the models of climate changes, processing the numerical outputs generated by the MAE (2017) and INAMHI (2017) with the ETA and TL959 models, these models presented the best correlations with the historical records for precipitation and temperature, respectively. Shapefiles were constructed with the information obtained from these models, with the coverage of changes in precipitation and temperature for the province of Manabí; categorizing the vulnerability into four levels according to the climate elements in very high, high, medium and low.
RESULTS AND DISCUSSION
The Normalized Difference Vegetation Index (NDVI) reported values ranging from -0.278 to 0.549, with an average of 0.212. Coverage of transition and dry forest comprised about 70.35% of the territory studied and had a medium and high vulnerability, respectively (Table 1). Although the humid forest presented a low vulnerability when the experiment was carried out, it is an area that must be monitored since it could be potentially used for agriculture expansions to sow cocoa and other crops. It is notable that this area represented more than 25% of the studied zone.
The search for new sites suitable for producing cocoa could trigger the clearing of forests and natural protected areas, which are important for flora and fauna habitats (Ruf et al., 2015). In this sense, Turbay et al. (2014) recommend adequate shade management in crops, renewal with disease-resistant varieties, crop association, plant cover, stepped sowing, and reforestation as strategies to reduce vulnerability to climate change. As Figure 1 shows, the vulnerability levels very high and high are mostly located in areas close to the coast, where dry forest coverage predominated; while low vulnerability was distributed in the central western mountainous area with predominance of the humid forest coverage.

Figure 1: Spatial distribution of vulnerability in response to the normalized difference vegetation index (NDVI).
Deforestation
Table 2 and Figure 2 show the concentration of the deforested areas in the northern part of the studied zone which belong to Chone and Bolívar cities, encompassing a total deforested area of 392.06 km2 (12.8% of the studied area) between 1990 and 2016, with a deforestation rate higher than 1,500 ha year-1. High deforestation is attributed to changes in land use, generally for agricultural activities such as mainly extensive cattle-breeding and short-cycle crops. The practice of these activities with technologies that are not friendly to the environment increases vulnerability to climate change because it favors the emission of greenhouse gases and the loss of forest and soil resources (MAE, 2017). This information is consistent with studies conducted in West Africa, reported by Ruf et al. (2015), where cocoa cultivation is indicated as an important deforestation driver. On-site detection for replanting old plantations, farmers usually migrated to the forest borders to establish new cocoa farms in order to find more humid areas to sow it.
Table 2: Deforestation during the period 1990-2016.

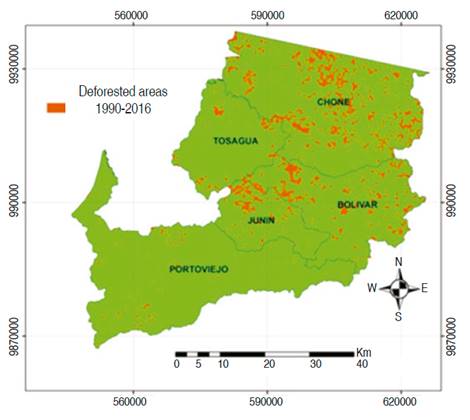
Figure 2: Spatial distribution of deforestation due to agricultural activities between 1990 and 2016.
Deforestation has a direct relation to climate change. Forest degradation leads to the loss of carbon dioxide repositories. The carbon storage compartments in trees are aerial biomass, mainly in the trunks of woody plants and leaves; there is also underground biomass that stores it in the root tree network. The carbon accumulated by trees, and hence by the forest, can move and be stored in the soil due to the necromass and plant litter.
The main tool to prepare agricultural land is the burning of green areas and forest; this practice leads to increase deforestation. Besides, scorched vegetation releases CO2, CH4, N2O, ozone precursors, and aerosols (including black carbon) to the atmosphere. The vegetation that develops after a fire is going to absorb and consume atmospheric CO2 and nitrogen. Anthropogenic land management or land transformation through fire leads to an increase in the levels of disturbance or permanent clearance of forest. This action results in net emissions to the atmosphere over time. Satellite detection of fire occurrence and persistence has been used to estimate fire emissions. However, it is hard to separate the source of fire as natural or anthropogenic. These conditions are intensified in the studied area due to an average of 400 kg of nitrogen fertilizer is used per extension and livestock is produced with a loading capacity of only 1 head ha-1, wherewith the great influence of deforestation on the land of smallholder cocoa producers in the Province of Manabí was determined.
Fieldwork carried out in the studied area, and the use of dated satellite images interception updated how is the processes of continuous deforestation with current trends - an estimation of 4,000 ha year-1 in the rural territory, which represents approximately 20.00 km2. However, these data do not represent facts. The Ecuadorian government ratified the commitments made in the Paris agreement and presented a zero deforestation goal for the year 2025. Public policies and citizen training must be implemented to achieve the objectives, which imply significant changes in the current technologies production and incorporation of sustainable mechanisms economically and environmentally speaking.
Extreme weather events
The thermal and rainfall regimes in the central region of the Manabí province are characterized by a high seasonality, related to the seasonal warming of the equatorial Pacific and the displacement of the intertropical convergence zone (Thielen et al., 2015). During this seasonality, anomalies with a high incidence of extreme weather events such as La Niña and El Niño phenomenon occur. These phenomena produce two extreme conditions such as intense periods of drought or rainfall, the occurrence of one of them of depending on the geographical zone that they occur. Therefore, cocoa crops are susceptible to these both weather extreme event (Ojo and Sadiq, 2010).
The analysis of climate data shows that the frequency of positive and negative thermal anomalies (El Niño and La Niña), which generate extraordinary rainfall and drought is very high in the equatorial Pacific. Therefore, the entire coastal area of Ecuador has a very high vulnerability to extreme events of this type (Figure 3).

Figure 3: Thermal anomalies in the sea surface temperature of the Equatorial Pacific Ocean between 2002 and 2012.
During 2015, 2016, and 2017 the extraordinary rains, related to the anomalous warming of the sea surface in the equatorial Pacific coast, altered the historical averages in the precipitations, the solar brightness, and the environmental temperature causing severe impacts in the flowering, the ears’ development, and the growth of the cacao trees (MAGAP, 2015). The rainfall in the Ecuadorian coastal area has exceeded, in some cases, more than 500% of the historical averages (INAMHI, 2017).
Regarding the incidence of these climatic alterations in cocoa cultivation, Schrot et al. (2016) report that the cocoa fruit does not develop completely during the droughts, and very intense rains diminish the flowering and the fruit set; hence, both events reduce cocoa productivity. On the other hand, in response to the increase in temperature, the cacao trees restrict the development of pods to get the most water for growth. MAGAP reported the increasing incidence of the monk because of the El Niño phenomenon in 2017. It is known this pest occurs in rainy seasons, where the temperature and humidity conditions are favorable for the growth of the fungus Moniliophthora roreri which causes watery cocoa rot (INIAP, 2015).
Considering environmental conditions for the criteria the normal development of cocoa cultivation occur at temperatures between 18 and 34 °C and precipitations per cycle from 1200 to 3000 mm are required (INIAP, 2015). The average monthly precipitation range required for cocoa cultivation is 125 mm. When rainfall does not cover water needs, farmers must use irrigation (in areas with water availability) to compensate the deficit and avoid production losses. The entire province was categorized in a very high vulnerability to cocoa cultivation considering the high frequency in the occurrence of extreme events.
Gateau-Rey et al. (2018) reported severe decreases in the soil’s water content, because of the extreme weather events caused by the El Niño phenomenon in Brazil from 2015 to 2016. The water deficit of the soil has a great influence on the yield decrease of the cocoa crop.
Model of the climate changes
The decrease in precipitation is located precisely in the mountainous zones recognized as water-producing areas (Figure 4); therefore, this decrease has a direct effect on the availability of water for future irrigation systems in cocoa areas since the monthly rainfall average in them barely exceeds the amount required by the crop (125 mm year-1). On the other hand, the increase in temperature would affect the availability of water due to the increase in evapotranspiration although it would not surpass the optimal temperature limits of cocoa crops (Muñoz, 2010).

Figure 4: Vulnerability according to A. Decrease in rainfall; B. Temperature increase.
The effects related to extreme events in the climate could generate great consequences for the global production of cocoa, not only because of the physiology of the plant but also because of the increase of diseases and pests (Ruf et al., 2015).
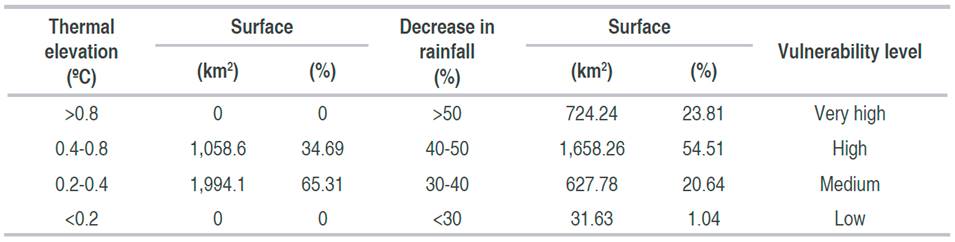
The categorization of vulnerability due to climatic events showed that 34.69% of the studied area has a high vulnerability to temperature variations, with increases of up to 0.8 °C (Table 3). On the other hand, 54.51% of the territory is highly vulnerable to the decrease in rainfall levels, with negative values between 40 and 50% of the total annual rainfall; that variation means that the crop could be affected since the lack of water affects the floral development.
Table 3: Vulnerability categorization according to thermal and rainfall anomalies.
The results of the model of climate changes suggest the loss of environmental capacity for the cocoa cultivation in the coast, the increase of the temperature would displace the crop areas to higher altitudes. This situation is contrary to the results found by the CIAT (2014) for Ecuador’s Andean region, where cocoa crops move to lower areas.
As a strategy to face the problem, it is necessary to update the information with research on irrigation systems suitable for cultivation. Parallel to it, there should be formulated government policies to help farmers and the cocoa industry to prepare for facing and adapting to climate change.
Vulnerability summary
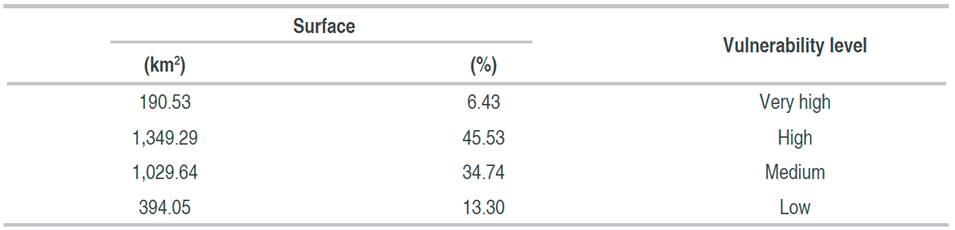
The overlapping of the indicators reflects the total vulnerability in four levels (Table 4), where most of the areas evaluated are categorized into a high and very high vulnerability, they together account for more than 50% of the territory. This result implies urgent needs to implement mitigation and adaptation measures to climate change.
Table 4: Categorization of the total vulnerability.
This study also specified the particularly vulnerable areas (Figure 5) to lead decision making by cocoa producers in these areas. They need to implement strategies for the adaptation and mitigation to bear the climate change, which will allow them to enrich or maintain the productivity of the cocoa crops. Apply those measures is not possible if they do not possess the knowledge, the tools, and the support of governmental and institutional entities. Nowadays, several alternatives can be implemented such as agro-tourism, the integration of family labor, community and union associations, day labor, and marketing strategies; the latter alternative encompasses fair markets and product certifications that help to improve sales prices and withstand the moments of crisis. These strategies can be adapted to the cultivation of cocoa in the studied area.
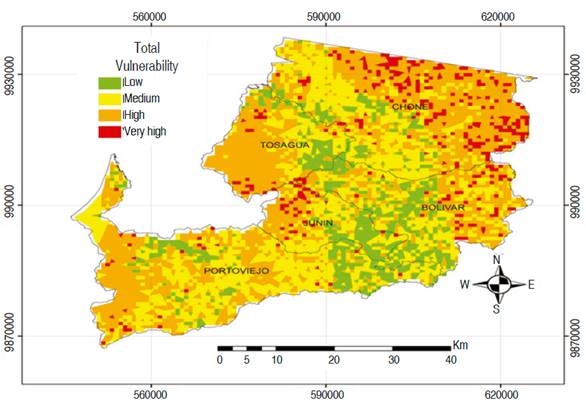
Figure 5: Spatial distribution of the total vulnerability.
CONCLUSIONS
The indicators analyzed yielded that the normalized vegetation difference index groups 34% of the studied territory into high and very high vulnerability to climate change. Besides, 12% of the territory presents deforestation, going from forest cover to agricultural mosaic, due to unsustainable agricultural practices regarding the climate effects. The province of Manabí is exposed to frequent extreme weather events such as droughts and floods which is evidenced by the anomalies of the sea surface temperature; actually, 77% of its territory presented high and very high vulnerability to the models of the climate changes. The combined action of all the studied indicators generates high and very high vulnerability in 52% of the territory analyzed. These results suggest the need to consider scenarios for the implementation of adaptation and mitigation measures that increase the resilience of populations and ecosystems to the effects of climate change.
ACKNOWLEDGEMENTS
The present work is born from a worldview of the environment, for the authors thank God, nature, their family, and their friends.
REFERENCES
References
ANECACAO. 2015. Exportaciones de Cacao del Ecuador. In: Asociación Nacional de Exportadores de Cacao, http://www.anecacao.com/index.php/es/inicio.html. 6 p.; accessed: January 2018.
Baihua F and Burgher I. 2015. Riparian vegetation NDVI dynamics and its relationship with climate, surface water and groundwater. Journal of Arid Environments 113: 59-68. doi: 10.1016/j.jaridenv.2014.09.010.
CIIFEN. 2014. Estrategia Provincial de Cambio Climático: Fase I: Diagnóstico. Implementación de un sistema de información de vulnerabilidad sectorial de la provincia del Guayas frente al cambio y la variabilidad climática. In: Centro Internacional para la Investigación del Fenómeno de El Niño, http://www.ciifen.org/. 95 p.; accessed: February 2018.
Ojo AD and Sadiq I. 2010. Effect of climate change on cocoa yield: a case of cocoa research institute (CRIN) farm, Oluyole local government Ibadan Oyo State. Journal of Sustainable Development in Africa 12(1): 350-358.
Gateau-Rey L, Tanner EVJ, Rapidel B, Marelli JP and Royaert S. 2018. Climate change could threaten cocoa production: Effects of 2015-16 El Niño-related drought on cocoa agroforests in Bahia, Brazil. Plos One 13(7): e0200454. doi: 10.1371/journal.pone.0200454
Hum YC, Lai KW and Mohamad Salim MI. 2014. Multiobjectives bihistogram equalization for image contrast enhancement. Complexity 20(2): 22-36. doi: 10.1002/cplx.21499
INAMHI 2017. Anuario Meteorológico N° 53-2013. First Edition. Dirección ejecutiva del INAMHI, Quito. 144 p.
INIAP. 2015. Informe anual 2015. In: Instituto Nacional de Investigaciones Agropecuarias, http://repositorio.iniap.gob.ec/handle/41000/4094 104 p.; accessed: February 2018.
CIAT. 2014. Evaluación de la vulnerabilidad al cambio climático de la agricultura en la región Andina de Ecuador. In: Centro Internacional de Agricultura Tropical, http://dapa.ciat.cgiar.org/wp-content/uploads/AboutUs/PolicyBriefs/policy-brief-15-evaluacion-vulnerabilidad-cambio-climatico-ecuador.pdf. 6 p.; accessed: January 2018.
IPCC 2014. Quinto Informe de Evaluación del Grupo Intergubernamental de Expertos sobre el Cambio Climático. In: The Intergovernmental Panel on Climate Change, https://www.ipcc.ch/. 27 p.; accessed: November 2017.
MAE. 2017. Mapa histórico de la deforestación del Ecuador continental. In: Ministerio del Ambiente del Ecuador, https://docplayer.es/13530720-Mapa-historico-de-deforestacion-del-ecuador-continental.html 46 p.; accessed: December 2017
MAGAP 2015. Boletín situacional de Cacao 2014. In: Ministerio de Agricultura y Ganadería, https://www.agricultura.gob.ec/. 7 p.; accessed: September 2017.
Mishra N, Helder D, Barsi J and MarKham B. 2016. Continuous calibration improvement in solar reflective bands: Landsat 5 through Landsat 8. Remote Sensing of Environment 185: 7-15. doi: 10.1016/j.rse.2016.07.032
Montilla Pacheco A and Pacheco Gil HA. 2017. Comportamiento temporal y espacial del bosque ribereño en el curso bajo del río Portoviejo y la quebrada Chilán, provincia de Manabí, Ecuador. Revista Internacional de Contaminación Ambiental 33(1): 21-35. doi: 10.20937/rica.2017.33.01.02.
Muñoz AG. 2010. Validación y análisis de consenso de modelos de escenarios de cambio climático para Ecuador. Proyecto inamhi-mae-scn-praa-pacc. Centro de Modelado Científico (CMC) de La Universidad del Zulia, Maracaibo. 129 p.
Roy DP, Kovalsky V, Zhang HK, Vermote EF, Yan L, Kumar SS and Egorov A. 2016. Characterization of Landsat-7 to Landsat-8 reflective wavelength and normalized difference vegetation index continuity. Remote Sensing of Environment 185: 57-70. doi: 10.1016/j.rse.2015.12.024
Ruf F, Schroth G and Doffangui K. 2015. Climate change, cocoa migrations and deforestation in West Africa: What does the past tell us about the future?. Sustainability Science 10(1): 101–111. doi: 10.1007/s11625-014-0282-4
Sousa D and Small C. 2017. Global cross-calibration of Landsat spectral mixture models. Remote Sensing of Environment 192: 139-149. doi: 10.1016/j.rse.2017.01.033
Schroth G, Läderach P, Martinez-Valle AI, Bunn C and Jassogne L. 2016. Vulnerability to climate change of cocoa in West Africa: Patterns, opportunities and limits to adaptation. Science of The Total Environment 556: 231-241. doi: 10.1016/j.scitotenv.2016.03.024
Schwendenmann L, Veldkamp E, Moser G, Hölscher D, Köhler M, Clough Y, Anas I, Djajakirana G, Erasmi S, Hertel D, Leither D, Leuschner C, Michalzik B, Propastin P, Tjoa A, Tscharntke T and van Straaten O. 2010. Effects of an experimental drought on the functioning of a cacao agroforestry system, Sulawesi, Indonesia. Global Change Biology 16(5): 1515–1530. doi: 10.1111/j.1365-2486.2009.02034.x
Thielen D, Cevallos J, Erazo T, Zurita I, Figueroa J, Quintero J, Matute N, Velásquez G and Puche M. 2015. Dinámica de eventos climáticos extremos en la cuenca del río Portoviejo, Manabí. Revista La Técnica 14: 80-91.
Turbay S, Nates B, Jaramillo F, Vélez JJ and Ocampo OL. 2014. Adaptación a la variabilidad climática entre los caficultores de las cuencas de los ríos Porce y Chinchiná, Colombia. Investigaciones Geográficas, Boletín del Instituto de Geografía 2014(85): 95-112. doi: 10.14350/rig.42298
Vergara W, Ríos AR, Trapido P and Malarín H. 2014. Agricultura y Clima Futuro en América Latina y el Caribe: Impactos Sistémicos y Posibles Respuestas. In: Banco Interamericano de Desarrollo, https://publications.iadb.org/en/publication/16673/agriculture-and-future-climate-latin-america-and-caribbean-systemic-impacts-and 15 p.; accessed: February 2018.
How to Cite
APA
ACM
ACS
ABNT
Chicago
Harvard
IEEE
MLA
Turabian
Vancouver
Download Citation
CrossRef Cited-by
1. Karol Cuenca Zambrano, Henry Pacheco Gil. (2021). Vegetation dynamics and climate variability in the Portoviejo river basin. Revista de la Facultad de Agronomía, Universidad del Zulia, 38(3), p.662. https://doi.org/10.47280//RevFacAgron(LUZ).v38.n3.11.
2. Darwin Mena Rentería, Eydy Michell Espinosa, Paula Carolina Soler, Miguel Cañón Ramos, Freddy Santiago Duarte, Jordi Rafael Palacios González. (2020). Water supply failure probability under influence of climate change—Balsillas river basin case study. Revista Facultad de Ingeniería Universidad de Antioquia, https://doi.org/10.17533/udea.redin.20201008.
3. Carlos Moreno-Miranda, Jeanette Jordán, Raúl Moreno, Pablo Moreno, Jenny Solis. (2019). Protected Designation of Origin and Sustainability Characterization: The Case of PDO Cocoa Arriba. Agriculture, 9(10), p.229. https://doi.org/10.3390/agriculture9100229.
4. Diana Rade-Loor, Marianna Siegmund-Schultze, Francisco Javier Oñate Mancero, Jhonatan Paul Gamboa-Trujillo, Álvaro Cañadas-López, Christian Wehenkel. (2025). Jatropha for Galapagos: Targeted approaches to promoting bioenergy are needed given the different practices and objectives of smallholder farmers. Trees, Forests and People, 20, p.100801. https://doi.org/10.1016/j.tfp.2025.100801.
5. Charles Hans Opoku. (2024). The Role of Certificates and Labels for Cocoa in the Face of Climate Change: A Scientific Review. American Journal of Climate Change, 13(02), p.281. https://doi.org/10.4236/ajcc.2024.132015.
6. Óscar Eduardo Trujillo Obando, José Alfredo Diaz Escobar, Enrique A. Torres. (2025). Aspectos socioeconómicos asociados al manejo hídrico en la cacaocultura del Valle del Cauca, Colombia. Acta Agronómica, 72(4), p.368. https://doi.org/10.15446/acag.v72n4.113615.
7. Carlos Moreno Miranda, Mayra Liliana Paredes , Jenny Elizabeth Escobar Guerrero, José Isaac Molina Sánchez. (2021). Evaluación de la sostenibilidad socio-económica en fincas productoras de cacao en el centro-norte de Ecuador: una propuesta de estrategias inter-organizacionales. Acta Agronómica, 70(2) https://doi.org/10.15446/acag.v70n2.85876.
8. Segundo Vilema-Escudero, Marlon Manya Orellana. (2024). Riesgo climático en los servicios de Salud Local en Ecuador. La Granja, 40(2), p.37. https://doi.org/10.17163/lgr.n40.2024.02.
9. Luis David Vera, Luz Cecilia García‐Cruzatty, María Luisa Izaguirre‐Mayoral. (2022). El Niño–Southern Oscillation hindering effects on self‐pollination of cocoa Nacional clones in Ecuador. New Zealand Journal of Crop and Horticultural Science, 50(1), p.85. https://doi.org/10.1080/01140671.2021.1900292.
10. Ezequiel Zamora-Ledezma, Glenda Leonela Loor Aragundi, Willian Stalyn Guamán Marquines, Michael Anibal Macías Pro, José Vicente García Díaz, Henry Antonio Pacheco Gil, Julián Mauricio Botero Londoño, Mónica Andrea Botero Londoño, Camilo Zamora-Ledezma. (2025). Phytotoxic Effects and Agricultural Potential of Nanofertilizers: A Study Using Zeolite, Zinc Oxide, and Titanium Dioxide Under Controlled Conditions. Journal of Xenobiotics, 15(4), p.123. https://doi.org/10.3390/jox15040123.
11. Amir Lebdioui. (2024). Survival of the Greenest. https://doi.org/10.1017/9781009339414.
12. Luz García-Cruzatty, Francisco Arteaga-Alcívar, Luis Vera-Pinargote, Iris Pérez-Almeida. (2023). Water deficit influence upon pollen grain production in cacao genotypes (Theobroma cacao). Bioagro, 35(1), p.167. https://doi.org/10.51372/bioagro352.9.
Dimensions
PlumX
Article abstract page views
Downloads
License
Copyright (c) 2018 Revista Facultad Nacional de Agronomía Medellín

This work is licensed under a Creative Commons Attribution-NonCommercial-ShareAlike 4.0 International License.
The journal allows the author(s) to maintain the exploitation rights (copyright) of their articles without restrictions. The author(s) accept the distribution of their articles on the web and in paper support (25 copies per issue) under open access at local, regional, and international levels. The full paper will be included and disseminated through the Portal of Journals and Institutional Repository of the Universidad Nacional de Colombia, and in all the specialized databases that the journal considers pertinent for its indexation, to provide visibility and positioning to the article. All articles must comply with Colombian and international legislation, related to copyright.
Author Commitments
The author(s) undertake to assign the rights of printing and reprinting of the material published to the journal Revista Facultad Nacional de Agronomía Medellín. Any quotation of the articles published in the journal should be made given the respective credits to the journal and its content. In case content duplication of the journal or its partial or total publication in another language, there must be written permission of the Director.
Content Responsibility
The Faculty of Agricultural Sciences and the journal are not necessarily responsible or in solidarity with the concepts issued in the published articles, whose responsibility will be entirely the author or the authors.