Published
STATISTICAL INVESTIGATION OF THE GROUNDWATER SYSTEM IN DARB EL-ARBAEIN, SOUTHWESTERN DESERT, EGYPT
STATISTICAL INVESTIGATION OF THE GROUNDWATER SYSTEM IN DARB EL-ARBAEIN, SOUTHWESTERN DESERT, EGYPT
Abdel-Lattif. A.1 and Mohamed El Kashouty2
1 National Research Institute of Astronomy and Geophysics, Helwan, Cairo, Egypt.
2 Cairo university, Faculty of Science, Geology Department
Manuscript received: 8/10/2009 Accepted for publication: 20/12/2009
ABSTRACT
In Darb El Arbaein, the groundwater is the only water resources. The aquifer system starts from Paleozoic-Mesozoic to Upper Cretaceous sandstone rocks. They overlay the basement rocks and the aquifer is confined. In the present research, the performance of the statistical analyses to classify groundwater samples depending on their chemical characters has been tested. The hydrogeological and hydrogeochemical data of 92 groundwater samples was obtained from the GARPAD authority in northern, central, and southern Darb El Arbaein. A robust classification scheme for partitioning groundwater chemistry into homogeneous groups was an important tool for the characterization of Nubian sandstone aquifer. We test the performance of the many available graphical and statistical methodologies used to classify water samples. R-mode, Q-mode, correlation analysis, and principal component analysis were investigated. All the methods were discussed and compared as to their ability to cluster, ease of use, and ease of interpretation. The correlation investigation clarifies the relationship among the lithology, hydrogeology, and anthropogenic. Factor investigation revealed three factors namely; the evaporation process-agricultural impact-lithogenic dissolution, the hydrogeological characteristics of the aquifer system, and the surface meteoric water that recharge the aquifer system. Two main clusters that subdivided into four sub clusters were identified in groundwater system based on hydrogeological and hydrogeochemical data. They reflect the impact of geomedia, hydrogeology, geographic position, and agricultural wastewater. The groundwater is undersaturated with respect to most selected minerals. The groundwater was supersaturated with respect to iron minerals in northern and southern Darb El Arbaein. The partial pressure of CO2 of the groundwater versus saturation index of calcite shows the gradual change in PCO2 from atmospheric to the present aquifer pressures.
Keywords: Groundwater samples, groundwater chemistry, Multivariate analysis, AquaChem, Egypt, Darb El-Arbaein.
RESUMEN
En Darb El Arbaein, el agua subterránea es el único recurso hídrico. El sistema acuífero confinado incluye rocas del Paleozoico-Mesozoico hasta areniscas del cretácico superior sobre el basamento. En esta investigación se probó el desempeño del análisis estadístico para clasificar las muestras de agua subterránea en función de sus características químicas. Datos hidrogeológicos e hidrogeoquímicos de 92 muestras de agua subterránea fueron obtenidas en el norte, centro, y sur de Darb El Arbaein. Se usó un esquema de clasificación robusto para separar químicamente en grupos homogéneos las aguas subterráneas del acuífero de la arenisca de Nubia. Se probaron los rendimientos de varias metodologías graficas y estadísticas para clasificar las muestras de agua, entre ellas análisis de correlación, modo R, modo Q y componentes principales. Las correlaciones aclaran las relaciones entre la litología, la hidrogeología y la influencia antropogénica. La investigación reveló tres factores a saber: evaporación asociada a procesos agrícolas e impacto de disolución litogénica, las características hidrogeológicas del acuífero, y la superficie meteorizada por donde se recarga el acuífero. Se identificaron dos grupos principales subdivididos en cuatro subgrupos que reflejan el impacto de la geología, hidrogeología, posición geográfica, y las aguas residuales agrícolas. El agua subterránea es insaturada con respecto a la mayoría de los minerales seleccionados pero sobresaturada con respecto a los minerales de hierro en el norte y el sur de Darb El Arbaein. La presión parcial del agua subterránea en relación al índice de saturación de calcita muestra un cambio gradual en PCO2 de la presión atmosférica a la presente en el acuífero.
Palabras clave: Muestras de las agua subterránea, química de las aguas subterráneas, Análisis Multivariado, AquaChem, Egipto, Darb El-Arbaein.
1. Introduction
The groundwater represents a resource for multiple uses (General Authority for Rehabilitation Projects and Agricultural Development, GARPAD, 1998-2001). They irrigate 12000 feddans (1 feddan ˜ 1.038 acres) and help 16 villages for farmers along about 400 km from Paris town towards the Egypt-Sudan border. The pumping wells are located in three parts, the northern, the central, and the southern part of Darb El- Arbaein (Fig. 1). The northern part extends 90 km to the south from Paris town and has an area of 90 km2. The central part extends for 80 km to the south of the northern part and has 120 km2 in area. The southern part extends for 200 km to the south of the central part and has 170 km2 in area. The Darb-El Arbaein is located in an arid region, where the absolute maximum- air temperature are 48.6 oC in May and minimum -2 oC in February. The annual rainfall is less than 1.1 mm, the total monthly rainfall is 0.3 mm. The annual evaporation is about 172 mm, and the maximum evaporation rate in June is about 21.32 mm. The northern, middle, and southern Darb El Arbaein aquifer were treated statistically in order to clarify the impact of lithogenic and anthropogenic factors. The saturation indices and partial pressure of CO2 was estimated by AquaChem to delineate the change in pressure from the atmospheric to the current conditions. The statistical analyses and AquaChem (PHREEQC) were used to delineate the impact of lithogenic and anthropogenic sources on aquifer system. AquaChem (PHREEQC version 2) is a computer program written in the C programming language that is designed to perform a wide variety of low-temperature aqueous geochemical calculations.

1.1 Geomorphology and geological setting
Darb El- Arbaein is subdivided into three geomorphologic units, the southern Naklai-Sheb peneplain; the western Atmur peneplain; and a plateau surface (Issawi 1971).
Geologically, the exposed rocks range from Pre-Cam-brian to Quaternary sediments (CONOCO 1989). The lithostratigraphic successions are divided into seven units, from base to top (CONOCO 1989, Fathy et al., 2001, Korany et al., 2002, Ghazal, 2002 and El-Gammal, 2004):
1) PreCambrian basement; 2) Paleozoic-Mesozoic sandstone; 3) Lower Cretaceous; 4) Upper Cretaceous; 5) Paleocene; 6) Eocene; and 7) Quaternary. The Nubian sandstone is classified into Shab, Qusier, and Taref members (Issawi 1973). The Kisieba Formation is equivalent to both Shab and Qusier members and Taref is equivalent to Taref member (CONOCO 1989). The lithostratigraphic sequence in the northern, central, and southern part of Darb El-Arbaein is shown in Table 1. The sedimentary cover increases far in the northern part (more than 100 m), while it increases to the southern part of the northern Darb-El Arbaein. There is a little thickness variation in the southern Darb El Arbaein. The Dakhla shale represents the capping aquifer only in the central Darb El-Arbaein. The Darb El-Arbaein area is related structurally to the Red Sea and southwestern regions (EGSMA 1987a and b). Issawi (1971) has identified the faults in E-W, NE-SW and NW-SE and three anticlines (Bir Kiseiba, Rage, and Shirshir). The uparching of basement rocks is encountered (Fathy et al., 2002).

1.2 Hydrogeological conditions
92 wells were designed by GARPAD in the period from 1998 to 2001, with depths from 130 to 535 m. They penetrated the Nubian sandstone successions (Paleozoic-Upper Cretaceous), which overlay Pre-Cambrian basement rocks. The generalized hydrogeological section indicates that the area is dissected by 18 normally -exposed faults and concealed faults (Fathy et al., 2002). The central area bordered by Gabal Abu Rayan El-Bahari from the north and the Kiseiba anticline from the south. The natural recharge of the aquifer system in the Western Desert is thought to be of about 1.5 billion m3/y (Ambroggi, 1966), while groundwater flow from Libya to Egypt is about 3.782 million m3/y (Ezzat and Abu Atta, 1974). The groundwater believed to have accumulated and preserved in the Nubian sandstone aquifer since 10000 y BC or even earlier as revealed by C14 and H3isotopes (German Water Group, 1977). The stored water in Nubian sandstone is mainly fossilized water and ranges from 20000 to 40000 y (Shata et al., 1962 and Shata 1982).
1.2.1 Northern Darb El Arbaein
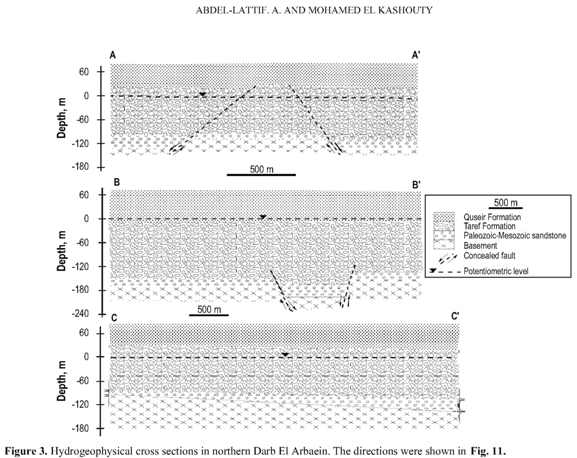
The aquifer is composed of sandstone of Qusier and Taref Formations and Paleozoic-Mesozoic sandstone layers. The upper-most layer of Qusier Formation act as confining layer. The aquifer thickness increases to the northern part. The aquifer is underlain by basement rocks. The latter is become deeper northward indicating the influence of concealed faults (NW-SE) and the increase of sedimentary cover to the north (Fathy et al., 2002). The groundwater flows to the eastern, northern, and northeastern part (Fig. 2a). The hydraulic conductivity (Fig. 2b) and transmissivity (Fig. 2c) increases to the northern, northwestern, and southwestern part of the northern Darb El Arbaein. The well efficiency ranges from 61 to 71% at discharge 150 m3/h. The northern Darb El Arbaein is dissected by normal faults (mostly NW-SE). These faults increase the sedimentation to the north and northeast. The vertical displacement of formations along fault plane makes juxtaposition of permeable against impermeable layers. It influences aquifer thickness, precipitation/dissolution, and groundwater salinity. Such displacement diminishes the hydrogeological characteristics of the aquifer system towards the south and south-east. The hydrogeophysical cross sections (A-A'), (B-B'), and (C-C') (Fig. 3) revealed that the boreholes fully penetrated the Nubian sandstone successions (Paleozoic-Upper Cretaceous). The latter overlie the Pre-Cambrian basement rocks (El Gammal 2004). The Nubian sandstone succession is built up of Qusier Fm., Taref Fm., and Paleozoic-Mesozoic sandstone layer. The sediments gets up finest upward, the Taref Fm. is more permeable than the Qusier Fm.

1.2.2 Central Darb El Arbaein
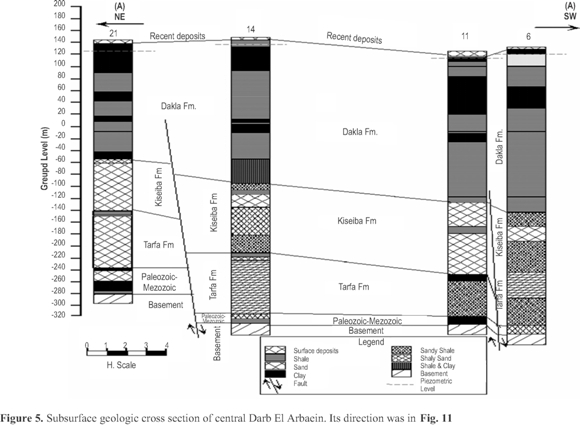
The groundwater flows from the northern and northwestern part towards the southeastern part (Fig. 4a). The Dakhla shale thickness increases in the southern part (Fig. 4b) of the central Darb El Arbaein. The hydraulic gradient has changed in the studied area, attributed to structural patterns and lithological changes. The water level dropped about 30 m (average) in 2005 compared in 2000, because of high pumping, increase in wells, and low recharge. The effective porosity of sand layers ranges from 21 to 30%, transmissivity ranges from 280 to 540 m2/d, and storativity ranges from 0.00011 to 0.0009. The aquifer facies (Nubia facies) are represented by the Paleozoic- Mesozoic sandstone layers and Upper Cretaceous rock units (Taref and Kiseiba Formations) (Fig. 5) (El Sayed 2005). The basement rocks form the base of the aquifer, while the Dakhla Formation acts as impermeable. The thickness of this aquifer ranges between 200 and 230 m.

1.2.3 Southern Darb El Arbaein
The aquifer is built of Kiseiba and Taref Formations of the Upper Cretaceous (Fathy et al., 2001). The upper -most layer of Kiseiba Formation act as confining layer. The aquifer thickness increase in the southern part, attributed to high concentration of faults to the north. The aquifer is composed of coarse grained sandstone at the base that changes gradually to fine and medium upward. It directly overlies the basement rocks. The groundwater flow is in the northeastern part (Fig. 6a). The capping thickness increases to the northwestern part(Fig. 6b). The hydraulic conductivity (Fig. 6c) increases in the southern, northern, western, and central-eastern part. The transmissivity (Fig. 6d) increases to the southern and southwestern part. The well efficiency at pumping rate 150 m3/h ranged from 84 to 86 %. The geophysical cross section (A-A') runs N-S direction (Fig. 7a).


The total aquifer thickness ranged from 70 to 138 m and increases due the southern direction of southern Darb El Arbaein. The graben and horst were interpreted in the area (Fig. 7). The Taref and overlying Kiseiba Fms. are hydraulically interconnected through the faults (El Gammal 2004). The geophysical cross section (B-B') runs W-SE direction (Fig. 7b). The aquifer thickness increases due the central part, attributed to structural elements. The aquifer is hydraulically interconnected with fault planes.
2. Materials and Methods
The obtained hydro-chemical and hydro-geological data (2002-2004), after GARPAD organization, were analyzed using statistical and AquaChem (PHREEQC).
3. Multivariate statistical analyses
3.1 Introduction
The chemical composition of groundwater is controlled by different factors such as precipitation, mineralogy ofthe watersheds and the aquifer lithology, the climate, the topography, and land use application especially agricultural and industrial activities. The groundwater samples from the area could potentially represent a variety of water types providing an opportunity to test the performance of many of the available graphical, hydrogeochemical and hydrogeological programs, and statistical techniques. The use of the major ions as natural tracers (Back, 1966) has become a very common method to delineate flow paths in aquifers. Generally, the approach is to divide the samples into hydrochemical facies that is, groups of samples with similar chemical characteristics that can then be correlated with location. The spatial variability observed in the composition ofthe natural tracers can provide insight into aquifer heterogeneity and connectivity as well as the physical and chemical processes controlling water chemistry. Several commonly used graphical methods and multivariate statistical techniques are available including Pie, Stiff, Q-mode, R-mode hierarchical (HCA) (Judd, 1980; Rummel, 1970; Berry, 1995; Guler etal.,2002) and Principal component analysis (PCA). For understanding the chemistry of water samples, the multivariate statistical analyses were used (Drever, 1997) with assumptions of Alther (1979). The Hierarchical Cluster Analysis (HCA) analyses (StatSoft, Inc. 1995) were used to classify the samples into distinct hydrochemical groups based on their similarity, using Z scores (Ward 1963). In order to make clear the other factors affecting the concentration and distribution of major ions and hydrogeological parameters here, Multivariate statistics (Pearson Coefficient Analysis and principle component analysis) were adopted. Principle Component Analysis is one ofthe analytical tools used to assess element behavior in aquatic system (Shine et al.1995; Ruiz 2001; Liu et al. 2003; Zhou et al. 2004), and it is applied to detect the hidden structure of the data set, trying to explain the influence of latent factors on the data distribution (Einax and Soldt 1999; Simeonov et al. 2000).
3.2 Correlation analysis
The ground elevation is weakly inversely correlated with water depth, well loss (0.5-0.53), delineate the impact of topography on the well loss. The ground elevation is strongly negatively correlated with K, suggesting that the latter has a lithogenic source rather than anthropogenic. The hydro-geological characteristics of the aquifer system improved in the topographic and potentiometric head highs. The ground elevation is correlated with SO4; indicating anthropogenic origin, especially agricultural activity. Also the dissolution of evaporite minerals contributes to SO4 content in groundwater. Water depth is negatively correlated with potentiometric head, electrical conductivity, total dissolved solids (TDS), Na, SO4, and Cl, clarify the impact of agricultural activity infiltrated downward, dissolution of geomedia and evaporation rate that contributed to these ions in groundwater system and depends upon water depth. Water depth is weakly correlated with K, confirming the lithogenic source for latter. Potentiometric head is negatively correlated with well loss, the latter decreases in the highest potentiometric head in the aquifer system. Therefore, the contribution of well loss to drawdown is minimal in the highest potentiometric heads. The latter is weakly correlated with SO4, indicate different sources may lithogenic (evaporite, shale, and clay) and anthropogenic (mainly fertilizers).
The potentiometric head is strongly correlated with transmissivity, hydraulic conductivity, and discharge rate, caused by dissolution of geo-media that increases with potentiometric heads. Therefore, the aquifer permeability and transmissivity was enhanced in the hydraulic head highs. Hydraulic conductivity is weakly negatively correlated with drawdown, K, and well loss, showing the impact of geology (hydraulic conductivity) on these parameters. The drawdown increases with decreasing of hydraulic conductivity of the aquifer system and K is liberated by dissolution. Hydraulic conductivity is strongly correlated with discharge rate. This is attributed to good yield and should be in high hydraulic conductivity areas. The aquifer system is heterogeneous so such discharge rate distribution depends on the hydraulic conductivity values. Drawdown is weakly correlated with well loss; showing that the well loss contributed little to drawdown. Drawdown is strongly correlated with formation loss; such correlation confirms that drawdown is mainly influenced by a change in hydraulic conductivity of the formation (formation loss). Drawdown in wells is composed mainly of two components, the formation loss and the well loss. Electrical conductivity is weakly negatively correlated with K, reflect that the latter is partially derived from lithogenic, i.e. from dissolution of clay and shale sediments.
Electrical conductivity is strongly correlated with TDS, Ca, Na, SO4, and Cl, indicating two main processes that responsible for these ions concentrations, evaporation and agricultural wastewater. Electrical conductivity is weakly correlated with Mg and HCO3, clarifying that the last two are partially lithogenic and partially anthropogenic. Ca is weakly correlated with K, reflect two sources for both may anthropogenic for former and lithogenic for latter. Ca is weakly correlated with Na, SO4, and Cl, these ions may derive partially from evaporation and partially from agricultural wastewater and dissolution. Cl is weakly correlated with HCO3, attributed partially to evaporation and partially to infiltration of wastewaters. Mg is weakly correlated with Na, SO4, and Cl indicating that different sources for these ions may be lithogenic and anthropogenic. Na and K are negatively correlated, due to different sources. Na is weakly and strongly correlated with HCO3 and SO4 and Cl, respectively. It is attributed to partially infiltration of surface meteoric water and mainly evaporation and agricultural wastewaters, respectively. K is weaklynegativelycorrelated with SO4, Cl, and discharge rate, indicate different sources. On the other hand, K weakly correlated with well loss, reflect the influence of lithology on well loss. HCO3 is weakly correlated with Cl, attributed to the lithogenic and anthropogenic sources. SO4 is strongly correlated with Cl, demonstrating that both ions are indeed highly correlated in waters from agricultural areas and also the dissolution of evaporate minerals.
3.3 Factor identification
R-mode (interrelationships among variables) and Q-mode (interrelationships among cases) applications can provide a certain amount of insight into the structure of the data matrix (Davis, 1986). R-mode from the similarity matrix, the principal component and the distribution of variables were determined. Fig. 8 shows the principal components, weights of the components, and associated variance explained in the physio-chemical data and communalities. However the variables have high communalities and every variable is represented in the model application of this method. For the Nubian sandstone aquifer, the spatial distribution of variables based on the three components is presented in Fig. 8. The three factors explain 77% of the variance with eigenvalues higher than 1.8. The variance percentage and the eigenvalues for each factor are shown in Fig. 8.F1is positively loaded with EC, TDS, Ca, Mg, Na, HCO3,SO4, Cl, and formation loss. Such factor represents evaporation process, agricultural impact, and partially lithogenic dissolution. The presence of formation loss in F1 confirm the precipitation/or dissolution processes enhance the aquifer permeability and therefore transmissivity. F1 is negatively loaded with water depth and K, indicating that the latter derived from lithogenic source especially clay and shale dissolution. The negatively loaded of water depth also confirms the impact of anthropogenic sources and evaporation process and influenced by water depth. F2 is positively loaded with ground elevation, hydraulic head, hydraulic conductivity, and discharge; clarifying the hydrogeological characteristics of the aquifer system included together in one factor. F2 is negatively loaded with drawdown, K, formation loss, and well loss, reflecting the different trends in these parameters with hydrogeological characteristics. The K included in F2, confirm its lithogenic source. The increase in discharge rate impact on well efficiency (formation loss and well loss), and drawdown and influence on future outcomes. F3 is negatively loaded with pH and HCO3, clarifying the different surface meteoric water that recharge the aquifer, from regional freshwater from the surrounding aquifers, infiltration water, dissolute water, and evaporation.

3.4 Cluster Analysis
The dendrogram investigation, based on hydrogeological and hydrogeochemical data of Nubian sandstone aquifer(Fig. 9), indicates two main clusters (I and II). Cluster I subdivided into two sub clusters 1 and 2. Sub cluster 1 subdivided into two groups (A and B) and five independent cases. Group A include eleven samples 34, 44, 46, 47, 48, 49, 50, 51, 52, 65, and 66 (northern part of southern Darb El-Arbaein). Group A is characterized by the high hydraulic head and low Mg content (Fig. 10a and b). Group B contains fourteen samples 56, 57, 58, 59, 60, 61, 62, 63, 64, 67, 69, 70, 71, and 72 (northeastern and southwestern part of southern Darb El Arbaein). It is distinguished by the highest ground elevation, hydraulic conductivity, and transmissivity (Fig. 10a). The southern Darb El Arbaein was contained in the two groups A and B (Fig. 11). Group A and B have the highest hydraulic head among the groups (Fig. 10a). The independent cases 53, 54, and 55 were characterized by high ground elevation, hydraulic conductivity and transmissivity (Fig. 10c). Independent cases 45 and 68 were distinguished by lowest pH and lowest drawdown, respectively (Fig. 10c and d). The previous independent cases were included in sub cluster 1. Sub cluster 2 subdivided into two groups (C and D) and five independent cases. Group C was represented by ten samples 17, 18, 20, 35, 36, 37, 38, 39, 40, and 41 (northeastern part of Field 2 of central Darb El Arbaein). It has high TDS concentration and highest Ca content (Fig. 10a). Group D is composed of eleven samples 21,22,23,24, 25, 26, 27, 28, 31, 32, and 42 (eastern part of Field 2 of central Darb El- Arbaein). It is characterized by the highest TDS and major ion contents among the groups (Fig. 10a). Field 2 of central Darb El Arbaein was included in the two groups C and D (Fig. 11). The independent cases 19, 29, 30, 33, and 34 (sub cluster 2) were distinguished by the highest total dissolved solids all over the area (Fig. 10d). The last samples was included in the field 2 of central Darb El Arbaein (Fig. 11), they reflect the lithogenic and anthropogenic impact. Cluster II subdivided into two sub clusters (3 and 4). Sub cluster 3 includes two independent cases 86 and 87, which has the lowest K concentration and the lowest hydraulic conductivity (Fig. 10c and d). Sub cluster 4 is subdivided into six groups (E to J) and one independent case. Group E contains four samples 1, 12, 15 (Field 1 of central Darb El-Arbaein), and 91(northern Darb El Arbaein). It is characterized by the lowest TDS concentration and very high transmissivity (Fig. 10a and b). Group F was represented by six samples 77, 78, 80, 81, 82, and 89 (northern Darb El Arbaein). It has the lowest hydraulic conductivity and transmissivity and highest drawdowns (Fig. 10a). Group G include three samples 2, 10 (Field 1 of central Darb El-Arbaein) and 83 (northern Darb El Arbaein). It is characterized by high transmissivity (Fig. 10a). Group H contains five samples 4, 5, 6, 7, and 9 (Field 1 of central Darb El-Arbaein). It is characterized by very low hydraulic head (Fig. 10a).Group I was represented by four samples 73, 74 (southern part of southern Darb El- Arbaein) 76, and 79 (northern Darb El- Arbaein). It is characterized by the highest K content (Fig. 10b), may attributed to aquitard diffusion. Group J include eleven samples 3, 8, 11, 13, 14, 16 (Field 1 of central Darb El- Arbaein), 75, 85, 88, 90, and 92 (northern Darb El Arbaein). Group J is characterized by the highest water depth and very low TDS concentration (Fig. 10a and b). The independent case 84 was characterized by lowest Cl concentration and very high transmissivity (Fig. 10c and d). The Pie, radial, and Stiff methods produce a single diagram for each sample. It is not practical to produce and nominally sort all samples figures, so the choice of similarity would be based on evaluation of the analyst, which is highly subjective; herein it is the multivariate statistical analysis.


4. Saturation indices and partial pressure estimation
Calculation of a mineral saturation index (SI) is a convenient method of representing the equilibrium condition of a solution with respect to a mineral. Saturation index (SI) = log IAP/Kmineral K is the solubility product defines as the solubility constant and calculated by the law of mass action (Appello and Postma 1976). Here, SI = 0, if the mineral is in equilibrium with the solution; SI<1, if the mineral is under-saturated and SI>1; if the mineral is over-saturated. By using the saturation index approach, it is possible to predict the reactive mineralogy of the subsurface from the ground-water data without collecting samples of the solid phase and analyzing the mineralogy. The saturation indices of selected minerals are illustrated in Fig. 12, the groundwater in all is undersaturated with respect to these minerals; delineate the low concentration of these minerals in the geomedia. The groundwater was supersaturated with respect to iron minerals in northern and southern Darb El Arbaein (Fig. 12); reflect the presence of iron concentration in the sandstone aquifer. The partial pressure ofthe groundwater versus saturation index of calcite is depicted in (Fig. 13) to show the gradual change in PCO2 from atmospheric to the present aquifer pressures.
5. Conclusions and recommendations
The geology, the hydrogeology, the dissolution, and the recharge influence the aquifer quality. The graphical and statistical techniques reflected valuable and rapidly accessible information about the chemical composition ofgroundwater samples. The correlation investigation indicated the agricultural impact on groundwater systems. The factor analysis distinguished into three factors that explain the hydrogeochemical processes in aquifer systems. The Dendrogram investigation revealed two main clusters, which subdivided into four sub clusters, depending on the water chemistry and hydrogeological conditions. The groundwater was under-saturated with respect to carbonate minerals and others except the iron minerals in northern and southern Darb El Arbaein, it was supersaturated.
6. Acknowledgement
The authors are greatly thanks the GARPAD organization for data supply.
References
Alther, A. 1979. A simplified statistical sequence applied to routine water quality analysis: a case history. Ground Waterv17, 556-561.
Ambroggi, R. 1966. Water under the Sahara: Scientific American, v 214, no 5.
Appello C. and Postma D., (1976). Geochemistry, ground-water and pollution. A.A. Balkema, Rotterdam, Netherlands, 536p.
Back, W. 1966. Techniques for mapping of hydro chemical facies. US Geol Surv Porf pap 380-382.
Berry, K. 1995. Spatial reasoning for effective GIS. GIS World Books, Fort Collins, Colardo.
Bierschenk, W. 1964. Determining well efficiency by multiple step drawdown test. Publication 64. International Association of Scientific Hydrology.
Continental Oil Company (CONOCO, 1989). Geologic map of Egypt, scale 1; 500000.
Davis, J.C. 1986. Statistics and data analysis in geology: John Wiley and Sons, NY, Tornto-Singapore.
Drever, I. 1997. The geochemistry of natural waters, 3rd edn. Prentice-Hall, Upper Saddle River, NJ.
El Gammal, N. 2004. Hydrogeological studies in Darb El Arbaein area, south Egypt. Master science, Geology Department., Cairo university, 151p.
El Sayed, E. 2005. Groundwater conditions, Nubia sandstone aquifer, south of Gebel Abu Rayan El Baharai, Darb El Arbaein area, western Desert, Egypt. 4th Intern Conf on the geo of Africa, v 1, pp.57-78.
Einax, J. and Soldt, U. 1999. Geostatistical and multivariate statistical methods foe the assessment of polluted soils-merits and limitations. Chemomet Intell Lab Syst v46, 79-91.
Ezzat, M., AbuAtta, A. 1974. Exploration ofgroundwaterin El Wadi El Gedid project area (New valley), part II, Hydrogeological conditions. Dakhla - Kharaga area; Ministry of agriculture and land Reclamation, Cairo.
Fathy R., Hefnawy M. and Abdel Hamid A. 2001. Contributions to the hydrogeology aspects of the groundwater aquifer in southern part of Darb El Arbaein area, southern portion of Western Desert, Egypt. Al Azhar Bull Sci v12no2, 175-194.
Fathy, R., El Nagaty, M., Atef, A. and El Gammal, N. 2002. Contribution ofthe hydrogeological and hydrochemical charateteristics of Nubian sandstone aquifer in Darb El Arbaein, southwestern Desert, Egypt. Al Azhar Bull Sci v13no2; 69-100.
General Authority for Rehabilitation Projects and Agricultural Development (GARPAD), 98/2001. Lithologic logs and geophysical logs of water wells, Darb El-Arbaein area, southwestern Desert, Egypt.
General Survey of Egypt, (EGMSA), 1987a. Geology and geomorphology of the Egyptian component transitional sandstone project; Report to groundwater research Institute, Egypt.
General Survey of Egypt (EGMSA), 1987b. Geophysical investigation of the Egyptians component transitional sandstone project; Report to groundwater research Institute, Egypt. Pp 425-447.
German Water Group, 1977. Hydrogeological study of groundwater resources in the Kufra area; German Water Engineers, GB, v 5.
Ghazal, A. 2002. Hydrogeological studies in Darb El Arbaein area, southwestern Desert, Egypt. Master science, Geology department Cairo University, 167p.
Guler, G., Geophrey, D., and McCray, J. 2002. Evaluation of graphical and multivariate statistical methods for classification of water chemistry data. Hydrogeology Journal, 10: 455-474.
Issawi, B. 1971. Geology of Darb El Arbaein, western Desert, Egypt. AnnGSE,Cairo, v 46; 120p.
Issawi, B. 1973. Geology of southeastern corner of western Desert. AnnGSE, Cairo, v VIII.
Judd, G. 1980. The use of cluster analysis in the derivation of geotechnical classification. Bull Assoc. Eng. Geol. v17, 193-211.
Korany, E., Fathy, G. and El Nagaty, M. 2002. Contributions to the hydrogeology of Nubian sandstone aquifer in the middle part of darb El Arbaein, southwestern Desert, Egypt. Sedimentaology of Egypt, ISSN 1110-2527, J of the Sedimentaological Society of Egypt, v 10; 119-143.
Liu, X, Li, X., Shen, Z., Wang, D., Wai, O, and Li, Y. 2003. Multivariate statistical study of heavy metal enrichmnmet in sediments of the Pearl River Estuary. Environ Pollut 121: 377-388.
Ruiz, F. 2001. Trace metal in estuarine sediments from the southwestern Spanish coast. Mar Pollut Bull 42 (6): 1843-1857.
Rummel, J. 1970. Applied factor analysis, Northwestern University Press, Evanston.
Shata, A., Knetsch, G. and El Shazly, M., (1962). The geology, origin, and age of the groundwater supplies in some desert areas of UAR: Bull Inst Desert, El Matariya, Cairo, v XII no 2: 61-124.
Shata, A. 1982. Hydrogeology of the great Nubian sandstone basin; Quaternary of Engineering, London, v 15; 127-133.
Shine, J., Ika, R, and Ford, T. 1995. Multivariate statistical examination of spatial and temporal patterns of heavy metal contamination in New Bedford Harbour marine sediments. Environ Sci Technol 29: 1781-1788.
Simeonov, V., Massart, D., Andreev, G., and Tsakovski, S. 2000. Assessment of metal pollution based on multivariate ststistical modeling of hot spots sediments from the Black Sea. Chemosphere v41, 1411-1417.
StatSoft, Inc. 1995. Statistica for windows (computer program manual), vo. 3, StatSoft, Inc., Tulsa, OK.
Ward, H. 1963. Hierarchical grouping to optimize an objective function. J Am Stat Assoc 69, pp. 236-244.
Zou H., Peng, X, and Pan, J. 2004. Distribution, source, and enrichment of some chemical elements in sediments of the Pearl River Estuary. China Continental Shelf Res v24, 1857-1875.
How to Cite
APA
ACM
ACS
ABNT
Chicago
Harvard
IEEE
MLA
Turabian
Vancouver
Download Citation
Article abstract page views
Downloads
License
Earth Sciences Research Journal holds a Creative Commons Attribution license.
You are free to:
Share — copy and redistribute the material in any medium or format
Adapt — remix, transform, and build upon the material for any purpose, even commercially.
The licensor cannot revoke these freedoms as long as you follow the license terms.