Plant pre-breeding for increased protein content in soybean Glycine max (L.) Merrill
DOI:
https://doi.org/10.15446/acag.v66n4.57137Keywords:
Plant breeding, molecular markers, QTL, soybean genotypes, protein contein (pt)
The aim of this research were to determine protein content and genetic divergence of soybean genotypes in QTL regions of the trait grain protein content for plant breeding purposes. Twenty-nine soybean genotypes were grown in the field in four environments (Viçosa-MG Dec/2009, Visconde do Rio Branco-MG Feb/2010, São Gotardo-MG Feb/2010, and São Gotardo-MG Oct/2011) using the randomized block design with three replicates. The grain protein content was quantified by the infrared spectrometry method. The genetic divergence was estimated by the analysis of 39 microsatellite markers from QTL regions for the soybean grain protein content. The pairs of genotypes with greater genetic distances and protein contents were as follows: BARC-8/CS3032PTA276-3-4 (D=0.71) (45.18%/44.31%); BARC-8/CS3032PTA276-1-2 (D=0.71) (45.18%/43.75%); BARC-8/CS3032PTA190-5-1 (D=0.71) (45.18%/43.63%); B3PTA382-2-10/CS3032PTA276-3-4 (D=0.62) (43.80%/44.31%); CS3032PTA276-1-2/B3PTA382-2-10 (D=0.62) (43.75%/43.80%); B3PTA382-2-10/CS3032PTA190-5-1 (D=0.62) (43.80%/43.63%); B3PTA216-1-9/CS3032PTA276-3-4 (D=0.61) (43.48%/44.31%); and B3PTA216-1-9/CS3032PTA276-1-2 (D=0.61) (43.48%/43.75%), respectively. Other promising combinations for the improvement of protein content were as follows: BR8014887/CS3032PTA190-5-1 (D=0.57) (44.71%/43.63%); BARC-8/CS3032PTA182 (D=0.78) (45.18%/41.84%); BR8014887/CS3032PTA182 (D=0.65) (44.71%/41.84%); BR8014887/PI417360 (D=0.76) (44.71%/41.01%), respectively; and PI417360/B3PTA216-1-9 (D=0.80) (41.01%/43.48%). These pairs of genotypes when crossed should produce populations with higher means and genetic variances and greater gains with selection.
Recibido: 24 de abril de 2016; Aceptado: 6 de abril de 2017
Abstract
The aim of this research were to determine protein content and genetic divergence of soybean genotypes in QTL regions of the trait grain protein content for plant breeding purposes. Twenty-nine soybean genotypes were grown in the field in four environments (Viçosa-MG Dec/2009, Visconde do Rio Branco-MG Feb/2010, São Gotardo-MG Feb/2010, and São Gotardo-MG Oct/2011) using the randomized block design with three replicates. The grain protein content was quantified by the infrared spectrometry method. The genetic divergence was estimated by the analysis of 39 microsatellite markers from QTL regions for the soybean grain protein content. The pairs of genotypes with greater genetic distances and protein contents were as follows: BARC-8/CS3032PTA276-3-4 (D=0.71) (45.18%/44.31%); BARC-8/CS3032PTA276-1-2 (D=0.71) (45.18%/43.75%); BARC-8/CS3032PTA190-5-1 (D=0.71) (45.18%/43.63%); B3PTA382-2-10/CS3032PTA276-3-4 (D=0.62) (43.80%/44.31%); CS3032PTA276-1-2/B3PTA382-2-10 (D=0.62) (43.75%/43.80%); B3PTA382-2-10/CS3032PTA190-5-1 (D=0.62) (43.80%/43.63%); B3PTA216-1-9/CS3032PTA276-3-4 (D=0.61) (43.48%/44.31%); and B3PTA216-1-9/CS3032PTA276-1-2 (D=0.61) (43.48%/43.75%), respectively. Other promising combinations for the improvement of protein content were as follows: BR8014887/CS3032PTA190-5-1 (D=0.57) (44.71%/43.63%); BARC-8/CS3032PTA182 (D=0.78) (45.18%/41.84%); BR8014887/CS3032PTA182 (D=0.65) (44.71%/41.84%); BR8014887/PI417360 (D=0.76) (44.71%/41.01%), respectively; and PI417360/B3PTA216-1-9 (D=0.80) (41.01%/43.48%). These pairs of genotypes when crossed should produce populations with higher means and genetic variances and greater gains with selection.
Key words:
Plant breeding, molecular markers, QTL, soybean genotypes, protein contein.Resumen
Los objetivos de este estudio fueron analizar el contenido de proteína y la diversidad genética de genotipos de soya en regiones de QTL del contenido de proteína para fines de mejoramiento genético. Veintinueve genotipos fueron cultivados en el campo en cuatro ambientes (Viçosa-MG Dec/2009, Visconde do Rio Branco-MG Feb/2010, São Gotardo-MG Feb/2010, y São Gotardo-MG Oct/2011), utilizando un diseño de bloques al azar con tres repeticiones. El contenido de proteína se determinó por espectrometría del infrarrojos. La diversidad genética fue estimada por el análisis de 39 marcadores microsatélites de regiones de QTL del contenido de proteína en el grano. Los pares de genotipos con mayores distancias genéticas y niveles proteicos fueron BARC-8/CS3032PTA276-3-4 (D=0,71) (45,18%/44,31%); BARC-8/CS3032PTA276-1-2 (D=0,71) (45,18%/43,75%); BARC-8/CS3032PTA190-5-1 (D=0,71) (45,18%/43,63%); B3PTA382-2-10/CS3032PTA276-3-4 (D=0,62) (43,80%/44,31%); CS3032PTA276-1-2/B3PTA382-2-10 (D=0,62) (43,75%/43,80%); B3PTA382-2-10/CS3032PTA190-5-1 (D=0,62) (43,80%/43,63%); B3PTA216-1-9/CS3032PTA276-3-4 (D=0,61) (43,48%/44,31%); y B3PTA216-1-9/CS3032PTA276-1-2 (D=0,61) (43,48%/43,75%). Otras combinaciones prometedores para mejorar el contenido de proteína son BR8014887/CS3032PTA190-5-1 (D=0,57) (44,71%/43,63%); BARC-8/CS3032PTA182 (D=0,78) (45,18%/41,84%); BR8014887/CS3032PTA182 (D=0,65) (44,71%/41,84%); BR8014887/PI417360 (D=0,76) (44,71%/41,01%); y PI417360/B3PTA216-1-9 (D=0,80) (41,01%/43,48%). Estos pares de genotipos cuando cruzados debe producir poblaciones con mayores medias y varianzas genéticas y mayores ganancias con la selección.
Palabras clave:
Mejoramiento genético vegetal, marcadores moleculares, QTL, genótipos de soya, contenido de proteína.Introduction
The nutritional value of soybean (Glycine max (L.) Merrill) grain is largely due to its protein content. The soybean grains are classified into three categories as follows: hypro, normal or lowpro, respectively, and they must present protein contents superior to 41.5 and 43% based on dry matter to have allowed normal and hypro designations. The Brazilian cultivars have 40% of protein content on average and therefore, lowPro designation. Nevertheless, additional protein content reduction has occurred in the improved cultivars in the last decades (Moraes, José, Ramos, Barros & Moreira, 2006), due among other reasons to the improvement in the yield potential which could have reduced the variability for grain protein content, the selection for high oil content, because the inverse relationship between the levels of oil and protein in the grains, and the negative correlation of protein content with productivity, that although frequent it is usually little expressive.
Until the 80's decade, several studies reported crude protein levels among commercial cultivars. Specifically, in Brazilian cultivars, the analysis reported protein levels with variation and average, respectively, equal to 35.66-41.75% and 36.75% ; 31.0-35.4% and 33.4%; 39-47-47.09% and 40.98%; 24.60-42.39 and 34.62%; 39.5-47.0% and 40.98%; 39.21-43.72% and 41.69% ; 38.43-40.77% and 39.28% (Freiria, Lima, Leite, Mandarino, Silva & Prete, 2016).
In addition to the low protein contents, a high similarity among Brazilian cultivars is reported in the literature. Studies with molecular markers report similarity values and mean similarities equal to 0.01-0.9 and 0.42 (Priolli, Pinheiro, Zucchi, Bajay & Vello, 2010).
Due to the lack of variability for protein content and the narrow genetic base of the improved cultivars, the aim of this research were (1) to determine the protein content and the genetic distances among 29 soybean genotypes from molecular markers of QTL regions of the trait protein content and (2) to select promising parents to increase the protein content and the genetic base of breeding programs aimed to quality. The choice of genetic divergent accessions and with high protein contents for use in crosses can broaden the genetic base and enable additions in the protein content in the new cultivars.
Materials and methods
Twenty-nine soybean genotypes with wide variation in the protein content in the grains, including genotypes with high protein contents, were grown in four field trials (Viçosa, MG/Dec. 2009, 20°45′ S, 42°52′ W; Visconde do Rio Branco, MG/Feb. 2010, 21º00' S, 42º50' W; and São Gotardo, MG/Feb. 2010 and Oct. 2011, 19º18' S, 46º02' W). The randomized block design with three replications was used in the field trials. The list of the 29 genotypes can be found in Table 1.
Average dissimilarity in relation to the twenty-eight remaining genotypes based on the complement of the weighted similarity index.Table 1: Average protein contents on dry basis in the four environments and average dissimilarity estimates of the twenty-nine soybean genotypes based on molecular markers of QTL regions for protein content in soybean.
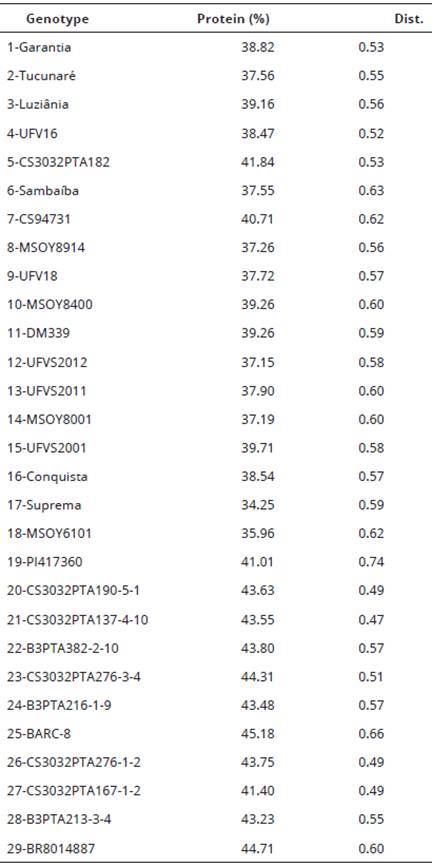
At planting of each trial, 15 seeds were sown per 1 m row and the spacing between rows was 0.5 m. The experiments were harvest manually and the grains were ground in an industrial mill (model MA020 (tm), Marconi). The protein content in the soybean flour was determined by infrared spectrometry using a FT-NIR spectrometer (model Antaris II, Thermo Scientific (tm)).
The combined analysis of variance was performed using the software Genes (Cruz, 2013) and the statistical model proposed in Equation 1.
 Equation 1
Where: Yijk: observation of the k-th block evaluated in the i-th genotype and j-th environment; M: general mean; B/Ejk: effect of the block k within the environment j; Gi: effect of the treatment or genotype i; Ej: effect of the environment j; GEij: effect of the interaction between genotype i and environment j; and Eijk: random error associated to the ijk observation. The effect of genotypes (Gi) was considered fixed and the effect of environments (Ej) was considered random.
The variance components were estimated by the Equations 2 and 3.
 Equation 2
 Equation 3
Where: QMGE is the mean square of genotypes; QMGE is the mean square of the G x E interaction; QMR is the mean square of the residue; e is the number of environments; r is the number of replicates; and l = g (g - 1), where g is the number of genotypes.
The DNA samples were purified from leaves of the soybean genotypes using the Wizard Plus SV Miniprep DNA Purification System kit (Promega(tm)). Thirty-nine microsatellite marker primer pairs were amplified. These microsatellite markers were selected for analysis by being located on QTL regions for protein content in soybean. The QTLs for protein content in the region of the molecular markers are reported at SoyBase (Grant, Nelson, Cannon & Shoemaker, 2010) on linkage groups (LG) A1, B2, C1, C2, D1a, D2, E, F, I, K, L and M, respectively.
The amplification reactions were performed using 10 mM Tris-HCl, pH 8.3; 50 mM KCl; 2 mM MgCl2; 0.1% Triton X-100; 100 µM of each deoxynucleotide; 0.3 µM of each primer; one unit of Taq DNA polymerase, and 30 ng of DNA. The PCR had initial step of 94°C for 4 min, 30 cycles of 94°C for 1 min, 55°C for 1 min and 72°C for 2 min, and a final step of 72°C for 7 min. The amplification products were separated by electrophoresis in 10% vertical polyacrylamide gels using 1X TAE buffer (40 mM Tris-acetate and 1 mM EDTA) and running period of three hours at 140 volts. The polyacrylamide gels were stained with 2% silver nitrate and they were photo-documented with an equipment model L-PIX EX from Loccus Biotechnology manufacturer (tm).
The polymorphism information content of the molecular markers was calculated by the Equation 4.
 Equation 4
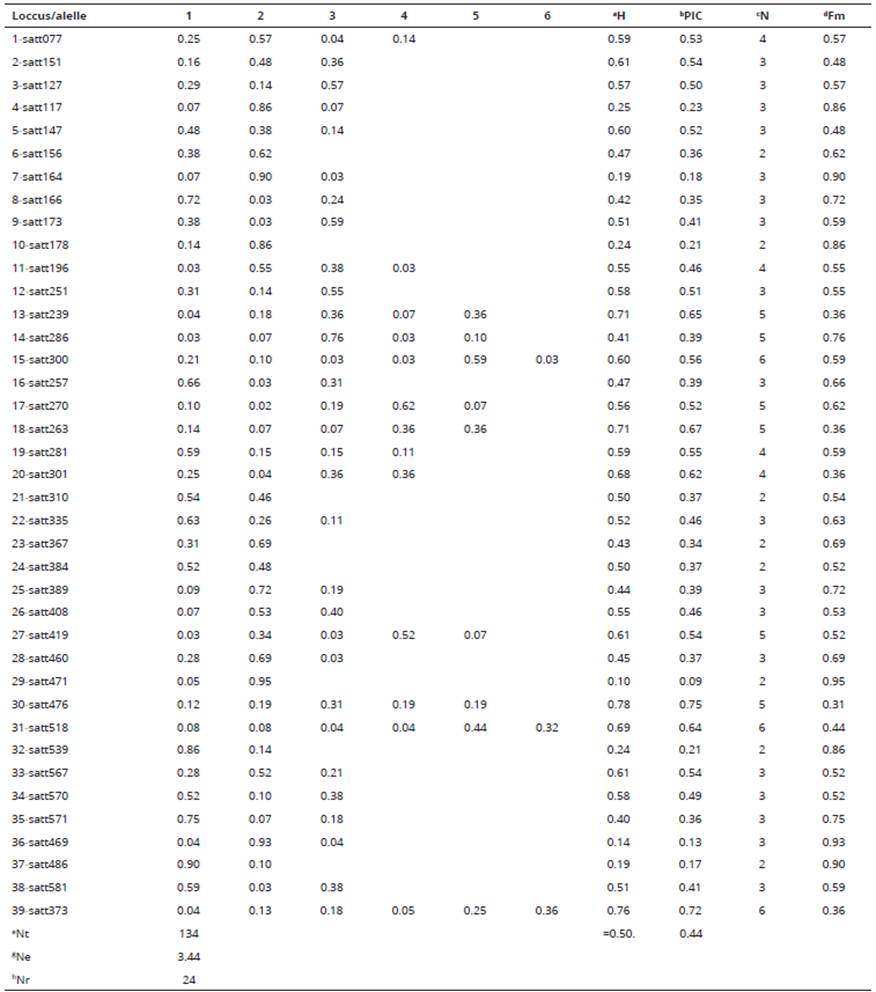
Where: pi refers to the frequency of the i-th allele, and pj, the frequency of the j-th allele, for the studied locus. The dissimilarity matrix was calculated using the complement of the weighted similarity index given by D=1− S ii´ , in which S ii´ = 1 2 j=1 L p j c j , being p j the weight associated to the locus j; a j , the number of alleles of the locus j; A, the number of evaluated alleles; and c j , the number of common alleles between the pairs of accessions i and i ′ . The descriptive calculations can be observed summarized in Table 2.
Table 2: Descriptive analysis of the genetic diversity of the 29 soybean genotypes by analysis of 39 microsatellite markers of QTL regions of the trait grain protein content.
From the estimates of the complement of the weighted similarity index, the genotypes were grouped by the clustering methods UPGMA, Tocher and Tocher modified by Vasconcelos, Cruz, Bhering & Resende Junior, (2007) and the two and three-dimensional projections were obtained from the distance matrix. The genetic distance (Bonato, Calvo, Arias, Toledo & Geraldi, 2006) estimates obtained by the complement of the weighted similarity index from the 39 microsatellite markers were also compared to the estimates obtained by the same index from the microsatellites of linkage group I, linkage group most related to the protein content according to the literature (Grant et al., 2010). All mentioned analyzes were performed with the sotware GENES (r) (Cruz, 2013), to identify significant difference among treatments and statistical significance for all comparisons was made at p<0.05. Tukey's multiple range test was used to compare the mean values of treatments.
Results
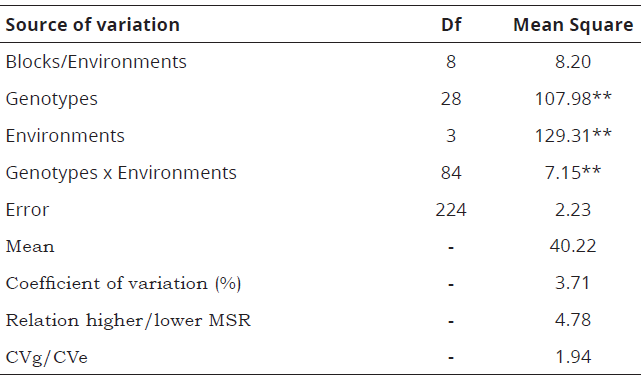
The analysis of variance revealed differences in the protein contents of the genotypes indicating genetic variability, variation in the environments and differential responses of the genotypes in the environments (p = 0.01). The coefficient of variation demonstrated precision in controlling the causes of experimental variation and the ratio between the highest and the smallest residual mean square indicated homogeneity in the residual variances (Table 3).
**Significant at 1% probability by the F-test. Df, degree of freedom. MSR, residual mean square. CVg, coefficient of genetic variation. CVe, coefficient of environment variation.Table 3: Analysis of variance of protein content of the twenty-nine soybean genotypes cultivated at Viçosa, MG (Dec/2009), Visconde do Rio Branco, MG (Feb/2010) and São Gotardo, MG (Feb/ 2010 and Oct/2011).
The variation in the protein contents was from 32.07-45.19%, 33.85-44.1%, 36.23-48.57%, and 33.60-44.63% in the trials conducted in Viçosa, MG (12/2009), Visconde do Rio Branco, MG (02/2010), São Gotardo, MG (02/2010), and São Gotardo, MG (10/2011), respectively. Along the environments, the variation in the protein contents was from 33.86 to 47.35%. BARC-8 (45.18%) followed by BR8014887 (44.71%) had the greatest protein contents based on the overall mean of the four environments and Suprema (34.25%) the lowest protein content.
The genetic distances estimated by the complement of the weighted similarity index ranged from 0.04 to 0.85 and had average equal to 0.57. The highest genetic distance value was estimated for the pairs PI417360/Garantia and PI417360/Conquista (0.85), followed by PI417360/MSOY8400 and PI417360/B3PTA216-1-9 (0.80), with averages of protein content equal to 41,01%/38,82%, 41,01%/38,54%, 41,01%/37,19%, and 41,01%/43,48%, respectively. (Bonato et al., 2006).
Among all combinations of accessions, eight pairs of genotypes had genetic distances greater than 0.60 and protein contents greater than or equal to 43%: BARC-8/CS3032PTA276-1-2 (0.71); BARC-8/CS3032PTA190-5-1 (0.71); BARC-8/CS3032PTA276-3-4 (0.71); CS3032PTA276-1-2/B3PTA382-2-10 (0.62); B3PTA382-2-10/CS3032PTA276-3-4 (0.62); B3PTA382-2-10/CS3032PTA190-5-1 (0.62); B3PTA216-1-9/CS3032PTA276-1-2 (0.61); and B3PTA216-1-9/CS3032PTA276-3-4 (0.61). And among the respective genotypes, BARC-8/CS3032PTA276-3-4, BARC-8/CS3032PTA276-1-2 and BARC-8/CS3032PTA190-5-1 had higher protein contents.
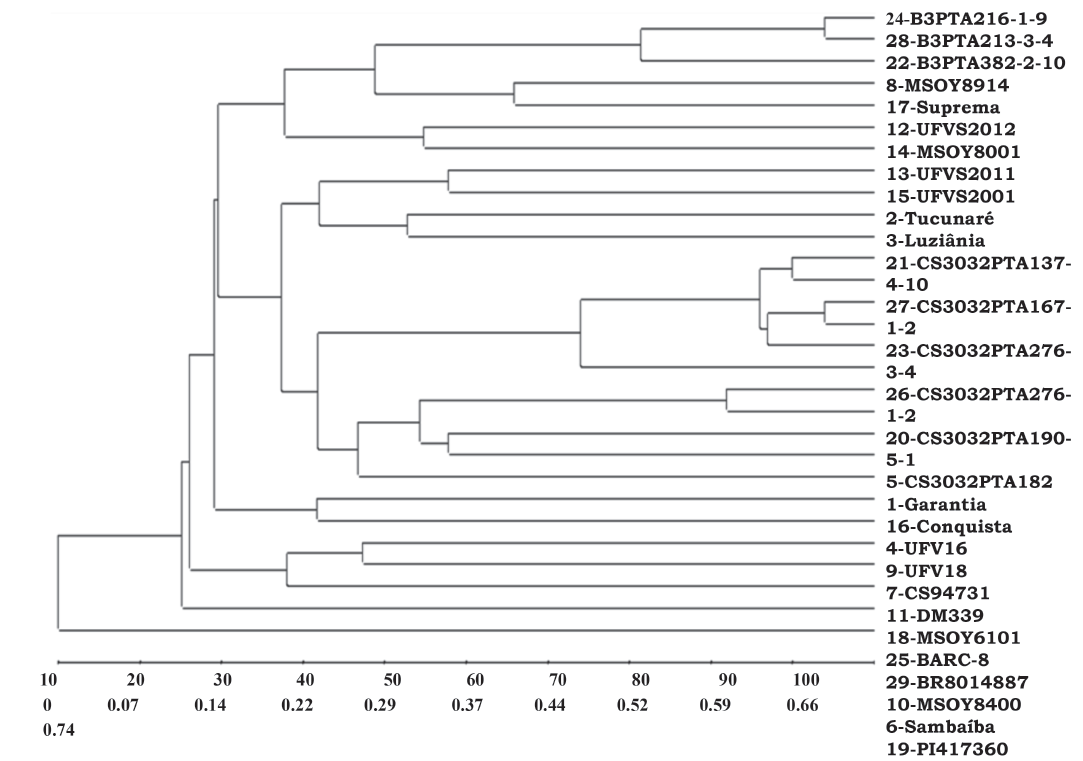
In the clustering by UPGMA method, the PI417360 proved to be the most divergent genotype in relation to most, followed by Sambaíba. The group with BARC-8 and BR8014887, relatively distant in relation to most, gathers the two accessions with the highest protein contents. Two other groups gather the cultivars with the initials B3 and CS303 and the cultivars with the initials UFV and UFVS are grouped in another group, except UFVS2012, which is grouped with MSOY8001. The other cultivars with initials MSOY are not grouped in any group indicating being little genetically related (Figure 1).
Figure 1: Clustering by UPGMA method from genetic distances estimated based on the complement of the weighted similarity index by analysis of molecular markers of QTL regions for protein content in soybean.
At the two and three-dimensional projections there was low adjustment among the original and graphic distances. The values of cophenetic correlation, distortion and stress were 0.56 and 0.69, 40.74 and 18.59%, and 51.40 and 32.52% respectively, which are unsatisfactory values to represent the distance matrix. Nevertheless, some relationships observed in the previous methods are also observed in the respective projections. PI417360 proves to be the most divergent accession in relation to all genotypes and BARC-8 shows relative distance in relation to most.
The analysis of the microsatellite markers of linkage group I indicated variability for the linkage group, which is relevant due to a major effect QTLs for protein content have been mapped on this linkage group in different soybean populations.
Discussion
The molecular markers produced altogether 134 alleles. The number of alleles per locus ranged from 2 to 6 and had average of 3.44. Ten heterozygous were observed according with it is expected for the autogamous species (<1%). The values of polymorphism information content which estimate the informativeness of each locus ranged from 0.1 to 0.75 and had average equal to 0.44. These results are close to the values reported by Mian, Sung-Taeg & Margaret (2009), and Mulato, Möller, Zucchi, Quecini & Pinheiro (2010), when assessing microsatellite markers in elite varieties and accessions of soybean germplasm.
In relation to the genetic divergence of the genotypes, the highest mean dissimilarity was estimated for PI417360 (0.74), followed by BARC-8 (0.66), and the lowest mean dissimilarity was estimated for CS3032PTA-137-4-10 (0.47), followed by CS3032PTA-190-5-1 (0.49). The PI417360, with the highest mean dissimilarity, showed a normal protein content (41.01%). BARC-8, with the second highest mean dissimilarity, in turn, showed the highest protein content among the genotypes (45.18%). And after BARC-8, higher mean dissimilarity values were observed for Sambaíba (0.63), CS94731 (0.62), MSOY6101 (0.62), and BR8014887 (0.62). And between the respective genotypes, only BR8014887 showed a high protein content (44.71%) (Table 3).
The method of Mojema using k = 1.25 (Cruz et al., 2013) indicated a cut at 80.37% of the genetic dissimilarity defining four groups. The first group gathers the cultivars with the initials B3; other group gathers the genotypes with the initials CS and UFV except UFVS2012; DM339 and MSOY6101 form another group, and the remaining group includes BARC-8 and BR8014887 which have high protein contents. The values of cophenetic correlation, distortion and stress in the projection were 0.87, 1.21% and 11.01% respectively, which in turn indicate good adjustment of the original and graphic values. The Tocher method and the method modified by Vasconcelos et al. (2007), establish a unique group, in which the PI417360 and BARC-8 are not grouped due to the higher genetic distances of these genotypes in relation to most.
A single QTL explaining 65% of the variation in protein content was mapped on the linkage group by Sebolt, Shoemaker, & Diers, (2000) and other QTLs were mapped in the same genomic region by Nichols, Lgover, Carlson, Specht & Diers (2006); Bolon, Joseph, Cannon, Graham, Diers, Farmer, May, Muehlbauer, Specht, Tu, Weeks, Xu, Shoemaker & Vance (2010); and Rodrigues, Miranda, Borges, Silva, Good-God, Piovesan, Barros, Cruz & Moreira (2010). In addition, this analysis reveals the presence of genetic variation in the main region of the linkage group I, which is the most reported and related to the protein content in soybean. And when the distances obtained by the complement of the weighted similarity index based on the 39 microsatellites markers were compared to those obtained by the same index based on the microsatellites of linkage group I, the correlation between the estimates was r=0.66. In both analyzes, PI417360/Garantia and PI417360/Conquista were the most divergent pairs of genotypes (0.85), while CS3032PTA-276-3-4/CS3032PTA-276-1-2 and B3PTA-216-1-9/B3PTA-213-3-4 (0.04) were the most similar pairs of genotypes. The proximity in the distance relationships in both cases demonstrates the importance and/or magnitude of the QTL effects in this linkage group.
The genetic diversity estimates can be useful to breeding, because crosses between genetically divergent genotypes are most likely in producing greater genetic variability and heterotic effect. In this way, the genetic divergence can be considered for prediction of the potential of populations in the phase of parentals selection, avoiding populations with low genetic variability. And in this case, greater predictive ability of the genetic variability is expected when the genetic distance estimate is based on QTL regions of the agronomic trait, instead of random regions of the genome (Melchinger, Boppenmaier, Dhillon, Pollmer & Herrmann, 1992; Charcosset, Lefort-Buson & Gallais, 1991).
Molecular markers have been the methodologies preferably used to assess genetic relationships among cultivars due to information of accessions genealogy is incomplete or few times available or detailed enough, and molecular markers have no environment influence alternatively to most agronomic traits (Mulato et al., 2010). In turn, microsatellite markers are the most used markers in genetic diversity studies because of its abundance, high polymorphism level, multiallelism, and codominant inheritance (Rodrigues, Arruda, Cruz, Piovesan, Barros & Moreira, 2015).
Conclusion
The crosses BARC-8 x CS3032PTA276-3-4, BARC-8 x CS3032PTA276-1-2, and BARC-8 x CS3032PTA190-5-1 should produce soybean populations with greater averages and genetic variances for grain protein content and other promising crosses (PI417360 x B3PTA216-1-9, BARC-8 x CS3032PTA182, BR8014887 x PI417360, BR8014887 x CS3032PTA182, and BR8014887 x CS3032PTA190-5-1). Given these concerns, these pairs of genotypes can be donor sources of additive genes to increase soybean grain protein content.
References
References
Bolon, Y., Joseph, B., Cannon, S. B., Graham, M. A., Diers, B. W., Farmer, A. D., May, G. D., Muehlbauer, G. J., Specht, J. E., Tu, Z. J., Weeks, N., Xu, W. W., Shoemaker, R. C. & Vance, C. P. (2010). Complementary genetic and genomic approaches help characterize the linkage group I seed protein QTL in soybean. BMC Plant Biol, 10, 41-64. http://dx.doi.org/10.1186/1471-2229-10-41
Bonato, A. L. V., Calvo, E. S., Arias, C. A. A., Toledo, J. F. F. & Geraldi, I. O. (2006). Prediction of genetic variability through AFLP-based measure of genetic distance in soybean. Crop Breed Appl Biot, 6, 30-39. http://www.sbmp.org.br/cbab/siscbab/uploads/bd6ba09c-4afa-d9cd.pdf.
Charcosset, A., Lefort-Buson, M. & Gallais, A. (1991). Relationship between heterosis and heterozygosity at marker loci: a theoretical computation. Theor Appl Genet, 81 (5), 571-575. http://dx.doi.org/10.1007/BF00226720
Cruz, C. D. (2013). GENES ‑ A software package for analysis in experimental statistics and quantitative genetics. Acta Sci Agron, 35 (3), 271-276. http://dx.doi.org/10.4025/actasciagron.v35i3.21251
Freiria, G. H., Lima, W. F., Leite, R. S., Mandarino, J. M. G., Silva, J. B. D.; Prete, C. E. C. (2016). Produtividade e composição química de soja tipo alimento em diferentes épocas de semeadura. Acta Scientiarum, 38 (3), 371-377. http://dx.doi.org/10.4025/actasciagron.v38i3.28632
Grant, D., Nelson, R. T., Cannon, S. B. & Shoemaker, R. C. (2010). SoyBase, the USDA-ARS soybean genetics and genomics database. Nucleic Acids Res 38 (1) 843-846. http://dx.doi.org/10.1093/nar/gkp798
Melchinger, A. E., Boppenmaier, J., Dhillon, B. S., Pollmer, W. G. & Herrmann, R. G. (1992). Genetic diversity for RFLPs in European maize inbreeds: Relation to performance of hybrids within versus heterotic groups for forage traits. Theor Appl Genet, 84 (5-6), 672-681. http://dx.doi.org/10.1007/BF00224167
Mian, M. R., Sung-Taeg, K. & Margaret, G. R. (2009). Microsatellite diversity of soybean genotypes differing in bean pod mottle virus leaf symptom. Can J Plant Sci, 89 (2), 359-367. http://dx.doi.org/10.4141/CJPS08046
Moraes, R. M., José, I. C., Ramos, F. G., Barros, E. G. & Moreira, M. A. (2006). Caracterização bioquímica de linhagens de soja com alto teor de proteína Pesq Agropec Bras, 41 (5), 725-729. http://dx.doi.org/10.1590/S0100-204X2006000500002
Mulato, B. M., Möller, M., Zucchi, M. I., Quecini, V. & Pinheiro, J. B. (2010). Genetic diversity in soybean germplasm identified by SSR and EST-SSR markers. Pesq Agropec Bras, 45 (3), 276-283. http://dx.doi.org/10.1590/S0100-204X2010000300007
Nichols, D. M., Lgover, K. D., Carlson, S. R., Specht, J. E. & Diers, B. W. (2006). Fine mapping of a seed protein QTL on soybean linkage group I and its correlated effects on agronomic traits. Crop Sci, 46 (2), 834-839. http://dx.doi.org/10.2135/cropsci2005.05-0168
Priolli, G. R., Pinheiro, J. B., Zucchi, M. I., Bajay, M. M. & Vello, N. A. (2010). Genetic diversity among Brazilian soybean cultivars based on SSR loci and pedigree data. Braz Arch Biol Technol, 53(3), 519-531. http://dx.doi.org/10.1590/S1516-89132010000300004
Rodrigues, J. I. S., Arruda, K. M. A., Cruz, C. D., Piovesan, N. D., Barros, E. G. & Moreira, M. A. (2015). Divergência em QTLs e variância genética para teores de proteína e óleo em soja. Pesq Agropec Bras, 50 (11), 1042-1053. http://dx.doi.org/10.1590/S0100-204X2015001100007
Rodrigues, J. I. S., Miranda, F. D., Borges, L. L., Silva, M. F., Good-God, P. I. V., Piovesan, N. D., Barros, E. G., Cruz, C. D. & Moreira, M. A. (2010). Mapeamento de QTL para conteúdos de proteína e óleo em soja. Pesq. Agropec. Bras. 45 (5), 472-480. http://dx.doi.org/10.1590/S0100-204X2010000500006
Sebolt, A. M., Shoemaker, R. C. & Diers, B. W. (2000). Analysis of a quantitative trait locus allele from wild soybean that increases seed protein concentration in soybean. Crop Sci, 40 (5), 1438-1444 http://dx.doi.org/10.2135/cropsci2000.4051438x
Vasconcelos, E. D., Cruz, C. D., Bhering, L. L. & Resende Junior, M. F. R. (2007). Método alternativo para análise de agrupamento. Pesq Agropec Bras, 42 (10). http://dx.doi.org/10.1590/S0100-204X2007001000008
How to Cite
APA
ACM
ACS
ABNT
Chicago
Harvard
IEEE
MLA
Turabian
Vancouver
Download Citation
CrossRef Cited-by
1. О. З. Щербина, С. О. Ткачик, О. О. Тимошенко, Н. О. Шостак. (2020). Assessment of various soybean varieties [Glycine max (L.) Merrill.] on the stability of manifestation of economically valuable traits. Plant varieties studying and protection, 16(1), p.90. https://doi.org/10.21498/2518-1017.16.1.2020.201331.
2. Katarina Perić, Tihomir Čupić, Goran Krizmanić, Branimir Tokić, Luka Andrić, Marija Ravlić, Vladimir Meglič, Marijana Tucak. (2024). The Role of Crop Wild Relatives and Landraces of Forage Legumes in Pre-Breeding as a Response to Climate Change. Agronomy, 14(7), p.1385. https://doi.org/10.3390/agronomy14071385.
3. K. Singh, K. Gupta, V. Tyagi, S. Rajkumar. (2020). Plant genetic resources in India: management and utilization. Vavilov Journal of Genetics and Breeding, 24(3), p.306. https://doi.org/10.18699/VJ20.622.
Dimensions
PlumX
Article abstract page views
Downloads
License
Copyright (c) 2017 Acta Agronómica

This work is licensed under a Creative Commons Attribution-NonCommercial-NoDerivatives 4.0 International License.
Política sobre Derechos de autor:Los autores que publican en la revista se acogen al código de licencia creative commons 4.0 de atribución, no comercial, sin derivados.
Es decir, que aún siendo la Revista Acta Agronómica de acceso libre, los usuarios pueden descargar la información contenida en ella, pero deben darle atribución o reconocimiento de propiedad intelectual, deben usarlo tal como está, sin derivación alguna y no debe ser usado con fines comerciales.




 >
> >
>


