Publicado
Valuing a water recreation facility using semi parametric estimators in the travel cost method
Palabras clave:
estimadores semi-paramétricos, modelos de truncamiento, series de Fourier, método de costos de viaje. (es)
VALUING A WATER RECREATION FACILITY USING SEMI PARAMETRIC ESTIMATORS IN THE TRAVEL COST METHOD
Mónica M. Jaime*
Alejandro M. Tudela**
*MSc. in Environmental and Natural Resources Economics. Currently occupies the position of full time lecturer at Universidad de Concepción (Chillán, Chile). Mailing address: Business and Administration School, Universidad de Concepción, Campus Chillan. Chile. PO Box 537 (Chillán, Chile). E-mail: mjaime@udec.cl.
**Ph.D. in Transport. Currently occupies the position of associate professor at Universidad de Concepción (Concepción, Chile). Mailing address: Civil Engineering Department, Universidad de Concepcion. Chile. PO Box 160 C, (Concepción, Chile). E-mail: atudela@udec.cl. We want to thank two anonymous referees for providing useful comments.
This article was received on March 12, 2009, latest version received on August 28, 2010 and his publication approved on November 21, 2010.
Resumen
El objetivo de esta investigación es estimar, usando técnicas semi-paramétricas (SNP), los beneficios recreativos relacionados con un ecosistema estratégico de páramo alto en Colombia. Esta técnica fue usada para la valoración de costos de viaje debido a su flexibilidad. La técnica SNP elegida correspondió a la forma flexible de Fourier y fue ajustada a un modelo de Poisson, de manera que el truncamiento y las tendencias de estratificación endógenas de la base de datos pudieran ser considerados. El excedente del consumidor para el modelo estimado representa el 47,1% del excedente obtenido usando modelos paramétricos para la misma muestra. Las diferencias obtenidas comparando estas estimaciones sugieren que las técnicas SNP deberían ser consideradas durante el proceso de toma de decisiones cuando se trata de sitios recreativos.
Palabras clave: estimadores semi-paramétricos, modelos de truncamiento, series de Fourier, método de costos de viaje. JEL: C14, C15, C24, Q26.
Abstract
The goal of this research is to estimate, using semi parametric (SNP) techniques, the recreational benefits related to one strategic ecosystem of high moors in Colombia. This technique was used during the travel cost method estimation process due to its flexibility. The chosen SNP technique corresponded to the Fourier flexible form, adjusting a Poisson model, such that the truncation and endogenous stratification biases in the data base could be taken into account. Consumer surplus for the estimated model represents just 47.1% of the surplus obtained using parametric models, for the same sample. Differences obtained when comparing these estimates suggest that SNP techniques should be considered during the decision making process when dealing with recreational sites.
Key words: semi parametric estimators, bootstrap, truncate models, fourier series, travel cost method JEL: C14, C15, C24, Q26.
Rèsumè
L'objectif de cette recherche est d'estimer, en utilisant des techniques semiparamétriques (SNP), les effets de bienêtre récréatif relatif à un écosystème stratégique de haute montagne en Colombie. Cette technique a été utilisée pour l'évaluation de coûts de voyage dû à sa flexibilité. La technique SNP choisi correspond à la forme flexible de Fourier et elle a été adaptée à travers un modèle de Poisson, de manière que la troncature et les tendances endogènes de stratification de la base de données puissent être prises en compte. L'excédent du consommateur pour le modèle estimé représente 47,1% de l'excédent obtenu à travers des modèles paramétriques pour le même échantillon. Les différences obtenues dans les deux estimations suggèrent que les techniques SNP devraient être considérées lors des processus de prise de décisions quand il s'agit des lieux de plaisance.
Mots clés : estimateur semi-paramétriques, modèles de troncature, séries de Fourier, méthode de coûts de voyage. JEL: C14, C15, C24, Q26.
The high moors and forest region located in the highlands of Antioquia, Colombia, is considered a strategic ecosystem for the population that lives in and out of the metropolitan area of the Aburrá Valley. This ecosystem provides several environmental services, such as water provision, which is used for recreational purposes in the Parque de las Aguas (Water Park) as a free input1. This park is one of the main recreational sites in the Antioquia Department (Corantioquia, 1999).
Orrego, Jaime and Bedoya (2002) developed a valuation study, oriented to find legal support for the protection of this ecosystem, such that it was declared a Special Management Area (SMA). They used the Travel Cost Method (TCM) to assess the benefits associated with the park, and valued the economic effect of keeping this ecosystem.
Poisson and Negative Binomial probability distributions were adjusted to the data, following Shaw (1988) and Englin and Shonkwiler (1995), and taking into account the discrete nature of the explained variable and the existence of a truncated sample with a possible endogenous stratification bias. Results showed that the welfare measure for the whole sample that visited the site during the study period was more than nine times the investment that that environmental authority carried out for a period that lasted six years. This figure had a clear impact upon the SMA declaration process (Orrego et al., 2002).
A more flexible approach has been suggested to validate the results obtained using the parametric method (Silverman, 1986). The flexible method should relax the assumptions used in the parametric approach, such that any bias can be tackled. If benefit estimates obtained through both approaches are relatively similar, then results could be deemed as robust.
There are two more flexible approaches with respect to the parametric methods: non parametric (NP) techniques and semi parametric (SNP) techniques. The NP techniques are based upon unknown error distributions and functional forms, i.e., they are completely free econometric specifications. They are used mainly to verify the results obtained through parametric methods. An important restriction related to their usage corresponds to the difficulty on the incorporation of an important number of explanatory variables, which is required for the decision making (Silverman, 1986).
On the other hand, SNP methods allow the researcher the relaxation of incorrect parametric specifications, coping with possible specification biases. Furthermore, SNP techniques allow the consideration of an important number of explanatory variables, when compared with NP methods. Nevertheless, the SNP techniques are rather complex during the estimation process (Cooper, 2000).
This work consists of the application of the SNP techniques for the estimation of the recreational benefits related to the Parque de las Aguas2, in the Antioquia Department. The application of this flexible econometric method might allow the correction of any bias associated with data truncation and endogenous stratification in data when using the TCM. The use of the SNP techniques might allow obtaining more robust welfare measures, improving the decision making process.
This paper has been organised as follows. Section two contains a review of the Travel Cost method (TCM), and of the parametric and SNP techniques. The application of the SNP technique to the Parque de las Aguas data is reported in the third section, whereas the analysis and discussion of the results is detailed in section four. Final conclusions of the study are pointed out in the last section.
THE TRAVEL COST METHOD
The Travel Cost method (TCM) is based upon the consumer choice theory. It measures the willingness to pay for good and environmental services associated with recreational sites. The real value of a resource is expressed through the willingness to pay for using the resource. This willingness to pay could be the cost associated with visiting a recreational site. A demand curve for the environmental good could be estimated, comparing the benefits for consuming the good, with the costs related to the good supply. Changes in access costs, as well as policy instruments, could be assessed through variations in the consumer surplus (Ward and Beal, 2000).
During the initial developments of the TCM, Clawson and Knetsch âfor more details seeWard and Beal (2000)â derived a demand curve based on aggregated zone information. This approach had two problems. The first had to do with the loose of efficiency due to the aggregation of socioeconomic information, whilst the second trouble was related to the lack of sensitive to individual travel time changes. These inconveniences motivated the employment of disaggregated information, estimating individual demand models, with a later aggregation process. Revealed preferences could be represented and modelled in a better way.
Later developments considered the inclusion of new explanatory variables, such as the travel cost of going to an alternative site (Freeman III, 1993; Orrego et al., 2002), the site quality (Orrego et al., 2002) and the recreational facilities –see Ward and Beal (2000). These studies also considered aspects such as the subjective value of time (Fernández, 1992; Ortúzar, 1994; Ward and Beal, 2000), the site staying time (McConnell, 1992), socioeconomic differences in the population and multipurpose visits (Ward and Beal, 2000; Mendelsohn, Hof, Peterson and Johnson, 1992), the consideration of the different components of the travel cost variable (Zawacki, Marsinko and Bowker, 2000), and the treatment of the error component specification in the recreational demand models (Ward and Beal, 2000).
An alternative approach to model the recreational demand is based upon the discrete choice models or Random Utility Models (RUM), whose theoretical background rests on the Random Utility Theory. In this case, the choice made by an individual, among many options, is modelled. The TCM models the number of trips (frequency) to a recreational site, whereas the RUM studies the probability of visiting a specific site. Discrete choice models look for the maximization of the individual utility, considering constraints of income and time. Demand models can be estimated and consumer surplus evaluated. More information can be found in Mendelsohn et al. (1992); Feather, Hellerstein and Tomasi (1995), and Feather and Hellerstein (1997).
Parametric Estimates
In recreational demand models the dependent variable corresponds to the number of trips to a recreation site made by an individual in a given period of time. Information is usually gathered through in situ surveys. Due to this, data might contain some biases that should be considered during the estimation process. A first aspect to be taken into account is that the dependent variable is a non negative integer. A second matter has to do with the fact that non participant information is not available. Sample only refers to those people who have travelled to the site at least once. Sample is referred as truncated. A third issue is related to the situation that people visiting more often the place are more likely to be interviewed, with respect to those occasional visitors. Sample might have an endogenous stratification.
Shaw (1988), the first researcher dealing with the problems pointed out before, suggested a demand model based upon a Poisson distribution since it can cope with non negative dependent variables. The estimation of coefficients would be through the maximum likelihood method, eliminating the biases on the welfare measures due to the truncation in the sample.
The use of a Poisson distribution is not obligated. Actually, the distribution should satisfy the condition of having a well specified conditional mean. Besides, it is required that the distribution variance is also well specified, such that the ratio variance-mean equals one; this condition is known as equal-dispersion. However, since many works dealing with recreational demand modelling show the existence of data over-dispersion, then it is suggested the usage of different estimators, keeping the condition of a correct specification of the mean and the variance (Cameron and Trivedi, 1998; Gourieroux, Monfort and Trognon, 1984), or the use of a more general distribution, like a Negative Binomial. This distribution eliminates the possibility of bias due to the over-dispersion since its conditional variance has a squared specification in the mean (Creel and Loomis, 1990). More information regarding the over-dispersion tests for the Poisson distribution can be found in Cameron and Trivedi (1990).
With respect to the endogenous stratification, Englin and Shonkwiler (1995) developed a Negative Binomial model, which corrects simultaneously the truncation and endogenous stratification biases, whilst Ovaskainen, Mikkola and Pouta (2001) assessed the effect of the endogenous stratification on the coefficients and welfare estimates.
Semi-Parametric Estimates
The Semi Parametric (SNP) techniques are a tool halfway between the parametric and non parametric estimators. According to Delgado and Robinson (1992), a SNP probability model has two components: a parametric and a non parametric model. Although much of the effort is put on the parametric part of the model, it must be said that the non parametric component allows for a better modelling, providing more robust results. This non parametric part improves the efficiency of the model with respect to any consistent parametric estimation.
The relevance achieved for the flexible specifications is due to the limitations associated with the parametric statistic inference, which rest on the “induction hypothesis”3. When dealing with parametric estimates, a probability distribution is assumed. In most of the cases that choice is arbitrary, leading to biased estimates. However, because of its simplicity, these techniques are widely used in many empirical applications. On the other hand, semi parametric methods allow the researcher to reduce the potential for misspecification bias associated with parametric techniques, providing a solution to any statistical bias, but they do at the cost of increased complexity over the parametric approaches and require careful fitting to the data (Cooper, 2000).
Most of the flexible functional forms are of a second order, i.e., if h(x) is approximated by h( x/θ ) then for any x0 there exists a θ0 parameter such that
 | [1] |
Even though the use of flexible forms might improve the statistical aspects of the modelling, there is no way of assuring that a flexible form will eliminate all biases stated previously (Gallant, 1984).
A semi parametric technique is any methodology that allows testing for a hypothesis without assuming any specification form. The semi parametric model approaches the parametric one asymptotically, eliminating the “induction hypothesis”. The most appropriated way of approaching the real model is through a series expansion, similar to
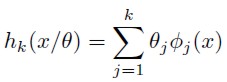 | [2] |
Gallant (1984) stated that experience and literature have shown that most of the flexible forms correspond to the main terms of series expansions. This would validate the use of this approach. Since a series expansion hk( x/θ) can approximate very well an h(x) function, then it is possible to define a norm  , which will permit to measure the error approximation; an adequate norm is the Sobolev one. This norm corresponds to
 | [3] |
One of the semi parametric models corresponds to a Fourier flexible functional form, hk( x, θ). This functional form adds lineal and squared terms to the basic Fourier form, such that the total number of terms is reduced when non periodic functions are approximated. The size of the expansion depends on the data availability. When more data are available, then the number of terms in the expansion is increased; this is known as the Sobolev flexibility. This lets the reduction of the error , for any x, as much as desired, according the sample size, n, increases (Creel, 1997; Cooper, 2000).
The Sobolev flexibility term has been used to name series expansions that are dense according to the Sobolev norm. A functional form showing Sobolev flexibility has the following properties: elasticity is consistent, hypothesis will not be rejected spuriously, and the specification bias will be neglected. If these properties are fulfilled, then equation 1 will be satisfied. Gallant (1984) proved that the Fourier flexible form complies with the properties of the Sobolev flexibility. This implies that this form has the property of approximating a real function and its derivatives, for a finite order, over a specific range for the argument.
Let λ be a vector of integers. Let |λ|* be the sum of the absolute values of λ elements. If function f(x) is a vector of order K, then λ will be a vector of non negative integers with order K, such that
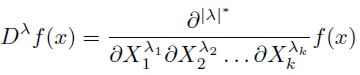 | [4] |
The Sobolev norm is an indicator that takes into the derivatives, such that if hk(x/θ) approximates poorly h(x), or any of its derivatives of order K, then the error given by equation 3 will reach a large value. According to Creel (1997) and Gallant and Souza (1991), the Sobolev norm of any function f (x) will be:
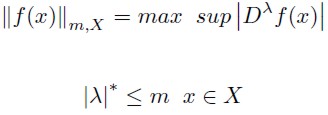 | [6] |
Where m is a finite non negative integer and X is the domain of f (x). If h(x,θ ) is a Fourier approximation of f(x), then in the estimation optimum will be satisfied by the following:
 | [6] |
Therefore, any approximation that is continuous according to the Sobolev norm, for any real function, will allow the estimation of consistent coefficients. This is quite important at the moment of calculating the welfare changes, since they depend on the demand model coefficients.
Besides, it is possible to choose θj independently from the information available about m, X and f (x). The problem that remains is how to estimate these coefficients using any standard econometric procedure. According to Gallant (1984), if coefficients are estimated using OLS, ML or OLS in two or three steps, they will have the desirable properties about consistency and so on.
Coming back to the Fourier functional form, this has the following expression:
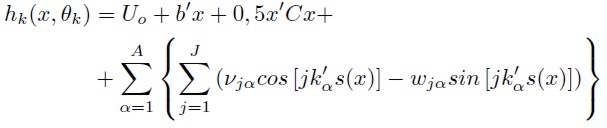 | [7] |
Where  and x is a row vector of
order (k–A–J )× 1. This vector corresponds to all the arguments of the utilities difference model, where k is the dimension of θ, A is the length of the series, and J is the order of the approximation. A and J are positive integers. kα are vectors of positive and negative integers, which are indices of the conditional variables after transforming and scaling x by s(x). The s(x) function avoids the periodicity of the model, since the sine and cosine functions are periodic, whereas the demand functions are not. s(x) scales and transforms the x variables, such that they are always in the interval [0, 2π – 0.000001]. The modified variables are smaller than 2π, which correspond to the period of the sine and cosine functions (Cooper, 2000). With respect to the optimal values for A and J, some authors suggest that a proper length would be two or three indices, whereas the order should vary between one and two; more details can be found in Creel (1997). A discussion about the optimal number of coefficients ( θ ), to be estimated is provided by Chalfant and Gallant (1985) and Cooper (2000).
and x is a row vector of
order (k–A–J )× 1. This vector corresponds to all the arguments of the utilities difference model, where k is the dimension of θ, A is the length of the series, and J is the order of the approximation. A and J are positive integers. kα are vectors of positive and negative integers, which are indices of the conditional variables after transforming and scaling x by s(x). The s(x) function avoids the periodicity of the model, since the sine and cosine functions are periodic, whereas the demand functions are not. s(x) scales and transforms the x variables, such that they are always in the interval [0, 2π – 0.000001]. The modified variables are smaller than 2π, which correspond to the period of the sine and cosine functions (Cooper, 2000). With respect to the optimal values for A and J, some authors suggest that a proper length would be two or three indices, whereas the order should vary between one and two; more details can be found in Creel (1997). A discussion about the optimal number of coefficients ( θ ), to be estimated is provided by Chalfant and Gallant (1985) and Cooper (2000).
Keeping in mind the discrete and truncated nature of the dependent variable, then it seems plausible the utilization of a Fourier form as an approximation of the real function. Estimations can be carried out using ML or SML, whilst semi parametric Poisson or Negative Binomial distributions can be used to model the data. Although these distributions are not totally flexible, they permit to cope with the biases in this kind of samples (Cooper, 2000). An extension of this approach, based upon more flexible transformations, such as polynomial series, can be revised in Cameron and Johansson (1997).
Regarding the properties of the estimates, Andrews (1991) and Gallant and Souza (1991) studied the conditions under which the Fourier form achieves asymptotic normality, whereas Delgado and Mora (1995) derived the asymptotic properties of the semi parametric procedures considering weaker conditions than those required by continuous estimators.
On the other hand, Fenton and Gallant (1996) ran a study to find out whether the apparent convenience of using SNP methods had any setback, considering that the SNP is the more convenient non parametric method to estimate simultaneously the coefficients of the non lineal model and the latent density process using ML. They found that there is no problem using SNP methods, since SNP estimates are qualitative and asymptotically equivalents to kernel estimates, when using totally non parametric methods, being the later the optimal estimates.
Besides, Fan and Li (1996) carried out several tests to evaluate consistency when using non parametric and semi parametric regressions. Finally, Gurmu, Rilstone and Stern (1999) developed a semi parametric approach for over disperse regression models, based on a series expansion for the unknown density of the unobserved component, which is a quite attractive approach when truncated discrete models are estimated and the error term distribution is not well specified.
There are few examples with regard to the use of semi parametric methods to model recreational demand. Creel (1997) estimated welfare measures (Equivalent Variation) for an unknown demand functional form. Cooper (2000) used and compared parametric, semi parametric, and non parametric methods when dealing with the estimation of benefits associated with the hunting of water birds in protected areas in San Joaquin Valley, California. Crooker (2004) explored the efficiency of using semi parametric techniques when assessing welfare measures associated with people that visited the Lake Clear, Iowa, in year 2000.
APPLICATION
The Fourier flexible functional form was applied to data collected by Orrego et al. (2002), from November 2000 to February 2001. 409 visitors of the Parque de las Aguas were interviewed. Data were transformed and adjusted to the [0, 2π–0.000001] interval, then proceeding to the estimation of the semi parametric models. Scaling was performed to avoid the Gibb effect, which happens when there are large oscillations when using Fourier series. ML and SML procedures were used for the estimation, since they allowed the correction of the truncation and endogenous stratification biases.
Regarding the semi parametric models estimated, they corresponded to four types, depending on the combinations of length and order: SNP-I (order = length = 1), SNP-II (order = 2; length = 1), SNP-III (order = 1; length = 2) and SNP-IV (order = 2; length = 2).
The general specification of the models was Ti = h(xi) + ei, where h(x) was estimated through a Fourier flexible form, i.e., hk( x, θ ). x corresponds to the explanatory variables vector and θ are the coefficients to be estimated. A general specification of the deterministic component is shown in equation 7.
More details about the explanatory variables in this study can be found in Orrego et al. (2002). CV2 is the travel cost, including a 40% of the salary as a proxy of the travel time opportunity cost; CS2 is the travel cost of the alternative site, including a 40%of the salary as a proxy of the travel time opportunity cost; Salario corresponds to the monthly income.
The estimated coefficients were given by θ = (a, b, c, u1, v1 … uj , vj). This vector has a dimension of K = 3 + 2 · J.
The calculation procedure consisted in estimating the vector θ0 for different specifications and values of hk(xi, θ), n, and K and studying the error approximation for h(x), and the first and second derivatives, (d/dx) h (x) and ( d2/dx2) h (x).
Once coefficients were estimated, demand elasticities were calculated to have a full economic interpretation of results (Cooper, 2000). Elasticity expressions correspond to:
 | [8] |
Consumer surplus for the j – th individual was estimated using
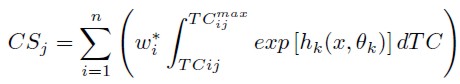 | [9] |
Where TCijmax is the exclusion fare or maximum observed travel cost, and wi is an observation weight if required. For SNP models the total consumer surplus for the sample is equal to the sum of the individual surpluses, since the SNP model might be highly non linear (Cooper, 2000).
Since there is an important co-linearity among estimates when using Fourier series forms, resting reliability to the hypothesis tests, then welfare measures will be presented through confidence intervals. These intervals were estimated using a bootstrap approach.
For the bootstrap, 30.000 sets of simulated data were generated. Each simulation allowed the estimation of a set of coefficients and, hence, a welfare measure. An empirical distribution of coefficients and welfare measure were built up following this procedure. The specific bootstrap method used in this case corresponded to the bias accelerated correction (bac) procedure. More details regarding this approach can be found in Crooker (2004).
The test suggested by Cameron and Trivedi (1997) was used to check for over dispersion in the data and estimated models. This test consists of running the following regression:
 | [10] |
Where 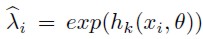 . According to this test, if Ho :α = 0 cannot be rejected, then the E[T] = V ar[T] condition in the Poisson model cannot be discarded either. This implies that the collected data do not exhibit over dispersion (Cooper, 2000).
DISCUSSION
Different regressions were estimated for the Poisson distribution, since this distribution corrects the truncation and endogenous stratification biases. Estimation were made using the Pseudo Maximum Likelihood (SML), with a parameterisation of the variance-mean ratio, such that Var/Mean = 1 + E(Mean). This parameterisation is the most appropriated in this type of models according to Cooper (2000).
Estimations were carried out using Gauss 6.0, modifying the original codes prepared by Cooper (2000). Modified codes are available on request from the corresponding author. Results are presented in table 1.

Results are presented as elasticities. Values in brackets are the corrected (90% bac) and uncorrected (CI-90%) elasticities intervals. As expected, elasticities for order 1 models (SNP-I and SNP-III) have the proper sign: (∂T/∂CV2 < 0), (∂T/∂CS2 > 0), and (∂T/∂Salario > 0), i.e., less trips if the own travel cost increases, but more trips if the alternative site travel cost increases or if the own salary is augmented.
For order 2 models (SNP-II y SNP-IV), just the own travel cost, CV2, and Salario variable elasticities had the expected sign.
When increasing the length or order, changes are obtained in the estimates. Bigger change is gotten for the SNP-IV. These changes might provoke variations in welfare measures and conclusions derived from them.
With respect to the confidence intervals for elasticities, differences are got when comparing the corrected and uncorrected estimates. Actually, there is a displacement of intervals: lower and upper bounds increase for the corrected models, and a change on the width of the intervals. When corrected intervals are biased, then uncorrected intervals are the valid ones.
The number of coefficients estimated (coef ), moves between 10 and 28. Higher order and length models have more coefficients to be estimated. The α coefficient corresponds to the test to identify the existence of over dispersion. For the estimated models it cannot be rejected the null hypothesis, being true 31.4% for all models, implying that there is no over dispersion. Therefore, there is no need to estimate a Negative Binomial model.
Regarding the predictive capacity of the models, they are able to predict the 68.2% of total trips in the sample.
Estimates of consumer surplus (CS) per trip are shown in table 2. CS varies between $4.148 and $7.635 per trip. Lowest value is related to the higher order and length model. These results are quite significant to an individual and aggregated level. Although CS variations among models look like small when referring to values per person, these changes are quite important when values are aggregated to the sample (409 people) and the whole visitor population (1.195.000 per year). This fact might have an important effect on policy decision making regarding investment and management. The choice of the best model representing the sample being modelled and the population should not be a minor issue.

Concerning the confidence intervals for welfare measures, it can be noticed that the corrected interval (bac 90%) for the SNP-IV model is biased. This implies that the valid interval is the one related to the uncorrected values (CI-90%). Besides, the difference between the corrected and uncorrected intervals for the SNP-I model welfare estimate is quite small, implying that for this model the bias in the welfare estimate is the smallest, when compared with the other models. This coincides with the fact of SNP-I model having the smallest variation coefficient (VC).
It can be concluded from the previous observations that the difference between the corrected and uncorrected intervals increases when moving from lower to higher order and length models. This might be due to the fact that models tend to be less linear when increasing the order or length. For instance, an order 1 model implies that the power for the sine and cosine functions is equal to one, whereas if order is 2, the demand function is approximated through squared forms of sine and cosine functions.
Estimates of the total consumer surplus, for the sample of 409 individuals, are shown in table 3.
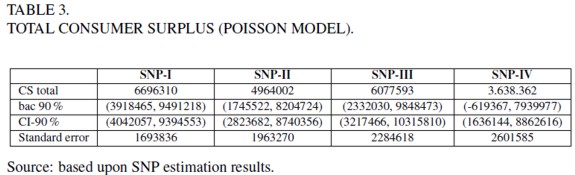
Total consumer surplus was calculated aggregating the individual CS estimates. As in the individual case, total welfare estimate for the SNP-IV model is biased when considering the corrected interval, implying that the uncorrected one is the valid. Differences among models increase when the model order is augmented, as expected.
Hence, it was necessary an order 1 model to get an improvement on the modelling and data adjustment, with respect to the parametric model. Since there is not over dispersion, then a Poisson model is enough, instead of using a Negative Binomial.
Besides, if the number of coefficients to be estimated is too large, the SNP models tend to be less reliable with respect to simpler models. This can be observed in SNP-II and SNP-IV models, which have the wrong sign for the coefficient associated with the CS2 variable. Moreover, elasticities for these models are quite larger than those obtained for the order 1 model. Following Cooper's results (Cooper, 2000) and this work, it can be said that for relatively small samples, a simpler model is better than a higher order and length model. More sophisticated models tend to be instable. More complex SNP models converge to the real demand function according the sample size increases.
Taking into account the previous comments, it can be said that the best models are those of order 1 (SNP-I and SNP-III). However, since SNP-I model adjusts better the data than the SNP-III model, then it is concluded that this model should be used for policy decision making.
As it was mentioned in section 2, the NP and SNP models can be used for cross verification. Following Cooper (2000), if NP and SNP results are similar, then it can be said that benefits are robust for the chosen estimator. He compared the results for parametric, SNP and NP models, concluding the previous statement. In this work the only available publication for comparison, using the same data, is the work produced by Orrego et al. (2002). They estimated a parametric Negative Binomial model, correcting by truncation and endogenous stratification. Confidence intervals for the welfare measure, average consumer surplus per trip, were built using the expressions provided by Yen and Adamowicks (1993). Results are shown in table 4.

The comparison of these results with those reported in table 2 shows that the parametric approach generates much higher values for the consumer surplus per trip. This difference might affect clearly any policy decision.
Besides, Laverde and Montes (2003) using the same data estimated a non parametric model. When comparing the three welfare estimates it was detected the following order relationship: CSSNP < CSNP < CSparam. This could be explained based upon the specific assumptions associated with each model. Furthermore, the NP model does confirm the SNP model results, but fails when trying to validate the parametric results.
The parametric model considered a fixed functional form, obtaining that the income (Salario) coefficient was very small, close to zero. Although outdoor recreation is not a main service for Colombian people, implying that the recreation expenditure is relatively small, the result obtained using the parametric approach does not sound plausible, when the socioeconomic characteristics of the region where the survey was conducted are considered.
On the other hand, the SNP model showed that income (Salary variable) was relevant at the moment of travelling for recreation purposes. This would imply that in the sample there would be income effect. It is argued that the difference between the parametric and SNP models resides on the assumption they hold. Clearly the parametric model is more restricted than the SNP one, implying that the later would able to capture better the data characteristics.
Furthermore, the travel cost to the site, the travel cost to the alternative site, and the income are all relevant when deciding to visit the Parque de las Aguas. These results are quite consistent with the socio economic context related to the sample. Income and travel costs are indeed constraints at the moment of choosing an out door recreation facility in less developed countries. The SNP model confirms this fact. In contrast, Cooper's work (Cooper, 2000) confirms that in more developed countries income effect on recreation decisions is quite unimportant.
The income distribution information in the data base showed that the recreational site visitors were people belonging to the lowest socioeconomic strata (Orrego et al., 2002)4. The survey was applied to people arriving by car though. Highest income people normally would not attend this type of facilities since they would have more exclusive amenities. This confirms the econometric results for the SNP model.
CONCLUSIONS
The ecosystem of forests and high moors in the Andes highland was declared a protected area, supported on the worked developed by Orrego et al. (2002). According to them, benefits related to visitors over the year 2000 were similar to the infrastructure investment required to put the recreation site in operation. Since they used a parametric approach to estimate the benefits, and since these approaches are not very flexible, imposing many restrictions on the analysis, it was decided to carry out a semi parametric modelling approach. This more flexible approach might help to drive the policy decisions.
Cooper's work (Cooper, 2000) was used to guide this research, even though some changes had to be introduced due to the existence of truncation and endogenous stratification in the sample collected by Orrego et al. (2002). A Poisson distribution was adjusted, with a Fourier expansion of the model.
Four semi parametric models were estimated, considering different orders and lengths. However, just an order 1 model would be enough to detect an improvement on estimates and economic results with respect to the parametric model.
Consumer surplus per trip for the simplest SNP model resulted in 47.14% of the value obtained by Orrego et al. (2002). The utilization of this lowest value might help to improve the policy decision making, adopting a more conservative approach. Total consumer surplus, considering the whole population visiting the recreation site, might vary between M$8.000 and M$18.000.
Regarding the possibility of over dispersion in the data, estimations showed that this is not relevant. This implied that it was not necessary to estimate a Negative Binomial distribution, as recommended by Orrego et al. (2002).
In contrast with the findings by Orrego et al. (2002) in relation with the non existence of income effect, the SNP model showed that such effect would exist in the sample, and population visiting the site. This finding matches the socio economic characterization of the sample used to estimate the models. In addition, the existence of the income effect implies that a Marshall surplus should not be used as a measure of the users' welfare, but as a Hicks measure.
When comparing the different modelling approaches, it must be said that the semi parametric results did not match the parametric ones, but did agree with the non parametric outcomes (Kernel approach). This implies that SNP benefit estimates can be considered robust.
Furthermore, even though the parametric and semi parametric approaches allowed the correction of the sample biases, the assumptions and scarce flexibility of the parametric models did not permit the capture of the full impact of the independent variables on the dependent one. The apparent non existence of income effect, as mentioned previously, is an example of this.
There was no possibility to implement the cross validation test to check for over adjustment in the SNP models. Instead, the variation coefficients (VC) associated with the welfare measures, for the four SNP models, were compared with the VC for the non parametric model estimated by Laverde and Montes (2003); they estimated a Variable Partition Histogram (PAVA) model. The analysis showed that all models were over adjusted but the SNP-I. VC for this model and the non parametric model were similar indeed. Finally the SNP-I model was chosen to represent the demand being modelled.
It has been shown that it is feasible to estimate a semi parametric model to study the demand for a recreational site, obtaining promising results with respect to the classical and little flexible parametric models, and the more sophisticated and absolutely flexible non parametric ones. When comparing the SNP welfare measures with respect to those obtained using the standard approach, it was found some important differences that might affect the decision process when dealing with recreational investments and the optimal allocation of resources.
It is pending the implementation of the cross validation test, such that the choice of the best model, among many, can be made with certainty. It would be also interesting to estimate a semi parametric model, considering a Negative Binomial distribution instead, contrasting these results with those obtained when using a Poisson distribution.
FOOTNOTES
1 The water net that arises from its ecosystem provides water to more than 63,000 inhabitants that belong to the surrounding area, and provides both water and electricity to Medellín city through the multiple resource management system “Rio Grande II”, which is divided in two hydroelectric power systems: Niquía and Tasajera. When the productive process is finished in Niquía, water is used for aqueduct and drain purposes in the north area of Medellín. On the other hand, when the productive process is finished in Tasajera, water is used for recreational purposes in the “Parque de las Aguas” as a free input, and then it is spilled into Medellín's river in order to dilute the concentration of pollutants (Corantioquia, 1999).
2 Since its creation in 1996, this park has been one of the main recreational sites in the Aburrá valley. On average, it is visited for 1,195,000 individuals each year, which are mainly attracted because of the existence of a modern system of aquatic infrastructure. It has an area of 107 Ha, from which 40 Ha are covered with water, in addition to an ecological path where visitors can observe different species of trees. Water demand in the park for recreational purposes reaches 6,500 m3 per month (Orrego et al., 2002).
3 This hypothesis states that parametric estimates are limited for the distributional moments of the assumed probability function, and as a consequence of this, they are not suitable to represent the problem under study.
4 According to Orrego et al., (2002), despite the fact that visitors inhabit all the neighborhoods of Medellín, an important average came from middle and low income zones. From those questioned in the survey, 6:6%reached primary school, 38:14%secondary school, 12:71%technical school, and 42:54% higher education. In addition, only 10:76% had a permanent employment contract. On average, individuals visited the park 3.1443 times per year, remaining 5.17 hrs in the park.
REFERENCES
[1] Andrews, D.W. (1991). Asymptotic normality of series estimators for nonparametric and semiparametric regression models. Econometrica, 59(2), 307-345.
[2] Cameron, A.C. and Trivedi, P.K. (1990). Regression-based test for overdispersion in the Poisson model. Journal of Econometrics, 46(3), 347-364.
[3] Cameron, A.C. and Johansson, P. (1997). Count data regression using series expansions: with applications. Journal of Applied Econometrics, 12(3), 203-223.
[4] Cameron, A.C. and Trivedi, P.K. (1998). Regression analysis of count data. New York: Cambridge University Press.
[5] Chalfant, J.A. and Gallant, A.R. (1985). Estimating substitution elasticities with the Fourier cost function. Journal of Econometrics, 28(2), 205-222.
[6] Cooper, J. (2000). Nonparametric and semi-nonparametric recreational demand analysis. American Journal of Agricultural Economics, 82(2), 451-462.
[7] Corporación Autónoma Regional del Centro de Antioquia (CORANTIOQUIA). Banco Interamericano de Desarrollo (BID) (1999).Conservación, ordenamiento y manejo del sistema de páramos y bosques alto andinos del Noroccidente medio antioqueño. Medellín: CORANTIOQUIA.
[8] Creel, M. and Loomis, J.B. (1990). Theoretical and empirical advantages of truncated count data estimators for analysis of deer hunting in California. American Journal of Agricultural Economics, 72(2), 434-445.
[9] Creel, M. (1997). Welfare estimation using the Fourier form: simulation evidence for the recreation demand case. The Review of Economics and Statistics, 79(1), 88-94.
[10] Crooker, J. (2004). Valuing resource access with semi-nonparametric techniques: an application to Clear Lake (Working paper 04-WP 352). Ames: Iowa State University, Center for Agricultural and Rural Development.
[11] Delgado, M. and Robinson, P.M. (1992). Non parametric and semi parametric methods for economic research. Journal of Economic Surveys, 6(3), 201-249.
[12] Delgado, M.A. and Mora, J. (1995). Non parametric and semi parametric estimation with discrete regressors. Econometrica, 63(6), 1477-1484.
[13] Englin, J. and Shonkwiler, J.S. (1995). Estimating social welfare using count data models: an application to long-run recreation demand under conditions of endogenous stratification and truncation. The Review of Economics and Statistics, 77(1), 104-112.
[14] Fan, Y. and Li, Q. (1996). Consistent model specification test: omitted variables and semiparametric functional forms. Econometrica, 64(4), 865-890.
[15] Feather, P., Hellerstein, D. and Tomasi, T. (1995). A discrete-count model of recreational demand. Journal of Environmental Economics and Management, 29(2), 214- 227.
[16] Feather, P. and Hellerstein, D. (1997). Calibrating benefit function transfer to assess the conservation reserve program. American Journal of Agricultural Economics, 79(1), 151-162.
[17] Fenton, V.M. and Gallant, A.R. (1996). Qualitative and asymptotic performance of SNP density estimators. Journal of Econometrics, 74(1), 77-118.
[18] Fernández, J.E. (1992). El valor subjetivo del tiempo: antecedentes y marco teórico para una investigación empírica (Documento de trabajo No. 63). Santiago de Chile: Pontificia Universidad Católica de Chile, Departamento de Ingeniería de Transporte.
[19] Freeman III, A.M. (1993). The measurement of environmental and resource values. Theory and methods. Washington D.C.: Resources for the Future.
[20] Gallant, A.R. (1984). The Fourier flexible form. American Journal of Agricultural Economics, 66(2), 204-208.
[21] Gallant, A.R. and Souza, G. (1991). On the asymptotic normality of Fourier flexible form estimates. Journal of Econometrics, 50(3), 329-353.
[22] Gourieroux, C., Monfort, A. and Trognon, A. (1984). Pseudo maximum likelihood methods: applications to Poisson models. Econometrica, 52(3), 701-720.
[23] Gurmu, S., Rilstone, P. and Stern, S. (1999). Semiparametric estimation of count regression models. Journal of Econometrics, 88(1), 123-150.
[24] Laverde, D.C and Montes, J. (2003). Procedimientos no-paramétricos para el análisis de demanda recreacional (Tesis inédita). Universidad Nacional de Colombia, Medellín, Colombia.
[25] McConnell, K.E. (1992). On-site time in the demand of recreation. American Journal of Agricultural Economics, 74(4), 918-925.
[26] Mendelsohn, R., Hof, J., Peterson, G. and Johnson, R. (1992). Measuring recreation values with multiple destination trips. American Journal of Agricultural Economics, 74(4), 926-933.
[27] Orrego, S., Jaime, M. and Bedoya, J. (2002). Valoración económica de los beneficios recreacionales proporcionados por el Parque de las Aguas en el área Metropolitana del Valle de Aburrá. Lecturas de Economía, 56(1), 107-131.
[28] Ortúzar, J. (1994). El valor del tiempo para evaluación de proyectos. (Informe ejecutivo, Fondo Nacional de desarrollo científico y tecnológico). Santiago de Chile: Pontificia Universidad Católica de Chile, Departamento de Ingeniería de Transporte.
[29] Ovaskainen, V., Mikkola, J. and Pouta, E. (2001). Estimating recreation demand with on-site data: an application of truncated and endogenously stratified count data models. Journal of Forest Economics, 7(2), 125-144.
[30] Shaw, D. (1988). On-site samples regression: Problems of non-negative integers, truncation and endogenous stratification. Journal of Econometrics, 37(2), 211-223.
[31] Silverman, B. W. (1986). Density estimation for statistics and data analysis. London: Chapman and Hall.
[32] Ward, F. and Beal, D. (2000). Valuing nature with travel cost models. United Kingdom: Edward Elgar Publishing.
[33] Yen, S. and Adamowicks,W. (1993). Statistical properties of welfare measures from count data models of recreational demand. Review of Agricultural Economics, 15(2), 203-215.
[34] Zawacki, W., Marsinko, A and Bowker, J.M. (2000). A travel cost analysis of nonconsumptive wildlife-associated recreation in the United States. Forest Science,4(46), 496-506.
Cómo citar
APA
ACM
ACS
ABNT
Chicago
Harvard
IEEE
MLA
Turabian
Vancouver
Descargar cita
Visitas a la página del resumen del artículo
Descargas
Licencia
Derechos de autor 2011 Cuadernos de EconomíaCuadernos de Economía a través de la División de Bibliotecas de la Universidad Nacional de Colombia promueve y garantiza el acceso abierto de todos sus contenidos. Los artículos publicados por la revista se encuentran disponibles globalmente con acceso abierto y licenciados bajo los términos de Creative Commons Atribución-No_Comercial-Sin_Derivadas 4.0 Internacional (CC BY-NC-ND 4.0), lo que implica lo siguiente: