Published
HMI/ SCADA standards in the design of data center interfaces: A network operations center case study
DOI:
https://doi.org/10.15446/dyna.v82n193.53494Keywords:
Ergonomic, HMI, SCADA, Human Factors, Standards, Engineering of the Usability, Industrial Automation (en)DOI: https://doi.org/10.15446/dyna.v82n193.53494
HMI/ SCADA standards in the design of data center interfaces: A network operations center case study
Estándares HMI/SCADA para el diseño de interfaces en los centros de datos: El centro de control y operaciones como caso de estudio
Said Filali-Yachou a, Carina S. González-González a & Carlos Lecuona-Rebollo b
a Department of
Computer Science Engineering and Systems, University of La Laguna, San
Cristobal de La Laguna, Spain, saidfilali88@gmail.com, cjgonza@ull.edu.es
b Department of
Engineering, Institute of Technology and Renewable Energies, Tenerife, Spain. clecuona@iter.es
Received: February 18th, 2015. Received in revised form: March 16th, 2015. Accepted: September 26th, 2015
This work is licensed under a Creative Commons Attribution-NonCommercial-NoDerivatives 4.0 International License.

Abstract
This paper presents an evaluation of interfaces at the
Network Operations Center NOC (Network Operations Center) in terms of HMI
standards and related regulations, as well as the ergonomic monitoring GEDIS
guide. The Centre of Operations NOC at the
Institute of technology and renewable energy (ITER) is responsible for
monitoring the various infrastructures of the Data Centre such as the air
conditioning, power supply, fire protection, security, technical centers, wind
farms, photovoltaic plants, and different infrastructures deployed around the
submarine cable belonging to the Consortium Cana-Link (the cable that connects
the mainland and Canary Islands, the earth ring and the Network IRIS). To unify systems and facilitate the NOC
personal's daily tasks, the ITER has been using the BMS system for SCADA
software. However, BMS is a software specialist in the management of buildings,
and as such BMS software was substituted by the new specialized system designed
after this evaluation.
Keywords: Ergonomic, HMI, SCADA, Human Factors, Standards, Engineering of the Usability, Industrial Automation.
Resumen
En este
artículo se presenta la evaluación de las interfaces de la sala del Centro de
Operaciones NOC (Network Operations Center) del NAP (Network Access Point de
Canarias), siguiendo estándares y normativas HMI, así como la guía ergonómica
de supervisión GEDIS. En base a los resultados obtenidos, se presenta un
prototipo de mejora de la interfaz actual.El Centro de Operaciones NOC del
Instituto Tecnológico y de Energías Renovables (ITER) se encarga de monitorizar
las diversas infraestructuras del Data Center como son la climatización,
suministro eléctrico, protección contra incendios, seguridad, centros técnicos,
parques eólicos, plantas fotovoltaicas, así como las distintas infraestructuras
desplegadas alrededor del cable submarino perteneciente al consorcio de
Cana-Link (el cable que une la Península y Canarias, el anillo terrestre y la
Red IRIS). Para unificar algunos de estos sistemas y facilitar la tarea diaria
de supervisión, se emplea un software SCADA especializado en la gestión de
edificios.
Palabras clave: Ergonomía, HMI, SCADA, Factores Humanos, Estándares, Ingeniería de Usabilidad, Automatización Industrial.
1. Introduction
The objective of this work is to analyze and apply the NOC HMI/SCADA systems by applying different usability and accessibility techniques and standards. Additionally, we want to identify the main interface problems, and based on the results of the evaluation, give recommendations for improvement. Specifically, in this work we have applied the ergonomic design guide (GEDIS), as well as several standards and proposals for the improvement of the actual control system rooms. Based on the results, a prototype is presented to improve the existing interface used by NOC (Network Operations Centre) operators.
In the human supervision and monitoring tasks that take place in the industrial control rooms, there are aspects of security and physical ergonomics involved in the tasks, as well as factors relating to the engineering of usability, ergonomics and cognitive areas. These disciplines provide guidelines to apply and improve the design of the control room; these are focused on the user [1].
SCADA (Supervising, Control and data acquisition) [2] is the software used in these types of tasks and rooms. SCADA allows the industrial processes to be supervised and controlled from a distance and helps provide real time feedback at field level (sensors and actuators).
The task of informing the operator of all activities in an industrial process is performed by the Human-Machine Interface (HMI). As such, good communication is necessary between the operator and the automated control system. This communication process makes it possible to analyze different anomalies and modify parameters related to the control process. From a normative and operative point of view, the supervision is a delicate and essential task. So, this work guarantees the quality and efficiency of the process, and the operator is usually the decision maker with regards to the control actions.
Therefore, the HMI system must contain both graphical and numerical components. Also, the HMI must use standardized and clear terminology for the end user. In addition, it is recommended that the process and control variables should be as clear as possible for the user. And, also, a historical record of variables' variations should be kept in order to study their behavior and make the respective predictions.
2. Standards HMI/SCADA for industrial contexts
In this section we present those norms and standards that describe the HMI problem and present several norms, standards and criteria for industrial human supervision. We later describe some of the most important guides in industrial environments.
The ISO 11064 standard establishes principles, recommendations and requirements to be applied in the design of control centers. This standard proposes general-purpose aspects as well as aspects for its specific application in industrial control rooms. Ergonomics is principally used as physical ergonomics. This standard is divided into 5 basic parts that are listed below:
→ Part 1: Principles for the design of control centers.
→ Part 2: Principles for management control rooms and annexes.
→ Part 3: Layout of the control rooms.
→ Part 4: Distribution and size of the jobs.
→ Part 5: Displays and controls.
This work has been based on Part 5, through the analysis of the NAP's current BMS. Please note that Part 5 has ergonomic principles and contains provisions and recommendations on indicators and controls as well as their interaction in the design of hardware and software of control centers.
The UNE-EN 9241 is important for work with DDSs (Data Display Screens) since we have to consider a number of issues that can negatively influence the physical and mental capacity of the person who is working with a DDS. To avoid possible physical disorders such as muscular-skeletal, visual and eye problems, fatigue, as well as others, and considering ergonomic studies, the European Committee for Standardization, in collaboration with the International Organization for Standardization (ISO) promoted the development of the ISO 9241 and the EN-ISO 9241 standards, "Ergonomics Requirements of visual display terminals (VDT's) used for office tasks". These standards establish the ergonomic requirements for DDS equipment used in office activities, to ensure that users can develop their business safely, efficiently and comfortably. The receivers are the various actors involved in the design, manufacture, acquisition, and use of DDS equipment, as well as those responsible for directing and supervising the activities. While a significant portion of the content of the standard is dedicated to designing DDS equipment, the physical aspects of job design, the physical environment and the management and organization of work with other teams are also addressed.
The European standard EN-ISO 9241, approved by the European Committee for Standardization, should be taken entirely as standard by European countries' standardization bodies. In Spain, this rule is called UNE-EN 9241. The existence of potential problems mentioned above, coupled with the large size of the group of employees currently working with computer screens, justifies the existence of specific legislation on the subject. In Spain, the Royal Decree 488/1997, of April 14, and transposing Directive 90/270 / EEC both refer to the minimum safety and health requirements for work with display screens. This European Directive is the fifth individual Directive under the Framework Directive 89/391 / EEC on the introduction of measures to encourage improvements in the safety and health of workers at work. Both derive from the Directorate General V of the EU Council, and contain directives on safety and health at work.
Royal Decree 488/1997, of April 14, is currently the only legal standard governing Spain, and specifically refers to jobs that involve DDS. This norm addresses issues relating to the ergonomic designs in these types of jobs. However, ergonomic designs in these jobs require the use of more detailed specifications, which are also included in the rule.
There are other rules that apply in the areas of usability and cognitive ergonomics, these are:
- ISO 13407: This provides a guide to achieving quality in use by incorporating iterative activities involved in User-Centered Design (DCU).
- ISO 10075-1: Ergonomic principles that are related to mental workload.
- The DTS ISO 16071: Guidance on accessibility for human-machine interfaces. This Technical Specification (derived from ANSI HFS 200) provides guidelines and recommendations for the design of systems and software that allow users with disabilities to be able to access information systems (with or without assistive technology). It includes users with low vision, hearing impaired users, deaf users, users with physical and cognitive disabilities, and elderly people.
- IEC TR (International Engineering Consortium Technical Report) 61997: This technical report provides general principles and detailed design guidelines for the selection of the means of communication, and the mechanical, graphical and auditory user interfaces.
- Human Factors Design Standards (HFDS): Human factors principles and practices are integrated into the procurement, design, development, and testing of the United States Federal Aviation Administration (FAA) systems, facilities, and equipment.
- Human Interface Design Review Guidelines (NUREG 0700): Human factors engineering (HFE) on aspects relating to nuclear power plants are in accordance with the United States standard review plan.
- Safety Automation System (SAS) NORSOK: This petroleum industry of Norway standard covers technical requirements and establishes a basis for engineering related to safety and automation system design.
- Man System Integration Standard (NASA-STD-3000): This standard provides user information to ensure the proper integration of the man-system interface with other aerospace disciplines.
- The EEMUA 191[3] standard is a set of guidelines for alarm management. This work has evaluated D-ALiX system alarms and events, which measures the ratios set by the EEMUA standard, the average number alarms per hour, the maximum number of alarms per hour, operator response time, etc.
- The GEDIS guide [4]: This guide provides a methodology based on the area of knowledge of ergonomic design and interface monitoring. GEDIS encompasses aspects of interface design, cognitive ergonomics, usability and human-computer interaction to improve reliability and efficiency of the systems in the control room. This methodology collects and takes into account the principles of previous standards, and it is specifically designed to supervise a control room. For this reason GEDIS has been chosen for our work as a reference guide to assess and improve the control room interfaces and the monitoring system.
In the next section, the NAP current control system (BMS) is described. The GEDIS is applied to this BMS to assess the accomplishment of HMI standards and to see areas that should be improved. Then, prototypes are described, that have been developed as a solution to the problems identified in the assessment.
3. Case of study: the NOC at ITER
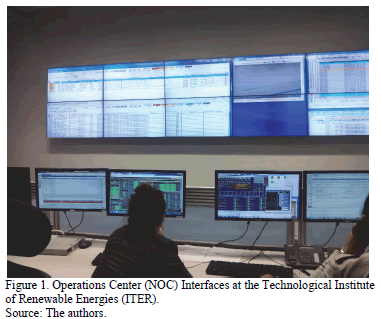
The Operations Center (NOC) at the Technological Institute of Renewable Energies (ITER) is responsible for monitoring several Data Center infrastructures, such as: air conditioning, power supply, fire protection, security, technical centers, wind farms, photovoltaic plants, and different infrastructures deployed around the consortium of Cana-Link (the cable between the mainland and the Canary Islands, ground ring and the IRIS Network) submarine cable. To unify some of these systems and facilitate the daily task of NOC personnel, ITER SCADA software is used as a BMS system (Fig. 1). The BMS is specialized in building management software. The principle of operation of this type of software is similar to other technologies that specialize in industrial automation (i.e., it has a graphical environment that allows drivers to be programmed, as well as the typical instrumentation for these types of projects).
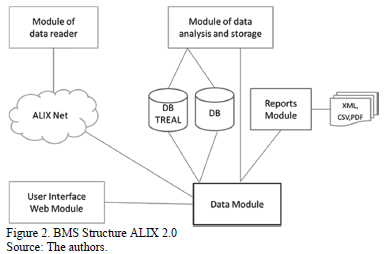
The application is divided into five modules: a) module reading network, b) module data analysis and storage, c) data block, d) reports module, and e) user interface module (Fig. 2). Three of these interface modules (module data analysis and storage, module data and reporting module) have Web Services (WS). The module of network decoder handles the ALiX [5] network data collection devices. This module periodically interrogates the network obtaining status, alarms and variables, and this information is sent to the data analysis and storage module for processing. Based on the analysis of the variables, new alarms are generated and added to existing ones and the importance (weight) is assigned. Finally all this information is stored in the Data Module.
The analysis and data storage module is also responsible for storing the raw data for the last reading of each of the devices on the network. Only the last reading of each device is stored, which eliminates the previous data from other devices in the raw. This information can render a real time image of what is happening on the network.

The following statements reflect the relationships between the modules in Fig. 1 and protocols that use:
A) MLR =>ALiX Net: Interrogate HTTP, SNMP and Modbus
B) MLR => MAA: HTTP-XML message Shipping WS
C) MAA => BD Treal: Query SQL ADODB
D) MAA => BD: Query SQL ADODB
E) <=> MAA MDD: Bidirectional HTTP-XML message sending WS
F) MDD <=> MDI: Bidirectional HTTP-XML message sending WS.
The Data Module (R / W), from the stored information, provides all the methods to obtain useful information for the user (last alarms, unacknowledged alarms, historical events, etc.), the user interface module reporting and also makes use of this information for their operation. The Data Module also provides methods to interact with network devices (off / on groups, change set points, etc.) and, through the WS interface, three of the modules allow external applications to provide and obtain application data.
4. Applying the GEDIS guide and EMMUA to the NOC's BMS and SCADA systems
The GEDIS guide has been prepared to design information systems centered on the user [6], focus on the formalization of ergonomic criteria [7] work, and the Nielsen's [8] heuristic guidelines. One of the differences from the previously developed methodologies is that the GEDIS guide provides generic guidelines on ergonomic design criteria, and offers a numerical evaluation method to assess the quality of the interface.
The guide is divided into 2 parts. In the first part, a set of selected indicators for multimedia interfaces design guidelines used by computer engineers and computer experts interacting person are detailed [9]. Moreover, the second part of GEDIS shows the quantitative measures of evaluation to give a final numerical value. This final value allows the designer / user to evaluate possible improvements in the monitoring interface. So, this value allows for a comparison with other interfaces. The evaluation is expressed in numeric form (quantitative format) or in a qualitative format. The equations to measure the indicators are the following:

The first equation determines the value of each indicator using the sum of the respective sub-indicators, divided by the number of sub-indicators for each indicator. In the second equation, the total global assessment of the interface is determined as the result of the sum of the indicators divided by the number of indicators.
Both equations include identical weight indicators and sub-indicators, which are intended to cover different aspects of the interface design.
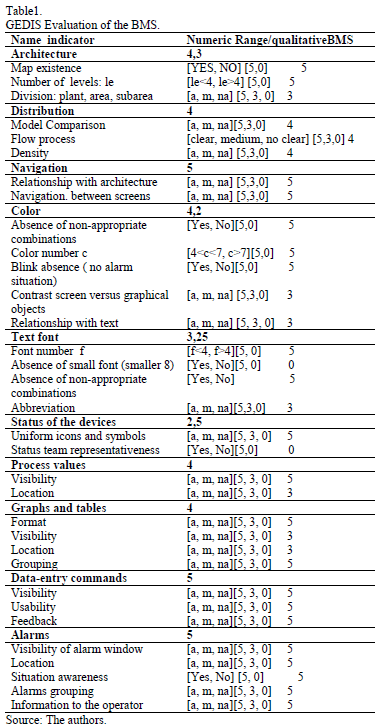
Below, Table 1 shows the results obtained for the current BMS considering the GEDIS indicators guide, where a = appropriate, m = medium and na = not appropriate.
The evaluation obtained in Table 1, was performed by the BMS supervisor, six NOC operators and the designer of the system, using the criteria contained in the GEDIS guide and standards regulations. The results obtained through the quantitative evaluation of the BMS are correct at a general level, but the evaluation detected areas for improvements for the Text and Status Devices indicators.
The improvement changes introduced in the Text and Status Devices indicators were the following: a) the display of incidents increased the font size for alarm events, warning and without communication; b) the status indicator devices were optimized to use the BMS Server resources. Previously the "Unifilar" and the D-ALiX SCADA screens were working at a very low level when they established communications with Modbus gateways level devices. Our work has changed the work logic so that the device status is queried in terms of SQL queries in the database, as well as their spread to usability.
Also, besides the application of the GEDIS guide, international standards have been taken into account, such as ISO 11064 and 191 EEMUA [10]. The evaluation of the performance of BMS Alarm Systems has yielded positive results. These results include the fact that the number of alarms that may occur in 10 minutes is less than 2, and, as such, the system is manageable for operators. The number of alarms that may occur during the first 10 minutes after the first critical alarm that occurred is dependent on equipment fails. In the system that was analyzed there are 7 alarms that could trigger. Therefore, this is a lower number than the value established by the EEMUA 191 standard, which has a 10-alarm maximum. So, the management system is predictable.
5. Design and development of new user interfaces
Once evaluated, the BMS interface, and various improvements to the redesign of the interface of several screens have been proposed, as well as their relocation. Thus, the old SCADA system display used in the NOC for the monitoring of the Power Plants was improved and integrated in the BMS. For example, in the old interface, the detection of an alarm on the plant "Suelo" was painted a red pixel color, which is difficult to be detected quickly by the human eye. For this reason, it is necessary to show the view in order to display this alarm. Therefore, the Wonderware SCADA system was substituted with this new system.
Currently, with the new screen, the NOC operator can easily detect the alarms, reminders or communication failures of both inverters as well as the photovoltaic plants. Also, with this new screen, you can see the production of solar power plants, temperatures of inverters and solar irradiation in real time.
To develop a prototype that includes the improvements identified in the NAP's SCADA systems, it has also had been necessary to contemplate the integration of the same system into the BMS. The technologies used for this development have been popular Web technologies such as PHP 5.5, HTML5, CSS3, JavaScript and MySQL, in addition to a specific library of PHP that works on a ModbusPhpModbus level.
ITER opted for this solution because of the staff's previous knowledge of these technologies, as well as the need to develop their own software, independent of any manufacturer and with no license cost. Above all, this solution was chosen due to scalability; since the D-Alix has deployed just a 1st phase, for the future it will expand up to 2 more phases and, therefore, in the BMS the number of devices that may be added is unlimited. The number of devices that can be added limit the amount of available resources.
5.1. Improvement of SCADA system Photovoltaic Plants
In an assessment carried out in all the ITER SCADA systems, the Wonderware photovoltaic plants system is the one that is less usable and that is more complex to work with, as well as being the one that has received the most negative comments. The most appropriate solution to this system has been the integration of new screens in the BMS, as well as skips in a new solution SCADA. For the realization of these new displays, the methodology carried out was to conduct focus groups formed by members of the NOC, as well as with the supervisors of the BMS, in order to analyze the problematic aspects of the interface and then perform several mockups or sketches of screens with different proposals. Once the Mockup of the screen design was selected, it proceeds to translate the sketch into a web design, making use of HTML5 and CSS3. This screen allows the NOC operator to know the status of the inverter and the plant, the total production, production of the inverter and solar irradiation of the plant's location. In this way, with this screen and the drop-down window of each inverter, the 3 levels of the Wonderware system are suppressed, in addition to obtaining a clean screen and being able to easity detect alarms.
The next step, to locate all the devices, was the complete inventory of all inverters that form the photovoltaic plants, as well as the identification of all the Modbus gateways - TCP/IP. Because the PV power plants were previously built in Wonderware SCADA, the inventory of all devices was a difficult task.
Before proceeding with the design of the final template, some tests were carried out with the inverters in the design of a provisional screen to test if the reading of the alarms of the inverters was correct. The memory map of the type of inverters was assessed in orderto detect which were the necessary records for later reading, and then they were integrated into the database of all the BMS devices .
A screen to monitor multiple inverters of different photovoltaic plants, specifically the Red Farm, was designed. Another screen was designed to monitor the inverters of the "Fincaroja y verde" plants.
Now, we proceed with the insertion of all inverters in the database, and in this way we store the records of readings associated with each inverter. The insertions to the database of Devices are the following data:
Insert IntoDevices(Id,Name,System,DevicesTypes_Id,Domain,Subdomain,Address,Status) values (247,"7A",9,16,2,101,"192.168.24.17 1","B"):
Where the data inserted are the identifier of the inverter, the name of the inverter, the device type, domain, subdomain, and the IP address of the Modbus - TCP gateway that contains the particular inverter.
We decided to do a redesign of the dynamic screens, using PHP. This decision was taken considering future scalability, since you could automatically try to add new photovoltaic plants, without the need for a screen redesign but by simply including the new subdomain of the plant, and the inserts in the database. Previously, with a static screen, it would have been necessary to create tables for the new plants. Also by making the system with dynamic screens it will allow a minor preload time for the states of the inverters.
In the deployment of the new screen, there have been multiple incidents. One of them is that, at dusk, the inverters do not produce energy, therefore the BMS detects the non-production as an incident alarm, and the system would collapse with the total number of alarms from the 542 inverters. So, it was decided to temporarily change the status of all inverters to off to prevent saturation of the alarm system, and especially the distraction of the NOC operators.
To take this problem into account we thought of different solutions, one of them was to fix the schedule of the inverter readings, but this solution was not very appropriate, since the changes are not fixed schedules between summer and winter. Finally a more effective and efficient solution was found: considering that the number of alarms that are triggered in the incident is only one, a message of photovoltaic warning was indicated, which in turn encompasses all of the 542 investor alarms.
Finally, we proposed a second screen, which also shows the status of the photovoltaic plant. It could discover the status of a particular inverter and for that reason a JavaScript Popup was used; when you click on an inverter it shows the instantaneous power, continuous voltage, the temperature and the status of the inverter. To monitor the main BMS screen -the Wall- a screen was designed that monitors the status of each photovoltaic plant.
5.2. Interfaces proposal for the ITER cleanroom
The integration of the BMS with the Clean Room takes place through the alarm monitoring of the data acquisition card of the subsystems of nitrogen gas and cabin photovoltaic laboratory. This integration should be done on a screen as well as in the wall of the BMS. This ensures the 24x7 monitoring of the Photovoltaic Laboratory by the NOC.
In order to monitor these variables, the design, implementation and integration of a summary screen in the BMS application has been undertaken for real-time monitoring of the Photovoltaic Laboratory. In addition, it is necessary to add the integration of audible alarms that are assigned according to how critical they are.
In summary, the objective that has been completed with this integration is the acquisition and monitoring of a company's cabinet gas-control. Data acquisition will be made through the MPORT -Rev2 III card, which is properly configured for this purpose. Monitoring is performed via the Modbus communication protocol TCP/IP. The interfaces have been designed following a previous mockup to monitor alarms. There are two actuators; one is "Alarm Reset" and the other "Remote Shutdown". The first allows the audible alarm to be reset and the second runs the safety mechanism that prevents leakage of these gases. So, a screen to monitor the clean room on the wall was designed.
5.3. Visualization of HMI Data of the Big Data Systems
The D-ALIX supervisors need to know about the consumption of the different equipment located at the NAP. Tostudy these statistics, the ITER uses "Pentaho", which is a suite composed by a set of free programs to generate business intelligence, including built-in tools to generate reports, data mining, etc. Due to the fact that "Pentaho" is running on a different server and in addition to the latency of the graphics of consumption display, the need to employ a web technology was identified in the draft D-Alix, in order to integrate these graphs in the BMS.
For this reason, to integrate the graphics display in this work a Google API (Google Charts) has been used. Three possibilities were analyzed to choose which graphics API to use: D3, js and Google Charts. The last option was selected because of its power. The DalixConsumption database was used to show the data, which is formed by 136 tables belonging to the various devices to be monitored. In turn, each table is made up of millions of records.
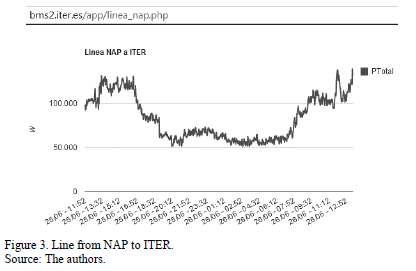
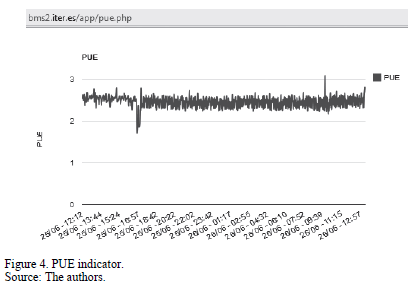
The consumption graphs represent the total consumption of the NAP, D-ALIX climates, photovoltaic plants, Line NAP to ITER, general NAP services, the supercomputer, as well as the indicator PUE (Power Usage Effectiveness), which is a variable defined by the Green Grid as an instrument to measure the efficiency of data centers. It compares the total energy consumed by a data center with the amount of energy that actually reaches the IT equipment, reporting on the amount lost by other computers, such as cooling systems. Several interface graphics have been implemented to represent the consumption of serial dispositives employed in the Data Center. For example, Fig. 3 represents the line between the ITER and the Network Access Point and Fig. 4 specifies the indicator and Power Usage Effectiveness (PUE).
6. Conclusions
The GEDIS guide is a methodological approach that combines the efforts of engineering systems and ergonomics to improve the efficiency of the human-machine systems in industrial control rooms.
This work was done together with NOC supervisors and operators. Note that it is essential to reflect on the experience of the operator of the control room in the supervising task, as well as the technical team responsible for developing the application.
The relation between the engineering of the usability and the design of control room allows professionals in various areas such as systems engineers and computer engineers, together with the ergonomics professionals, to work with the same approach to develop an optimal industrial control application.
The application of the GEDIS guide in the case studies provides a series of indicators over different aspects of the interface that allows these aspects to be attended to and improved. Also, this guide can be an index of global quantitative assessment over the state of an actual interface after applying the corrective measures. For this reason, we believe that it is an ideal tool to work together with the standard employees of this work to achieve the evaluation and continuous improvement of systems that are alive and remain in constant growth.
The valuation obtained after the completion of the assessment is a very good result. The new system for the NOC makes the detection of alarms produced easier, compared to the Wonderware SCADA initial screens.
The technologies used for the design of the new interfaces, PHP, HTML5, CSS3, JavaScript, etc., are all very popular technologies that are easy to work with. Not using proprietary technologies from different manufacturers allows for easy integration with the Building Management System (BMS) that was developed in these popular technologies. This is shown by the ease of scalability, as well as integration with the hardware devices. In this case we have been able to demonstrate that a wind and photovoltaic energy control center used for to monitor a Data Center Systems, as well as a system of submarine and terrestrial telecommunications is extensible to any type of control center, for example aircraft, rail, nuclear, maritime navigation, etc.
The Big Data Systems recorded large amounts of information on a daily basis, making their representation a difficult task. An easy way to represent HMI data has been demonstrated in this work, which is fast and objective for the user to undertake further analysis.
Acknowledgement
The authors would like to acknowledge the contribution of the Engineering Department of the Institute of Technology and Renewable Energies (ITER), for their support with this work.
References
[1] Asensio, P.P., García, B.A. y Boladeras, M.D., Evaluación de la usabilidad para la tarea de supervisión humana en sala de control industrial, 2009.
[2] Penin, A., Sistemas Scada, 2011.
[3] Ponsa, P., Amante, B. and Díaz, M., Evaluation of the usibility of the human supervising task in the control room of an industrial room., Revista Iberoamericana de Automática e Informática Industrial (RIAI), 6 (1), pp. 84-93, 2009. DOI: 10.1016/S1697-7912(09)70079-2
[4] Ponsa, P., Vilanova, R., Díaz, M. and Gomá, A., Interface design improvement in supervisory control. E-Minds: International Journal on Human-Computer Interaction, 1 (3), pp. 21-36, 2007, ISSN: 1697-9613.
[5] Shang, W., Ding, Q., Marianantoni, A., Burke, J. and Zhang, L., Securing building management systems using named data networking, IEEE Netw., 28 (3), pp. 50-56, 2014. DOI: 10.1109/MNET.2014.6843232
[6] Granollers, T., Lorés, J. y Cañas, J., Modelo de Proceso de la Ingeniería de la usabilidad y de la accesibilidad. MPIu+ a, 2010.
[7] Scapin D. and Bastien, J., Ergonomic criteria for evaluating the ergonomic quality of interactive systems, Behav. Inf. Technol., 1997.
[8] Nielsen, J., Usability Engineering. 1994.
[9] Shneiderman B. and Plaisant, C., Strategies for evaluating information visualization tools: Multi-dimensional in-depth long-term case studies, methods Inf. Vis., 2006. DOI: 10.1145/1168149.1168158
[10] Aas, A.L. and Skramstad, T., A case study of ISO 11064 in control centre design in the Norwegian petroleum industry, J. Appl. Ergon., 42 (1), pp. 62-70, 2010. DOI: 10.1016/j.apergo.2010.05.003
S. Filali-Yachou, received his BSc. in Computer Science Eng. in 2014 from the University of La Laguna, Spain. His research focused on industrial automation and usability in information systems. He has several years of experience in the analysis of software development.
C. S. González-Gonzalez received her PhD. degree in Computer Science in 2001 from the University of La Laguna, Spain. She is an associate professor in the Computer Engineering Department at the University of La Laguna, Spain. Her main focus areas of research are related to human computer interaction (HCI), natural and adaptive interfaces, serious games and gamification in Education and gender in HCI. Also, she has a wide experience in e-learning best practices and LMS systems.
C. Lecuona-Rebollo, received his BSc. in industrial engineering in 2008 from the University of La Laguna. After finishing his studies, he did an internship for six months at the Institut Laue-Langevin Neutrons for Science (ILL) in Grenoble. In this period, he worked in the Computer Science department developing software for different scientific purposes. After this period he started to work for the Instituto Tecnológico y de Energías Renovables in Tenerife, where he is currently working in the ALiX project. He is responsible for the distributed control system.
How to Cite
IEEE
ACM
ACS
APA
ABNT
Chicago
Harvard
MLA
Turabian
Vancouver
Download Citation
CrossRef Cited-by
1. Hugo O. Garcés, Claudia Durán, Eduardo Espinosa, Alejandro Jerez, Fredi Palominos, Marcela Hinojosa, Raúl Carrasco. (2022). Monitoring of Thermal Comfort and Air Quality for Sustainable Energy Management inside Hospitals Based on Online Analytical Processing and the Internet of Things. International Journal of Environmental Research and Public Health, 19(19), p.12207. https://doi.org/10.3390/ijerph191912207.
2. Jesús Chazarra Zapata, Imene Yahyaoui, Javier Castellote Martínez, José Miguel Molina-Martínez, Manuel Estrems Amestoy, Antonio Ruiz Canales. (2017). Sustainable Design and Manufacturing 2017. Smart Innovation, Systems and Technologies. 68, p.357. https://doi.org/10.1007/978-3-319-57078-5_35.
3. Byron Remache-Vinueza, Jefferson Castro-Ramírez, Mireya Zapata. (2021). Human Systems Engineering and Design III. Advances in Intelligent Systems and Computing. 1269, p.116. https://doi.org/10.1007/978-3-030-58282-1_19.
4. Isabel Santiago, David Trillo Montero, Juan J. Luna Rodríguez, Isabel M. Moreno Garcia, Emilio J. Palacios Garcia. (2017). Graphical Diagnosis of Performances in Photovoltaic Systems: A Case Study in Southern Spain. Energies, 10(12), p.1964. https://doi.org/10.3390/en10121964.
Dimensions
PlumX
Article abstract page views
Downloads
License
Copyright (c) 2015 DYNA

This work is licensed under a Creative Commons Attribution-NonCommercial-NoDerivatives 4.0 International License.
The author of a paper accepted for publication in any of the journals published by the School of Mines will yield all the property to the National University of Colombia rights free of charge, within which include article: the right to edit, publish, reproduce and distribute both print and digital media, as well as including in an article in international indexes and / or databases, likewise, it enables the publisher to use images, tables and/or graphic material presented in Article for designing covers or posters of the magazine. By assuming the economic rights of the article, it may be reproduced partially or totally in any printed or digital media without express permission of the same.


