Published
MAGNETIC AND PALAEOMAGNETIC STUDIES AS AN AID IN DECIPHERING GROUNDWATER FLOW: A CASE STUDY FROM DECCAN TRAPS
ELECTRICAL IMAGING TECHNIQUES FOR GROUNDWATER POLLUTION STUDIES: A CASE STUDY FROM TAMIL NADU STATE, SOUTH INDIA
Srinivasamoorthy K1, Sarma VS2, Vasantavigar MP, Vijayaraghavan K1, Chidambaram S1 and Rajivganthi R1
1 Department of Earth Sciences, Annamalai University, Annamalainagar - 608 002
2 National Geophysical Research Institute, Hyderabad -500606 (Council of Scientific & Industrial Research, New Delhi)
Corresponding author Email: moorthy_ks@yahoo.com
Manuscript receiver: January 05, 2009. Accepted for publication: May 05th, 2009.
ABSTRACT
An attempt was made to identify the extent of pollution in the aquifer matrix of Tirupur, a highly industrialized zone of Tamilnadu state, South India. Electrical imaging techniques were adopted with a Syscal Pro-96 system, for measuring apparent resistivity values using different electrodes separation. The first profile conducted at Valipalayam recorded a resistivity range of <10 Ù m at a depth of 8 m, which indicates contamination of top soil due to discharge of effluents. An increase in resistivity >45.5 Ùmwas observed at a depth of 27 to 47 m indicating the possibility of contamination. The second profile conducted at Pethichettipuram indicates source of contamination at left end corner with a drop in resistivity <46.5 Ù m at a depth of 7.91 m. A drop in resistivity <21.6 Ù m was also observed at a depth of 11.5 m indicating a contaminated zone in deeper regolith. The third survey conducted in Palayakadu indicates contamination of regolith at a depth of 0 to 20 m with a resistivity less than 40 Ùm. The fourth survey at Chellapuram indicates contamination of overburden with resistivity >11.5 Ùm, to a depth of about 10 m. Five imaging surveys conducted across the contaminated sites reveals that shallower regoliths are highly contaminated and deeper aquifers are free from contamination except a few locations.
Key words: Industrial zone, resistivity, Tomography, 2D model, regolith, contamination.
RESUMEN
Se intentó determinar el alcance de la contaminación en la matriz acuífera de Tirupur, una zona altamente industrializada del estado de Tamilnadu, al sur de la India. Se usaron sondeos eléctricos para obtención de imágenes con un sistema Syscal Pro-96, para medir los valores de resistividad aparente con diferentes separaciones de electrodos. El primer perfil realizado en Valipalayam registró un rango de resistividad <10 Ü m, a una profundidad de 8 metros, lo cual indica la contaminación de la parte superior del suelo debido a la descarga de efluentes. Un aumento de la resistividad > 45,5 Üm se observó a una profundidad de 27 a 47 m, indicando la posibilidad de contaminación. El segundo perfil realizado en Pethichettipuram indica la fuente de contaminación en el extremo izquierdo con una caída de la resistividad <46,5 Ü m, a una profundidad de 7,91 m. Un descenso en la resistividad <21,6 Ü m también se observó a una profundidad de 11,5 m, indicando una zona contaminada en lo más profundo. El tercer sondeo realizado en Palayakadu revela una contaminación a una profundidad desde 0 a 20 m con una resistividad inferior a 40 Üm. El cuarto perfil en Chellapuram indica una contaminación de los terrenos de resistividad >11,5Üm, a una profundidad de unos 10 m. Cinco estudios de imágenes realizados a través de los sitios contaminados revelan que los acuíferos superficiales están altamente contaminados y los acuíferos más profundos están libres de contaminación, a excepción de unos pocos lugares.
Palabras Clave: Zona Industrial, Resistividad, Tomografía, 2D modelo, contaminación.
Introduction
The purpose of electrical surveys is to determine the subsurface resistivity distribution by making measurements on the ground surface as these measurements help to estimate the true resistivity ofthe subsurface. The true resistivity is related to various geological parameters such as the mineral and fluid content, porosity and degree of water saturation in the rock. In many engineering and environmental studies, the subsurface geology is very complex and the resistivity can change rapidly over short distances (Keller and Frischknecht 1966; Daniels and Alberty 1966). Resistivity values have a much larger range compared to other physical quantities mapped by other geophysical methods. 2-D and 3-D electrical surveys are the practically commercial techniques used with the recent development of multi-electrode resistivity surveying instruments (Griffiths et al. 1990) with aid of computer inversion softwares (Loke, 2004). Igneous and metamorphic rocks typically have high resistivity values but vary on the degree of fracturing, and the percentage of the fractures filled with ground water. The resistivity of ground water approximately
varies from 10 to 100 U m depending on the concentration of dissolved salts present. The low resistivity (about 0.2 U m) in groundwater is mainly due to the presence of industrial contaminant metals such as Fe, Cu, Pb and Zn along with leaching of cations and anions like potassium, chloride, sodium, bicarbonate, silicates etc., from rock sources and manmade influences greatly reduce the resistivity of ground water to less than 1 U m even at fairly low concentrations (Pathak and venka- tesshwar, 2001)
Electrical imaging techniques
New developments in recent years is the use of electrical imaging surveys, where the resistivity changes in vertical direction, as well as in horizontal direction along the survey line, to map areas with complex geology (Griffiths and Barker, 1993). These surveys are usually carried out using 25 or more electrodes connected to a multi-core cable which is attached to an electronic switching unit, connected to a lap top computer with an electronic switching unit to automatically select the relevant four electrodes along a straight line. Electrical Imaging will provide information about distinct subsurface boundaries and conditions, which can indicate soil or bedrock lithology variations (Edwards, 1977). From the measured field data, simulated depth sections are constructed (Apparao and Sarma, 1981 1983) with over lapping data levels. To plot the data from a 2-D imaging survey, the simulated section contouring method is normally used due to its ease in pictorial representation with different arrays for mapping the same region, which gives rise to very different contour shapes in the simulated section plot.
The Syscal Pro-96 system is capable of measuring apparent resistivity values with different electrode configurations for Wenner electrode arrangement. Resistivity simulated sections was prepared using the Apparent Resistivity values and Interpretation were carried out using RES2DINV software (Loke, 1997). The output is presented in the form of subsurface images which is a useful system for Electrical Resistivity Tomography (ERT).
Concept
The concept consists of using multi core cables, which contain arrangement of cables and electrodes one takeout every 5m with 64 electrodes. The measuring unit includes relays, which automatically carries out the sequence of readings introduced in its internal memory. The system takes readings for many combinations of transmission and reception pairs so as to achieve a mixed profiling and sounding pairs (ABEM, 2004). The total length of the cable is equal to the spacing of electrodes which determines the depth of investigations (Ron Barker et.al, 2001). The final depth of the investigations of a Lund imagine survey depends on, Geometry of cables (type of array, number of electrodes, spacing between electrodes and number of segments) and the measurement of signal by the equipment, namely the amplitudes of the signal, existing noise, power specifications of the equipment and its ability of filtering the noise through the stacking process (Loke, 2001).
Methodology
A known amount of current (I) is pumped to energize the subsurface using current electrodes and the response is measured on the ground surface in the form of voltage (V) through potential electrodes. Resistance (V/I) is calculated and further, the apparent resistivity is computed by the formula ρa = Kx (V/I), where K is the geometrical factor which depends upon the type of configuration that is used. In the case of profiling, the apparent resistivity is obtained along a line using an appropriate electrode arrangement. From the resistivity plot the anomalous zones are identified without any depth estimation. In the case of sounding, apparent resistivity is obtained at a particular place (identified through profiling) by increasing electrode separations and the data is interpreted in terms of layer parameters quantitatively. The present proposed technique is the Wenner array which has the strongest signal strength for a comprehensive subsurface picture.
Forward modeling program
The free program, RES2DMOD.EXE, is a 2-D forward modeling program which calculates the apparent resistivity pseudo section for a user defined 2-D subsurface model. The program helps to choose the finite-difference (Dey and Morrison, 1979a) or Finite-element (Silvester and Ferrari, 1990) method to calculate the apparent resistivity values. The RES2DMOD.EXE program indicates the contours in the simulated section produced by the different arrays over the same structure.
Study area
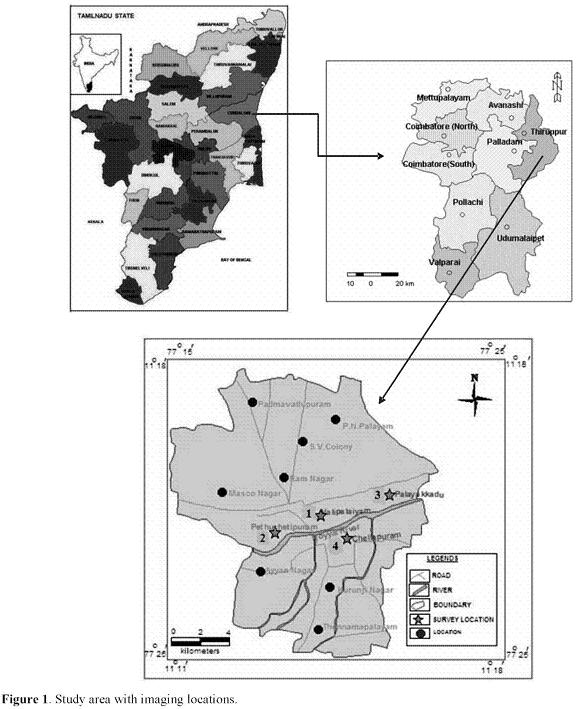
Tirupur is located 50 Km east in Coimbatore district of Tamilnadu state in South India at latitudes and Longitudes 11.18° N 77.25° E with a total extent of 27 sq.km (Figure 1). Tirupur an important trade center of India gained recognition as the leading source of Knitted Garments, Casual Wear and Sportswear. Geology of the study area is entirely composed of Precambrian shield area called as the Indian Peninsular complex with wide range of igneous and meta-morphic rocks. The most common rock type in the study area is gneiss. Gneiss is a generic term for a large variety of metamorphic rocks, and can have both sedimentary and igneous origin. The gneiss found in the Tirupur region is of high metamorphic grade and is mainly of the biotite type, but quartzo-feldspatic gneiss is also found. These rocks are thought to have been formed during the Archaean time period, approximately 3.8 to 2.5 billion years ago, which means that they are among the world's oldest rocks (Gustavsson et al., 1970), (Sankararaaj et al., 2002). Thestudy area is an undulating plain with gentle slopes. The elevation ranges between 225 and about 300 m (Kristina furn, 1998). The climatic conditions in the study area are "semiarid" with a mean annual temperature of 29.4°C. (SSLUO, 1998). The annual average rainfall in the study area is 527.2 mm.
Hydrogeology of the study area
Groundwater occurs in two different aquifers, one shallow aquifer formed by the weathered zone and the other deeper aquifers connected to the fracture system in the rock with vertical and horizontal fractures. These fractured zones extend down as 200 m or more. The Transmissivity of the shallow aquifers varies from 11.4 to 51.0 m2/day, with an average of about 30.7 m2/day. The hydraulic conductivities vary from 2.9 to 20.0 m/d with an average of 9.2 m/d. The average thickness of the shallow aquiferis 3.7 m. The average specific yield is 4.0x10⁻² (CGWB, 1993). The vertical fracture zones constitute an unconfined aquifer, demarcated as the most potential aquifer in the area, in which groundwater development is focused. Transmissivity in the vertically fractured aquifer vary from 52.1 to 497.0 m2/day. The hydraulic conductivity is 1.8 m/day with a range of 0.9 to 3.4 m/day. The aquifer ranges from approximately 45.0 to 142.3 mbelow ground level with an average thickness of 97.3 m (Table 1). In horizontal fracture aquifer the transmissivity is 52.8 m2/day with a hydraulic conductivity of 0.5 m/day. The horizontally fractured layer depth ranges from 28.8 to 129.5 m below ground level (CGWB, 1993).

The groundwater table more or less follows the topography, but with a smaller slope than the surface. The hydraulic gradient is approximately 2.8 m/km with a steeper slope of about 6.5 m/km towards the River Noyil indicating the groundwater flow along east west direction. Groundwater is the main source of water supply in the study area although presence of river Noyyal which dries during summer season. The study area has been demarcated for heavy exploitation of groundwater used mainly for industrial purposes (Senthilnathan and Azeez, 1999).
At present 9000 knitting, processing and manufacturing units consume nearly 86 mld (million liter per day) of water, but 90 mld of water used are discharged as effluents containing a variety of dyes and chemicals like acids, salts, wetting agents, soaps and oil, leading to contamination of the ground and surface water and soil in and around the study area (Rajaguru and Subbram, 2000). The pollution load calculated from Pollution Control Board, 2008 was as follows: Total Dissolved Solids 23.54 lakh tonnes, Chloride 13.11 lakh tonnes, Sulphate 1.25 lakh tonnes, Total Suspended Solids (TSS) 0.97 lakhtones, Chemical Oxygen Demand 0.90 lakh tonnes, Biological Oxygen Demand 0.29 lakh tonnes and Oil & Grease 0.01 lakh tones (Jacob Thomson, 1998). Hence an attempt was made to get further information on the extent of groundwater contamination by using ERT studies.
Results and Discussion
The present study was made to delineate the pollutant zone through ERT method. In Tirupur surveys, the imaging system was used with single cable with 25 takeouts at 5 m interval by Syscol Pro 96 instrument by adopting Wenner array. Electrodes were 0.5 m long and made of stainless steel; they were planted to a depth of 0.4 m. Each electrode was watered to ensure good contact with the ground. A total of four image lines were measured with the images varying in length from 0 to 50 m parallel to the river Noyyal. This effectively gave a maximum depth of imaging of 20 m.
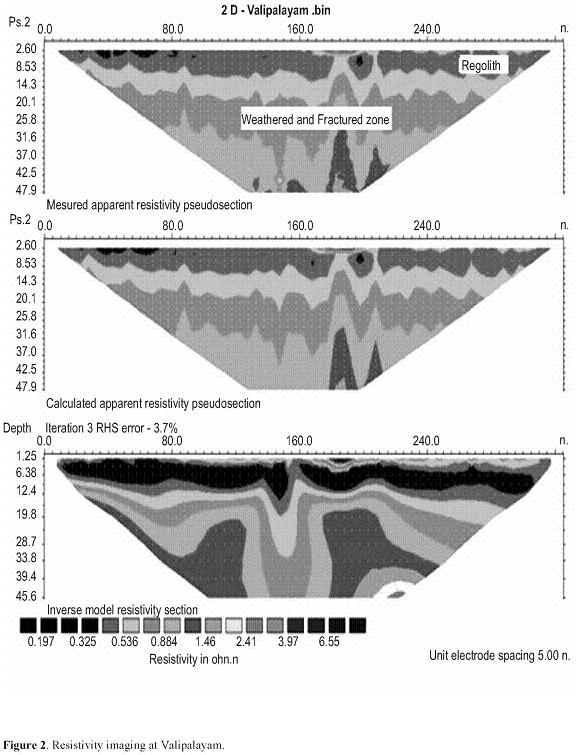
The first survey was conducted at Valipalayam 1Km from river Noyyal (Figure 2). The profile shows a low resistivity zone ranging from 10 to 100 U m, indicating presence of highly weathered rock materials. The basic concept of electrical resistivity method is to demarcate higher resistivity zones within the low electrical resistivity rocks at the sub surface. This is because; the very low resistivity is an indicator of highly weathered rock material. The regolith with a resistivity range of <10 U m is found at a depth of 8 m indicating the contamination of top soil due to the discharge of effluents. The weathered and fractured zones were identified at a depth of 27 to 47 m with increase in resistivity from 46 to 95.5 m indicating that the deeper layers are exposed to groundwater contamination in the absence of clay materials (Ron barker and others, 2001).
The second survey was conducted near Pethichettipuram just 1Km away from the Noyyal river. The survey indicates source of contamination at left end corner with a drop in resistivity by <46.5 U mat a depth of 7.91 m(Figure 3). The same trend was also noted at a depth of 11.5 m with a drop in resistivity by <21.6 U m indicating the contaminated zone at deeper regoliths. This is supported by a groundwater sample collected in a dug well to a depth of 15m showing higher TDS value >3,500 ppm. The fractured and massive rocks revealed higher resistivity varying from 46.7 to 2200 U m indicating the non polluted nature of deeper formations. A thin subsurface layer with low resistivity extends to deeper area in the middle of the profile, followed by a thick layer with high resistivity (resistivity greater than 1000 U m) acting as a basin at deeper depth (Apparao and Sarma, 1993). This basin is more dominant at the last quarter of the traverse where it is closer to the surface. This high resistivity layer could represent the bedrock, which is competent without any structures. From the survey result a geological division is observed between the lower and high resistivity materials. In the central part of the profile a very low resistivity zone exist, indicating existence of an aquifer within the profile, based on its lower resistivity in relation to the background resistivity.

The third survey was conducted in Palayakadu (Figure 4), indicating extensive contamination of regolith from ground surface to 20 m as the resistivity of the regolith drops less than 40 Um. Bed rock resistivity was higher >1058 U m indicating their mas-siveness at shallow depth. The profile produced three different resistivity of layered rock which is clearly defined by their different resistivity layers at various depths as follows; A thin subsurface layer with comparatively low resistivity values ranging from 10 to 46.7 Um at an depth of about 15 m. This layer of low resistivity is typical of weathered rock materials of the underlying rocks in the area. An intermediate resistivity layer ranging from 101 to 218 U m at the intermediate depth zone, which could be represented as weathered to moderately weathered rock material. This depth layer between the depth ranges (15-40 m) has a comparatively moderate resistivity from 150 to 1018 U m. A thick layer with a comparatively high resistivity (>218 Um) is also observed below the layers of low to intermediate resistivity rocks. This relatively high resistivity rock layer represents the presence of fresh rock material with no structural patterns like fractures and joints, as good indications for aquifers (Kelley, 1976) due to their sheared nature represented by the wavy pattern. The shallow depth layers could also be interpreted to be layers of different rock materials. The resistivity layers of the different rock materials in the range (180 to 1080 U m) and its contact with the fresh rock observed at a depth range of about 55 m was also accounted.

The fourth survey conducted at Chellapuram is shown in (Figure 5). The profile indicates that the area is underlined by varying high resistivity rock materials by sharp changes in their electrical resistivity values. The high resistivities observed are typical of fresh granite rocks. The general structural trend observed is as follows; an overburden with low resistivity to a depth of about 29.3m with a resistivity range of (11to 45 U m). This layer is due to the presence of weathered materials with greater risk of contamination (Urish, 1983). An intermediate zone with resistivity range from 663 to 3328 Umata depth of 21.1 to 38.7 m is noted. A very high resistivity zone (125418 U m) is observed at a depth of 55 m indicates fresh rock material without any structural pattern like folds and faults. Resistivity distributions observed at greater depth are high when compared with low resistivity values observed at the surface. The profile therefore could be interpreted as the different layering of weathering with low resistivity values on the surface and higher resistivity values are confined to the fresh electrical resistant rock materials.

Conclusion
An attempt was made in Tirupur a highly industrialized zone to determine the extent of pollution in aquifers by using ERT techniques. A total of 4 profiles were conducted more or less 1 KM and parallel to river Noyyal. The profile at Valipalayam indicates contamination of top soil by a drop in resistivity by < 10 U m at a depth of 8 m. The weathered and fractured zones identified at depth of 27 to 47 m with greater resistivity range indicate deeper layers without any groundwater contamination. The second profile conducted near Pethichettipuram indicates sources of contamination at a depth of 7.91 m with a drop in resistivity <46.5 Ù m. Another drop in resistivity at a depth of 11.5 m indicates the contaminated nature of the deeper regolith. The fractured and massive rocks follow the same trend like that of the first location with greater resistivity. The third survey conducted in Palayakadu indicates greater contamination of regolith at a depth of 0 to 20 m with a resistivity less than 40 Ùm. Bed rock resistivity was higher >1058 Ù m indicating their massiveness present at shallow depth. The fourth survey conducted at Chellapuram indicates high resistivity rock materials which are layered and boundaries of the different resistivity materials are clearly defined by the sharp change in electrical resistivity. The high resistivity observed is typical of fresh granite rocks. From a total of four profiles the first, third and fourth showed top 10 to 25 m of regolith has resistivity of less than 10 Ù m, with top 5 m having a resistivity of less than 10 Ùm indicating soil with greater contamination. The second profile has shown low resistivity at pockets at shallower depth and resistivity of above 100 Ùm is not contaminated. None of the five images measured across the contaminated sites show any strong lateral change in resistivity and it must be admitted that similar information could be obtained with resistivity sounding. A few soundings over the area can indicate likely sites for low resistivity regolith and heavy contamination.
Acknowledgements
Corresponding author thank the Indian National Science Academy (INSA) for the visiting fellowship award and The Director, National Geophysical Research Institute (NGRI) for permission to work under Dr.V.S.Sarma. The author acknowledges the reviewer for his help to improve the MS in the present form.
References
Abem, (2004). Instruction manual, Terrameter SAS 4000/SAS 1000.
Apparao, A. and Sarma, V.S. (1981). A modified pseudo depth section as a tool in resistivity and IP prospecting,Geophysical Research Bulletin, NGRI, India, V. 19, 187-208.
Apparao, A. Sarma, V.S. (1983). The concept of Depth of detection and Depth of investigation in resistivity and IP, Geophysical Research Bulletin, NGRI, India, no. 21, 51-61.
Apparao, A. Subrahmanya Sarma, V. Sivasarama sastry, R. and Srinivas, G.S. (1993). A catalogue of modified pseudodepth sections with different electrode arrays over buried conductive targets, NGRI, Hyderabad (India), 52 pp.
Barker, R. D. Venkateswara, R.T. and Than-garajan, M. (2001). Delineation of contaminant zone through electrical resistivity imagine technique. Current science journal. 81. no. 3, 277-283.
Central Groundwater Board (CGWB) (1993). Groundwater Resources and Development Prospects in Coimbatore District, Tamil Nadu, Central Groundwater Board, 30.
Daniels, F. and Alberty, R.A. (1966). Occam's inversion to generate smooth, two dimensional models form magneto telluric data, Geophysics. 55, 1613-1624.
Dey, A. and Morrison, H.F. (1979a). Resistivity modeling for arbitrary shaped two- dimensional structures.Geophysical Prospecting. 27, 1020-1036.
Edwards, L.S. (1977). A modified pseudo sectionfor resistivity and induced-polarization. Geophysics. 42, 1020-1036.
Griffiths, D.H. and Barker, R.D. (1993). Two-dimensional resistivity imaging and modeling in areas of complex geology, Applied Geophysics. 29, 211-226.
Gustavsson, Y., Jacks, G., Nilsson, L.Y. and Taranger, B. (1970). Water resources and water supply in Coimbatore district, Tamil Nadu, India, Department of land improvement and drainage school of surveying, Royal Institute of Technology, Stockholm.
Jacob Thomson (1998). Impact of Industries on the Ground Water Quality of Tiruppur and its Ethical Implications, Ph.D. Thesis, Dept. of Zoology, University of Madras, Chennai.
Keller, G.V. and Frischknecht, F.C. (1966). Electrical methods in geophysical prospecting, Pergamon Press, Oxford.
Kelly W.E. (1976). Geoelectric sounding for delineating groundwater contamination, Ground water, 14, 6-10.
Kristina furn, (2004). Effect ofdyeing and bleaching industries on the area around the Oratha-palayam Dam in Southern India, UPTEC W04033, ISSN 1401-5765, Tryckt hos Institutionen for geovetenskaper, Uppsala Universitet, Uppsala, pp 99.
Loke, M.H. (1997). Electrical imaging surveys for environmental and engineering studies - a practical guide to 2D and 3D survey, Penang, Malaysia, Universiti Sains Malaysia, unpublished short training course lecture notes.
Loke, M.H. (1997). RES2DINV ver. 3.3 for Windows 3.1, 95, and NT, Advanced Geosciences, Inc, pp. 66.
Loke, M.H. (2004). Rapid2-D resistivity and IP inversion using the least-square method; Manual for Res2dinv,version 3.54, p53.
Pathak B. and Venkatesshwar Rao,(2001). Geoelectrical Investigation to locate groundwater resources for urban development: A case study in parts of greater Guwahati urban area, Assam, Geophysics, XXII-1:41-46.
Public Works Department (PWD) (2003). Statement Showing the Hydraulic Particulars of P.W.D. Tanks, Sub-Division Irrigation, Coimbatore.
Raja Guru, P and Subbram V (2000), Ground Water Quality in Tiruppur, Environmental Awareness on Quality Management of Irrigation Water, Edited by Lakshmanaperumalsamy and Krishnaraj, Department of Environmental Sciences, Bha-rathiyar University, Coimbatore.
Sankaraaj, L., Subramanian, T.P., Siddhamalai, A. & Farooque Ahmed, N. (2002). Quality of soil and water for agriculture in noyyal river basin, Tamil Nadu. Joint director of agriculture (Research), Soil Survey and Land Use Organization, Tamil Nadu Department of Agriculture, Coim- batore.
Senthilnathan, S and Azeez, P.A. (1999). Influence of dyeing and bleaching industries on ground water of Tirupur, Tamil Nadu, India. Bull Environ Contam Toxicol, 62:330-335.
Silvestre, P.P. and Ferrari, R.L. (1990). Finite elements for electrical engineers, 2nd edition, Cambridge University Press.
SSLUO (Soil Survey & Land Use Organisation) (1998). Soil Atlas Coimbatore District, Department ofAgriculture Tamil Nadu, Coimbatore.
Urish, D.W. (1983).The practical application of surface Electrical Resistivity to detection of ground water pollution. Groundwater, 21:144-152.
How to Cite
APA
ACM
ACS
ABNT
Chicago
Harvard
IEEE
MLA
Turabian
Vancouver
Download Citation
Article abstract page views
Downloads
License
Earth Sciences Research Journal holds a Creative Commons Attribution license.
You are free to:
Share — copy and redistribute the material in any medium or format
Adapt — remix, transform, and build upon the material for any purpose, even commercially.
The licensor cannot revoke these freedoms as long as you follow the license terms.
The Earth Sciences Research Journal is the copyright holder for these license attributes.