Published
Mapping of Underwater Seabed Morphology of the Gaza Strip Coastal Zone Using Remote Sensing Technique
DOI:
https://doi.org/10.15446/esrj.v20n2.50256Keywords:
Remote sensing, seabed morphology, depth-invariant index, Gaza Strip, Palestine, Teledetección, morfología del suelo marino, índice de profundidad no variable, Franja de Gaza, Palestina. (en)The study investigated the feasibility of applying the depth-invariant index algorithm to delineate the shallow underwater geomorphological features using QuickBird imagery. Although the technical procedures of the depth invariant index are already demonstrated in the professional literature, the algorithm needs to be applied and tested in several coastal regions with different seawater conditions and properties. Some of the geomorphological features in the coastal zone of the Gaza Strip are seasonal features such as underwater sand bars. However, since these features are non-permanent and dynamic, it would be useful to utilize satellite data to detect changes in both locations and depth, and also to monitor this feature in shallow coastal water. The importance of identifying the underwater sand bars in the coastal zone can be significant in the case of rip currents, and swimming conditions.Additionally, using satellite imagery for detecting dynamic underwater coastal morphologies may enable local authorities to adopt such an algorithm with a combination of satellite imagery for fast, efficient and extensive coverage mapping. While information about seafloor features can be obtained using active satellite data such as RADAR or LiDAR imagery, active satellite data are not available and require advanced processing and logistical resources, which are difficult to obtain in the case of the Gaza Strip. The study instead used passive QuickBirdsatellite imagery to map and delineate the seabed morphologies through the calculating the depth-invariant index for the spectral bands. By using the depth-invariant index, it was possible to distinguish and delineate the major underwater sand bars within the entire coastal zone of the Gaza Strip. Also, the spectral and spatial resolution ofQuickBird imagery exhibited a substantial capability in mapping and delineating the underwater seabed morphologies.
Resumen
El estudio investigó la factibilidad de aplicar el algoritmo Índice de Profundidad Invariante para delinear las características geomorfológicas del suelo bajo el agua a través de las imágenes QuickBird. A pesar de que los procedimientos técnicos del Índice de Profundidad Invariante se han demostrado ampliamente en la literatura profesional, el algoritmo debe ser aplicado y verificado en varias regiones costeras con diferentes condiciones y propiedades del agua marina. Algunas de las condiciones geomorfológicas en la zona costera de la Franja de Gaza dependen de las estaciones, como las barreras de arena bajo el agua. Sin embargo, como estas condiciones son dinámicas, sería útil usar la información satelital para detectar cambios en las locaciones y en la profundidad, y para vigilar estas condiciones en el agua costera poco profunda. La importancia de identificar las barreras de arena en la zona costera puede ser determinante en el caso de corrientes violentas o para las condiciones de inmersión. Adicionalmente, el uso de imágenes satelitales para determinar las dinámicas morfológicas costeras bajo el agua podría permitir a las autoridades locales adoptar un algoritmo que combinado con dichas imágenes presente un mapeo más rápido, más eficiente y de mayor cobertura. Si bien la información sobre las características del suelo oceánico pueden obtenerse con información satelital activa como las imágenes de RADAR o LiDAR, la información no está disponible, además de requerir un procesamiento avanzado y recursos logísticos, que son difíciles de obtener en el caso de la Franja de Gaza. Este estudio, por su parte, utiliza imágenes satelitales pasivas de QuickBird para mapear y delinear las morfologías del lecho del mar a través de calcular el Índice de Profundidad Invariante para las bandas espectrales. Al utilizar el Índice de Profundidad Invariante fue posible determinar y delinear las mayores barreras de arena en toda la costa de la Franja de Gaza. La resolución espacial y espectral de las imágenes de QuickBird mostraron una capacidad sustancial en el mapeo y delineamiento de las morfologías del lecho marino
Doi: https://doi.org/10.15446/esrj.v20n2.50256
Mapping of Underwater Seabed Morphology of the Gaza Strip Coastal Zone Using Remote sensing technique
Mapeo de la morfología del suelo oceánico en la zona costera de la Franja de Gaza a través de la técnica de detección remota
Khaldoun Abualhin
Al-Azhar University-Gaza, Gaza, Gaza Strip, P.O. Box 1277, Palestine, khaldon@alazhar.edu.ps
Record
Manuscript received: 19/04/2015 Accepted for publication: 26/04/2016
How to cite item
Abualhin, K. (2016). Mapping of Underwater Seabed Morphology of the Gaza Strip Coastal Zone Using Remote sensing technique. Earth Sciences Research Journal, 20(2), C1-C7. doi: https://doi.org/10.15446/esrj.v20n2.50256
ABSTRACT
The study investigated the feasibility of applying the depth-invariant index algorithm to delineate the shallow underwater geomorphological features using QuickBird imagery. Although the technical procedures of the depth-invariant index are already demonstrated in the professional literature, the algorithm needs to be applied and tested in several coastal regions with different seawater conditions and properties. Some of the geomorphological features in the coastal zone of the Gaza Strip are seasonal features such as underwater sand bars. However, since these features are non-permanent and dynamic, it would be useful to utilize satellite data to detect changes in both locations and depth, and also to monitor this feature in shallow coastal water. The importance of identifying the underwater sand bars in the coastal zone can be significant in the case of rip currents, and swimming conditions. Additionally, using satellite imagery for detecting dynamic underwater coastal morphologies may enable local authorities to adopt such an algorithm with a combination of satellite imagery for fast, efficient and extensive coverage mapping. While information about seafloor features can be obtained using active satellite data such as RADAR or LiDAR imagery, active satellite data are not available and require advanced processing and logistical resources, which are difficult to obtain in the case of the Gaza Strip. The study instead used passive QuickBird satellite imagery to map and delineate the seabed morphologies through the calculating the depth-invariant index for the spectral bands. By using the depth-invariant index, it was possible to distinguish and delineate the major underwater sand bars within the entire coastal zone of the Gaza Strip. Also, the spectral and spatial resolution of QuickBird imagery exhibited a substantial capability in mapping and delineating the underwater seabed morphologies.
Keywords: Remote sensing, seabed morphology, depth-invariant index, Gaza Strip, Palestine.
RESUMEN
El estudio investigó la factibilidad de aplicar el algoritmo Índice de Profundidad Invariante para delinear las características geomorfológicas del suelo bajo el agua a través de las imágenes QuickBird. A pesar de que los procedimientos técnicos del Índice de Profundidad Invariante se han demostrado ampliamente en la literatura profesional, el algoritmo debe ser aplicado y verificado en varias regiones costeras con diferentes condiciones y propiedades del agua marina. Algunas de las condiciones geomorfológicas en la zona costera de la Franja de Gaza dependen de las estaciones, como las barreras de arena bajo el agua. Sin embargo, como estas condiciones son dinámicas, sería útil usar la información satelital para detectar cambios en las locaciones y en la profundidad, y para vigilar estas condiciones en el agua costera poco profunda. La importancia de identificar las barreras de arena en la zona costera puede ser determinante en el caso de corrientes violentas o para las condiciones de inmersión. Adicionalmente, el uso de imágenes satelitales para determinar las dinámicas morfológicas costeras bajo el agua podría permitir a las autoridades locales adoptar un algoritmo que combinado con dichas imágenes presente un mapeo más rápido, más eficiente y de mayor cobertura. Si bien la información sobre las características del suelo oceánico pueden obtenerse con información satelital activa como las imágenes de RADAR o LiDAR, la información no está disponible, además de requerir un procesamiento avanzado y recursos logísticos, que son difíciles de obtener en el caso de la Franja de Gaza. Este estudio, por su parte, utiliza imágenes satelitales pasivas de QuickBird para mapear y delinear las morfologías del lecho del mar a través de calcular el Índice de Profundidad Invariante para las bandas espectrales. Al utilizar el Índice de Profundidad Invariante fue posible determinar y delinear las mayores barreras de arena en toda la costa de la Franja de Gaza. La resolución espacial y espectral de las imágenes de QuickBird mostraron una capacidad sustancial en el mapeo y delineamiento de las morfologías del lecho marino.
Palabras clave: Teledetección, morfología del suelo marino, índice de profundidad no variable, Franja de Gaza, Palestina.
Introduction
Several techniques and algorithms have been developed to use satellite imagery for environmental monitoring and coastal habitats mapping. The mapping of underwater seabed morphologies includes several features such as massive valleys, canyons, rocky outcrops, geomorphological features, and sand bars [Goudie, 2004; Pavlopoulos et al., 2009]. Seabed morphologies are an important element of coastal protection and planning elements and also in mapping marine habitats and their management. Accordingly, it is necessary for the researcher to get detailed information about seabed morphology and habitats in the nearshore coastal zone. Recently, modern methods of marine surveying such as echo sounder and active satellite sensors like LiDAR data are used for scanning the seabed. The advantages of these modern techniques of mapping are on the accuracy and also a full range of depth coverage. On the other hand, these methods of seabed mapping are expensive, time-consuming, and difficult to process. In contrast, passive remotely sensed data have been shown to offer a reasonable alternative in providing reliable and low-cost information about coastal habitats and morphologies [Mumby and Edwards, 2002; Mumby et al., 2004]. Different passive satellite imagery has been used in studying coral reef and classification, benthic habitats classification, sand bottoms delineation and in other studies [Ahmad and Neil, 1994; Andréfou t et al., 2003; Edwards et al., 1999; Green et al., 2000; Hochberg and Atkinson, 2003; Michalek et al., 1993; Mishra et al., 2006; Mumby et al., 1998; Mumby and Edwards, 2002; Mumby and Harborne, 1999; Mumby et al., 2004; Ong et al., 1998; Pasqualini et al., 2005; Stumpf et al., 2003; Vanderstraete et al., 2003]. Mishra et al. (2006) utilized QuickBird multispectral data for identifying and classifying tropical-marine benthic habitats. In 1998, Ong and Hick combined spectral data and digital bathymetry to auto-classify larger benthic habitats. Pasqualini et al., (2005) used SPOT5 satellite imagery to map seagrasses. Mumby et al., (1997a,b, 1998) compared the descriptive resolutions of various remote sensing methods for mapping coral reef habitats of the Turks and Caicos Islands. Other researchers simulated IKONOS data for different seabeds and coral reef habitat mapping [Andréfouet et al., 2003; Hochberg and Atkinson, 2003].
Mumby et al., (2004) provided a general review of what can and cannot be mapped using passive remote sensing data and summarized the capacity of various methods to predict and derive bathymetry from different types of optical imagery [Jupp, 1988; Stumpf et al., 2003]. In terms of satellite spectral and spatial resolutions, multispectral imagery with coarse and medium spatial resolution, Landsat TM, Landsat ETM+, ASTER, and IKONOS satellite data are considered useful tools for monitoring the spatial dynamics of habitats [Mumby and Edwards, 2002; Mumby and Harborne, 1999]. However, taking into consideration the similarity in spectral resolution and the width of the spectral band between QuickBird and IKONOS sensors, the ability of QuickBird data to discriminate seabed morphology in the shallow coastal region is comparable to IKONOS data.
In this study, QuickBird satellite imagery was used to delineate the seabed morphology of sand bars mainly in the nearshore of the Gaza Strip coastal zone. In addition to oceanographic factors, the coastal region of the Gaza Strip suffers from intensive anthropogenic pollution and other manmade interventions along the entire coastal zone. Moreover, as a result of Israel's blockade of the Gaza Strip and the subsequent limitation on resources, it is not always possible to use the most recent technologies and tools for mapping and monitoring the coastal zone, including the mapping of underwater morphologies. As it is important to get up-to-date information about seabed morphologies for monitoring the changing conditions of the coastal zone, a QuickBird satellite image was used to extrapolate the underwater morphology of sand bars along the coastal zone of the Gaza Strip. Underwater bars can defined as an aggregation of ridges of sediments whose formation, morphology and behavior were determined by interactions between waves, currents, tides, local slope and grain size. Bowman and Goldsmith (1983) delineated a wide range of nearshore sand bars and shoal patterns along the Southeastern Mediterranean coastline. Their study identified three major types of sand bars: non-rhythmic parallel-meandering bar; inner single-crescentic bars; and, double-crescentic bars [Bowman and Goldsmith, 1983].
Study area
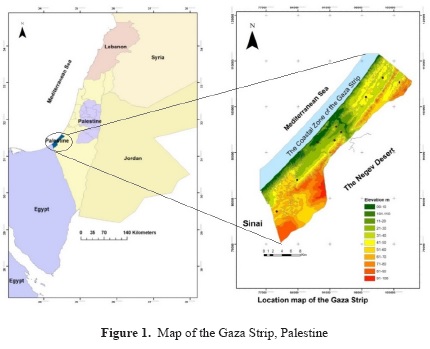
The Gaza Strip is a part of historical Palestine and is located on the south eastern Mediterranean coast and bordered by Sinai from the south and the Negev desert from the east (Figure 1). The current area of the Gaza Strip is 360 km² with an estimated human population density of 4167 per km². The geographic coordinates of the Lower Left and Upper Right corners of the Gaza Strip are 31.31 N, 34.2 E; and 31.53 N, 34.56 E. The shoreline of the Gaza Strip is a smooth line that extends 42 km. The coastal zone includes sand dunes in the south and north, coastal cliffs, and the Wadi Gaza mouth area. Wadi Gaza is the main seasonal river in the Gaza Strip and influence the biodiversity in the Gaza Strip than it does today.
Methodology
Seabed feature and underwater patterns can be mapped from passive remote sensing imagery if the influence of the water column was removed. The implementation of the physical relation between spectral reflectance and light attenuation is the base of extracting information from multispectral satellite imagery over water bodies. The incident radiation on the water column is absorbed and scattered or reflected unequally. The attenuation influence can be estimated over the entire multispectral image by getting water depth at several pixels in the image [Lyzenga, 1981]. However, to neutralize the influence of seawater on the reflected signal, an attenuation coefficient must be calculated at each pixel in the image [Green et al., 2000]. Lyzenga (1978, 1981) proposed a simple image-based technique to combine the information in various spectral wavelengths to produce the depth-invariant index. In this method, the ratio of water attenuation coefficients are required and optical properties considered uniform.
Depth-Invariant Index
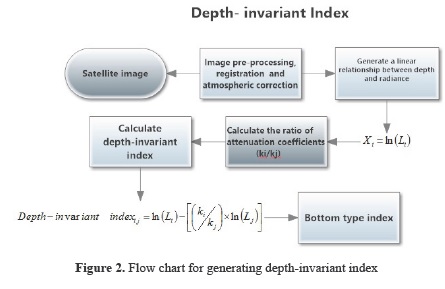
The concept of extracting bottom-type information in shallow water depends on the fact that the reflected seabed-radiance is a linear function of bottom reflectance and an exponential function of water depth [Lyzenga, 1978]. The technique to calculate depth-invariant index involves three main steps: (1) generate a linear relationship between depth and radiance; (2) calculate the ratio of attenuation coefficients of band pairs; and, (3) calculate the depth-invariant index of bottom type (Figure 2).
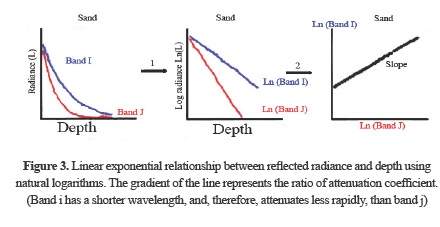
Since the relationship between the depth and reflected radiance over water bodies is an exponential relation, this relationship can be transformed using a natural logarithm (Equation 1) to become a linear relationship. For a given bottom type, the transformed radiance in bands (i) and (j) is linearly (Figure 3). The transformed radiance will attenuate linearly with increasing water depth.
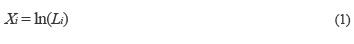
where has transformed reflectance in the band (i). Li has atmospherically corrected radiance in the band (i). Ln is the natural logarithm.
Accordingly, the transformed radiance in the band (i) is plotted versus the transformed radiance in the band (j) at variable depth and constant bottom type (Figure 3. The result falls along a straight line. Consequently, different bottom types should provide different parallel lines [Lyzenga, 1981]. The slope of the lines represents the ratio of attenuation coefficients for each spectral band (Figure 4 and Figure 5).
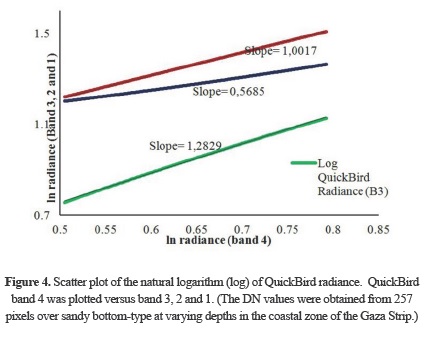
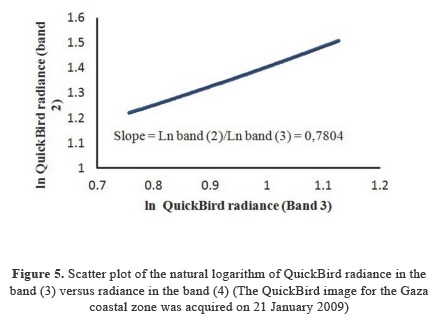
The ratios of the attenuation coefficients of the spectral bands were derived from the scattering bi-plot. The slope of the scatter plot trend line represents the ratio of attenuation coefficients (Figure 5). The slope of the trend line will depend on the variable chosen to be the dependant variable. Accordingly, using Equation 2, the ratio of attenuation coefficients (ki/kj) will not depend on the order the variable.

where σii and σjj are the variances for i and j measurements respectively, and σij is the covariance between i and j bands.
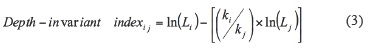
Once the ratios of attenuation coefficients are calculated, the depth-invariant indexes can be calculated using Equation 3 for the entire image. Each pair of spectral bands produces a single depth-invariant index for the bottom type.
Implementation of Depth-Invariant Index Algorithm on QuickBird Image
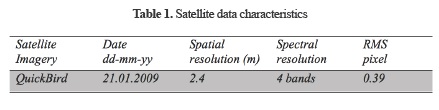
A QuickBird satellite image acquired on 21 January 2009 at 08:35 GMT was used to calculate the depth-invariant indices and then to map the seabed morphology along the coastal zone of the Gaza Strip. The QuickBird image was radiometrically and geometrically corrected. The image was registered to the topographic map with RMS less than 0.4 pixels (Table 1). The atmospheric correction was then performed using the ENVI FLAASH module. The homogeneous regions in the satellite image with a uniform bottom reflectance were selected to be used for attenuation coefficient calculation. The ratio of attenuation coefficients was calculated based on the equation 2. Table 2 shows the calculated attenuation coefficients ratios (ki/kj) for each pair of spectral bands.

Results and discussion
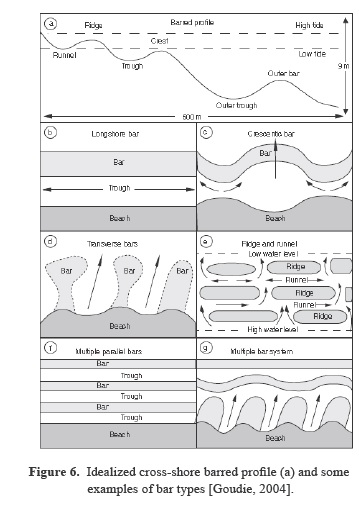
Several depth-invariant indices were calculated from QuickBird imagery for the coastal zone of the Gaza Strip, portraying different abilities to recognize seabed morphology. For example the calculated index from band 1 and band 3 demonstrated the ability to map features in shallow depth up to 10 m. The index derived from band 2 and band 3 showed the feasibility of mapping features at shallow water depth. The index of band 2 and band 4 as well as an index of the band 3 and band 4 obtained reasonable results in mapping the very shallow coastal bars at depth varying from 0.0 -1.5 m. These bars welded to the coastline. Accordingly, different types of seabed bars were clearly observed and delineated at different locations in the entire coastal zone and nearshore zone of the Gaza Strip. Types of bars are often distinguished based on their shape and orientation about the shoreline. They may be linear, sinuous or crescentic, or they may consist of alternating transverse bars, which are welded to the shoreline and are separated by channels occupied by rip currents, as seen in Figure 6 [Goudie, 2004].
The mapped sand bars in the coastal zone of the Gaza Strip were similar to those observed by [Almagor and Hall, 1984; Bowman and Goldsmith, 1983; Goldsmith et al., 1982], in the South-eastern Mediterranean coast. Some of these sand bars are seasonal occurrences while others occur throughout the year.
The delineated underwater sand bars in the Gaza Strip coastal zone were as follows: single-crescentic bars; anvil-shaped transverse bars, oblique transverse bars, initial crescentic bars, double crescentic bars and triple crescentic bars. Figure 7 shows the different types of underwater sand bars delineated in the nearshore of the Gaza Strip. As mentioned above, depth-invariant indices demonstrated disparities in their sensitivity to mapping seabed features in the shallow coastal region. For instance, double and triple crescentic bar systems can be delineated using the ratio index of band 1 and band 2. The ratio of band 2 and band 3 achieved a respectable result in mapping different sand bar systems at different locations. The indices of band 2 and band 4 and of band 3 and band 4 showed less capability in mapping sand bar features.

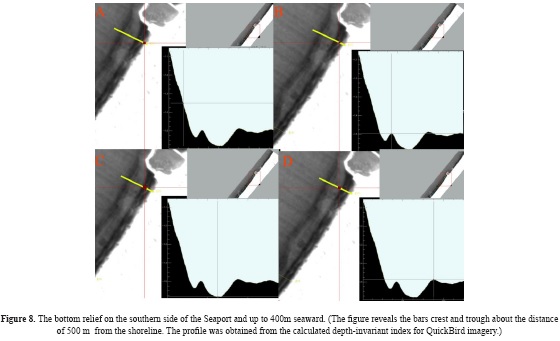
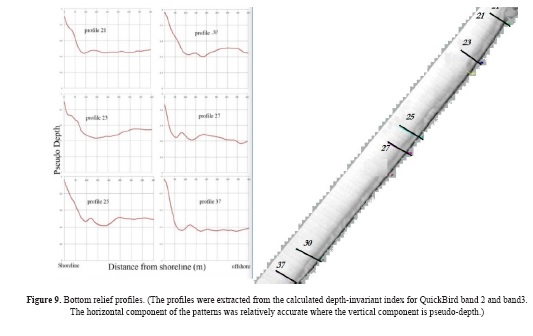
In addition, the calculated depth-invariant indices provided a dimensionless bottom relief in the nearshore zone of the Gaza Strip. Several bottom relief profiles were generated perpendicular to the coastline (Figure 7 and Figure 8). Figure 8 shows a variation in the seabed relief on both sides of the fishing port. This variation may be the result of sediments being transported from the Nile Delta to the Southeastern Mediterranean nearshore shelf by northward longshore currents [Rohrlicht and Goldsmith, 1984; Zviely et al., 2007]. Since the sediments are trapped and accumulated at the southern side of the fishing port, the sand supply to the northern side of the fishing port has decreased. Two sandbars appeared at the southern side of the fishing port and located at a distance of 100 m up to 400 m from the coastline. Figure 9 illustrates the bottom relief of the general morphology and distribution of the underwater sand bars.
Utilizing the ENVI Topographic Modelling tool, the slope, the aspect and the shaded relief image were derived from the seabed indices (Figure 10). Index from band 1 and band b3 demonstrated a slope gradient of the Gaza Strip coastal zone ranging from 0.57° to 0.41° at a distance of 50 m to 100 m from the coastline.

Conclusion
Gathering Information about seabed morphology and bottom profiles requires advanced instruments and sometimes it is a time-consuming process. Data collection may also be complicated by challenging field and logistical circumstances beyond the control of researchers, as has been the case in the Gaza Strip. Nevertheless, remotely sensed imagery has provided an alternative method for generating bathymetric maps with reasonable accuracy. In particular, the utilization of the depth-invariant index to map and delineate underwater seabed morphology has proven effective. The study confirmed the possibility of deriving underwater seabed morphology in shallow water. The calculated indices provided interesting results on mapping seabed morphology such as sand bars and bottom profile. The method enables mapping and delineates the major underwater sand bars along the entire coastal zone of the Gaza Strip. Importantly, various types of seabed morphologies were clearly observed and defined at different regions and depths in the Gaza Strip coastal zone such as crescentic bars, single-crescentic bars, double-crescentic bars, triple crescentic bars and transverse bars. Some bar systems were located onshore and attached to the shoreline at a very shallow depth of up to 2 meters, as was the case for transverse bars, which then moved offshore to form crescent bars. Consequently double crescent bars are formed at a deeper depth and distance from 150 up to 400 meters offshore.
Finally, as the nearshore region of the Gaza Strip is homogeneous and consists mainly of sandy sediments, the spectral and spatial resolution of QuickBird imagery were useful in distinguishing natural variations and contrasts due to optical physical properties of coastal habitats. QuickBird imagery exhibited a substantial capacity to delineate underwater seabed morphology by using depth-invariant index technique. The achieved findings were quite satisfying and consistent with published information on the region.
Acknowledgment
Special gratitude is extended to the DAAD (German Exchange Service) for funding support and the purchase the QuickBird image.
References
Ahmad, W., & Neil, D. (1994). An evaluation of Landsat Thematic Mapper (TM) digital data for discriminating coral reef zonation: Heron Reef (GBR). International Journal of Remote Sensing, 15, 2583-2597.
Almagor, G., Gill, D., & Perath, I. (2000). Marine sand resources offshore Israel. Marine Georesources and Geotechnology, 18, 1-42.
Almagor, G., & Hall, J. (1984). Morphology and bathymetry of the Mediterranean Continental margin of Israel. Geological Survey of Israel Bulletin, 77.
Andréfouet, S., Kramer, P., Torres-Pulliza, D., Joyce, K., Hochberg, E., Garza-Pérez, R., Mumby, P., Riegl, B., Yamano, H., & White, W. (2003). Multi-site evaluation of IKONOS data for classification of tropical coral reef environments. Remote Sensing of Environment, 88, 128-143.
Bowman, D., & Goldsmith, V. (1983). Bar morphology of dissipative beaches: an empirical model. Marine Geology, 51, 15-33.
Edwards, A., Mumby, P., Green, E., & Clark, C. (1999). Applications of Satellite and Airborne Image Data to Coastal Management: Seventh Computer-Based Learning Module (BILKO for Windows). Paris: UNESCO.
Goldsmith, V., Bowman, D., & Kiley, K. (1982). Sequential stage development of crescentic bars: HaHoterim Beach, Southeastern Mediterranean. Journal of Sedimentary Petrology, 52, 233-249.
Goudie, A. (2004). Encyclopedia of geomorphology. New York: Routledge Ltd.
Green, E., Mumby, P., Clark, C., & Edwards, T. (2000). Remote sensing handbook for tropical coastal management. Paris: UNESCO.
Green, E., Mumby, P., Edwards, A., & Clark, C. (1996). A review of remote sensing for the assessment and management of tropical coastal resources. Coastal Management, 24, 1-40.
Hochberg, E., & Atkinson, M. (2003). Capabilities of remote sensors to classify coral, algae, and sand as pure and mixed spectra. Remote Sensing of Environment, 85, 174-189.
Huston, M. (1994). Biological Diversity: The Coexistence of Species. Cambridge: Cambridge University Press.
Jupp, D. (1988). Background and extension to depth of penetration(DOP) mapping in shallow coastal waters. In, Proceedings of the Symposium on Remote Sensing of the Coastal Zone. Gold Coast, Queensland.
Lyzenga, D. (1978). Passive remote sensing techniques for mapping water depth and bottom features. Appl. Opt, 17, 379-383.
Lyzenga, D. (1981). Remote sensing of bottom reflectance and water attenuation parameters in shallow water using aircraft and Landsat data. International Journal of Remote Sensing, 2, 71-82.
Michalek, J., Wagner, T., Luczkovich, J., & Stoffle, R. (1993). Multispectral change vector analysis for monitoring coastal marine environments. Photogrammetric engineering and remote sensing, 59, 381-384.
Mishra, D., Narumalani, S., Rundquist, D., & Lawson, M. (2006). Benthic habitat mapping in tropical marine environments using QuickBird multispectral data. Photogrammetric engineering and remote sensing, 72, 1037.
Mumby, P. J., Green, E. P., Edwards, A. J., & Clark, C. D. (1997). Coral reef habitat mapping: how much detail can remote sensing provide?. Marine Biology, 130(2), 193-202.
Mumby, P. J., Green, E. P., Clark, C. D., & Edwards, A. J. (1997). Reefal habitat assessment using (CASI) airborne remote sensing. In Proc 8th Int Coral Reef Symp (Vol. 2, pp. 1499-1502).
Mumby, P., Clark, C., Green, E., & Edwards, A. (1998). Benefits of water column correction and contextual editing for mapping coral reefs. International Journal of Remote Sensing, 19, 203-210.
Mumby, P., & Edwards, A. (2002). Mapping marine environments with IKONOS imagery: enhanced spatial resolution can deliver greater thematic accuracy. Remote Sensing of Environment, 82, 248-257.
Mumby, P., & Harborne, A. (1999). Development of a systematic classification scheme of marine habitats to facilitate regional management and mapping of Caribbean coral reefs. Biological Conservation, 88, 155-163.
Mumby, P., Skirving, W., Strong, A., Hardy, J., LeDrew, E., Hochberg, E., Stumpf, R., & David, L. (2004). Remote sensing of coral reefs and their physical environment. Marine pollution bulletin, 48, 219-228.
Ong, C., Hick, P., Burt, J., & Wyllie, A. (1998). Marine habitat mapping using data from the Geoscan airborne multi-spectral scanner. Geocarto International, 13, 27 - 34.
Pasqualini, V., Pergent-Martini, C., Pergent, G., Agreil, M., Skoufas, G., Sourbes, L., & Tsirika, A. (2005). Use of SPOT 5 for mapping seagrasses: an application to Posidonia Oceanica. Remote Sensing of Environment, 94, 39-45.
Pavlopoulos, K., Evelpidou, N., & Vassilopoulos, A. (2009). Mapping Geomorphological Environments. Berlin: Springer Verlag.
Rohrlicht, V., & Goldsmith, V. (1984). Sediment Transport along the Southeast Mediterranean: A geological perspective. Geo-Marine Letters, 4, 99-103.
Stumpf, R., Holderied, K., & Sinclair, M. (2003). Determination of water depth with high-resolution satellite imagery over variable bottom types. Limnology and Oceanography, 48, 547-556.
Vanderstraete, T., Goossens, R., & Ghabour, T. (2003). Can ASTER-data be used for bathymetric mapping of coral reefs in the Red Sea using digital photogrammetry? In, Proceedings of the Second Workshop of the EARSeL Special Interest Group on Remote Sensing for Developing Countries (pp. 212-218). Bonn, Germany.
Zviely, D., Kit, E., & Klein, M. (2007). Longshore sand transport estimates along the Mediterranean coast of Israel in the Holocene. Marine Geology, 238, 61-73.
References
References
Ahmad, W., & Neil, D. (1994). An evaluation of Landsat Thematic Mapper (TM) digital data for discriminating coral reef zonation: Heron Reef (GBR). International Journal of Remote Sensing, 15, 2583-2597.
Almagor, G., Gill, D., & Perath, I. (2000). Marine sand resources offshore Israel. Marine Georesources and Geotechnology, 18, 1-42.
Almagor, G., & Hall, J. (1984). Morphology and bathymetry of the Mediterranean Continental margin of Israel. Geological Survey of Israel Bulletin, 77.
Andréfouet, S., Kramer, P., Torres-Pulliza, D., Joyce, K., Hochberg, E., Garza-Pérez, R., Mumby, P., Riegl, B., Yamano, H., & White, W. (2003). Multi-site evaluation of IKONOS data for classification of tropical coral reef environments. Remote Sensing of Environment, 88, 128-143.
Bowman, D., & Goldsmith, V. (1983). Bar morphology of dissipative beaches: an empirical model. Marine Geology, 51, 15-33.
Edwards, A., Mumby, P., Green, E., & Clark, C. (1999). Applications of Satellite and Airborne Image Data to Coastal Management: Seventh ComputerBased Learning Module (BILKO for Windows). Paris: UNESCO.
Goldsmith, V., Bowman, D., & Kiley, K. (1982). Sequential stage development of crescentic bars: HaHoterim Beach, Southeastern Mediterranean. Journal of Sedimentary Petrology, 52, 233-249.
Goudie, A. (2004). Encyclopedia of geomorphology. New York: Routledge Ltd.
Green, E., Mumby, P., Clark, C., & Edwards, T. (2000). Remote sensing handbook for tropical coastal management. Paris: UNESCO.
Green, E., Mumby, P., Edwards, A., & Clark, C. (1996). A review of remote sensing for the assessment and management of tropical coastal resources. Coastal Management, 24, 1-40.
Hochberg, E., & Atkinson, M. (2003). Capabilities of remote sensors to classify coral, algae, and sand as pure and mixed spectra. Remote Sensing of Environment, 85, 174-189.
Huston, M. (1994). Biological Diversity: The Coexistence of Species. Cambridge: Cambridge University Press.
Jupp, D. (1988). Background and extension to depth of penetration (DOP) mapping in shallow coastal waters. In, Proceedings of the Symposium on Remote Sensing of the Coastal Zone. Gold Coast, Queensland.
Lyzenga, D. (1978). Passive remote sensing techniques for mapping water depth and bottom features. Appl. Opt, 17, 379-383.
Lyzenga, D. (1981). Remote sensing of bottom reflectance and water attenuation parameters in shallow water using aircraft and Landsat data. International Journal of Remote Sensing, 2, 71-82.
Michalek, J., Wagner, T., Luczkovich, J., & Stoffle, R. (1993). Multispectral change vector analysis for monitoring coastal marine environments. Photogrammetric engineering and remote sensing, 59, 381-384.
Mishra, D., Narumalani, S., Rundquist, D., & Lawson, M. (2006). Benthic habitat mapping in tropical marine environments using QuickBird multispectral data. Photogrammetric engineering and remote sensing, 72, 1037.
Mumby, P. J., Green, E. P., Edwards, A. J., & Clark, C. D. (1997). Coral reef habitat mapping: how much detail can remote sensing provide? Marine Biology, 130(2), 193-202.
Mumby, P. J., Green, E. P., Clark, C. D., & Edwards, A. J. (1997). Reefal habitat assessment using (CASI) airborne remote sensing. In Proc 8th Int Coral Reef Symp (Vol. 2, pp. 1499-1502).
Mumby, P., Clark, C., Green, E., & Edwards, A. (1998). Benefits of water column correction and contextual editing for mapping coral reefs. International Journal of Remote Sensing, 19, 203-210.
Mumby, P., & Edwards, A. (2002). Mapping marine environments with IKONOS imagery: enhanced spatial resolution can deliver greater thematic accuracy. Remote Sensing of Environment, 82, 248-257.
Mumby, P., & Harborne, A. (1999). Development of a systematic classification scheme of marine habitats to facilitate regional management and mapping of Caribbean coral reefs. Biological Conservation, 88, 155-163.
Mumby, P., Skirving, W., Strong, A., Hardy, J., LeDrew, E., Hochberg, E., Stumpf, R., & David, L. (2004). Remote sensing of coral reefs and their physical environment. Marine pollution bulletin, 48, 219-228.
Ong, C., Hick, P., Burt, J., & Wyllie, A. (1998). Marine habitat mapping using data from the Geoscan airborne multi-spectral scanner. Geocarto International, 13, 27 - 34.
Pasqualini, V., Pergent-Martini, C., Pergent, G., Agreil, M., Skoufas, G., Sourbes, L., & Tsirika, A. (2005). Use of SPOT 5 for mapping seagrasses: an application to Posidonia Oceanica. Remote Sensing of Environment, 94, 39-45.
Pavlopoulos, K., Evelpidou, N., & Vassilopoulos, A. (2009). Mapping Geomorphological Environments. Berlin: Springer Verlag.
Rohrlicht, V., & Goldsmith, V. (1984). Sediment Transport along the Southeast Mediterranean: A geological perspective. Geo-Marine Letters, 4, 99-103.
Stumpf, R., Holderied, K., & Sinclair, M. (2003). Determination of water depth with high-resolution satellite imagery over variable bottom types. Limnology and Oceanography, 48, 547-556.
Vanderstraete, T., Goossens, R., & Ghabour, T. (2003). Can ASTER-data be used for bathymetric mapping of coral reefs in the Red Sea using digital photogrammetry? In, Proceedings of the Second Workshop of the EARSeL Special Interest Group on Remote
Sensing for Developing Countries (pp. 212-218). Bonn, Germany.
Zviely, D., Kit, E., & Klein, M. (2007). Longshore sand transport estimates along the Mediterranean coast of Israel in the Holocene. Marine Geology, 238, 61-73.
How to Cite
APA
ACM
ACS
ABNT
Chicago
Harvard
IEEE
MLA
Turabian
Vancouver
Download Citation
License
Earth Sciences Research Journal holds a Creative Commons Attribution license.
You are free to:
Share — copy and redistribute the material in any medium or format
Adapt — remix, transform, and build upon the material for any purpose, even commercially.
The licensor cannot revoke these freedoms as long as you follow the license terms.
The Earth Sciences Research Journal is the copyright holder for these license attributes.