Published
Emission and fixation of greenhouse gases in potential specialty coffee production zones in Antioquia -Colombia
Emisión y fijación de gases efecto invernadero en zonas con potencial de producción de cafés especiales en Antioquia-Colombia
DOI:
https://doi.org/10.15446/rfna.v70n3.62639Keywords:
Specialty coffee, Biomass, Greenhouse gases, Global warming, Methane (en)Cafés especiales, Biomasa, Gases de efecto invernadero, Calentamiento global, Metano (es)
The aim of this first part of the study was to estimate the greenhouse gas (GHG) emission and fixation balance in specialty coffee production in the Department of Antioquia, Colombia. The results show that an average of 1,068 kg CO2 per kg of coffee cherry produced is fixed. The fixation and emission balance was positive of 0.271 kg CO2e / kg coffee cherry. Total GHG emission was 0,816 kg CO2e per kg coffee cherry. Emissions due to loss of carbon from soil organic matter, organic matter incorporation and coffee leaf litter decomposition, were 84.3% of total emissions and the remaining 15.7% was due to emissions from nitrogen fertilization.
El objetivo de este trabajo fue estimar el balance de emisión y fijación de gases efecto invernadero (GEI) en núcleos potenciales de producción de cafés especiales en el Departamento de Antioquia Colombia. Se utilizó la metodología recomendada por el Grupo Intergubernamental de Expertos sobre el Cambio Climático -IPCC en esta investigación. Los resultados muestran que se fijan en promedio 1.068 kg de CO2e por kg café cereza producido. Se obtuvo un balance de fijación y emisión positivo de 0,271 kg de CO2e por kg de café cereza. Las emisiones totales de GEI fueron de 0,816 kg de CO2 por kg de café cereza. Las emisiones por pérdida de carbono de la materia orgánica del suelo en promedio en todos los núcleos evaluados, incorporación de materia orgánica y la descomposición de la hojarasca de café, fueron del 84,3% de las emisiones totales y el 15,7% restante correspondió a las emisiones por fertilización nitrogenada. En el balance de emisión y fijación de los núcleos evaluados, el de Giraldo fue el que mejor resultado obtuvo con 0,5751 kg de CO2e por kg de café cereza.
Recibido: 14 de febrero de 2017; Aceptado: 27 de junio de 2017
ABSTRACT
The aim of this work was to estimate the greenhouse gas (GHG) emission and fixation balance in potential specialty coffee production zones in the department of Antioquia, Colombia. It were used the Intergovernmental Panel on Climate Change - IPCC methods in this research. The results showed an average of 1.068 kg CO2 fixed per kg of produced coffee cherry. The fixation and emission balance was positive for 0.271 kg CO2e per kg of coffee cherry. The total GHG emission was 0.816 kg CO2e per kg of coffee cherry. The emissions from loss of carbon from soil organic matter, organic matter incorporation and coffee leaf litter decomposition were 84.3% of total emissions, and the remaining 15.7% resulted from emissions from nitrogen fertilization. In the balance between emission and fixation in the evaluated zones, Giraldo´s center had the best at 0.5751 kilograms CO2e per kg of coffee cherry.
Keywords:
Specialty coffee Biomass, Greenhouse gases, Global warming, Methane..RESUMEN
El objetivo de este trabajo fue estimar el balance de emisión y fijación de gases efecto invernadero (GEI) en núcleos potenciales de producción de cafés especiales en el Departamento de Antioquia - Colombia. Se utilizó la metodología recomendada por el Grupo Intergubernamental de Expertos sobre el Cambio Climático -IPCC en esta investigación. Los resultados muestran que se fijan en promedio 1.068 kg de CO2e por kg café cereza producido. Se obtuvo un balance de fijación y emisión positivo de 0,271 kg de CO2e por kg de café cereza. Las emisiones totales de GEI fueron de 0,816 kg de CO2e por kg de café cereza. Las emisiones por pérdida de carbono de la materia orgánica del suelo en promedio en todos los núcleos evaluados, incorporación de materia orgánica y la descomposición de la hojarasca de café, fueron del 84,3% de las emisiones totales y el 15,7% restante correspondió a las emisiones por fertilización nitrogenada. En el balance de emisión y fijación de los núcleos evaluados, el de Giraldo fue el que mejor resultado obtuvo con 0,5751 kg de CO2e por kg de café cereza.
Palabras clave:
Cafés especiales, Biomasa, Gases de efecto invernadero, Calentamiento global, Metano.Agriculture contributes heavily to greenhouse gases (GHG), mainly nitrous oxide, which results from the application of nitrogen-based fertilizers and manures (Rees et al., 2014). Likewise, Andrade et al. (2014) stated that agriculture is one of the most important sectors influencing climate change because it can act as net source of GHG; however, it can mitigate global warming.
Consequently, Colombia has developed some plans and policies that address climate change mitigation, identifying priority sectors with high GHG emission rates. A working group led by the Ministry of Environment and Sustainable Development has selected target areas for low emission development in agriculture, forestry, and land use sectors (AFOLU). These include reducing emissions from deforestation and forest degradation, oil palm, livestock, forestry, and fertilizers. In December 2015, the government of Colombia presented its Intended Nationally Determined Contributions, which include contributions from the AFOLU sector, at the Conference of the Parties in Paris (De Pinto et al., 2016).
Since coffee production plays an important role worldwide in sustaining millions of livelihoods around the world, it is critical to understand GHG emissions from coffee supply chains in order to evaluate options for climate change mitigation within the sector (Noponen et al., 2012), especially in Colombia, which is one of the largest coffee producers in the world.
The specialty coffee industry was born in North America, as a result of the decline in coffee quality offered by commercial roasters. It focuses on high quality and originality perception, defined by some industry agents as “good preparation of a single origin and distinct taste” (Ponte, 2004). They are coffees that come from a country, region or farm, with a number of unique qualities because they grow in special places, and are sold to the final consumers without being mixed with coffees of other qualities or origins (Organización Internacional del Café, 2014). They are valued by consumers for their consistent, verifiable and sustainable attributes, for which a higher price is paid to the producer. As an alternative and great possibility, Colombia has sought to join the green markets, and the way into these international markets is encouraging greater sustainable production.
Colombia is the world's second-largest supplier of Fair Trade USA Certified coffee, the third-largest 4C coffee producer, the second-largest Rainforest coffee producer and the third-largest UTZ coffee producer. By 2013, over 184 thousand producers were reported, with verification and/or certifications of some type of sustainability protocol and, therefore, receive quality premiums, which increased by 7%. By 2014, according to the FNC figures of the Colombian coffee industry, production increased to 12.1 million bags, of which more than half of this export was value-added, corresponding to 3.2 and 2.5 million bags with added value and specialty coffees, respectively (Federación Nacional de Cafeteros de Colombia-FNC, 2014).
By 2014, different brands had incorporated new elements related to climate change into their checklists, based on measurements of (GHG), which obligates producer countries to have their GHG inventories, in order to make them more competitive and position them in the international market, giving added value to internal and external production, as is the case in Colombia.
Based on the above, this research aimed to estimate the balance between emission and fixation of GHG in the production process of coffee cherry (BefGHGcc). It was determined in carbon dioxide equivalent (CO2e) per kg of coffee cherry produced on the different coffee farms, grouped by zones with potential for the production of specialty coffee in Antioquia - Colombia, one of the largest coffee producing departments in the country.
MATERIALS AND METHODS
This research was carried out based on the guidelines of the Intergovernmental Panel on Climate Change - IPCC (Eggleston et al., 2006) at a TIER 1 level, with a sample consisting of 30 representative coffee farms in different regions of the department of Antioquia-Colombia, which were grouped into four zones with specialty coffee production potential: Ciudad Bolívar, Giraldo, Urrao and El Retiro-La Ceja. In spite of the fact that the TIER 1 methodology was used according to IPCC, in order to reduce uncertainties, primary information was used in this research, such as organic matter, biomass volume, volume of the tree section, coffee cherry production, and annual amount of N applied to soils, among others.
Taking into account the fact that our systems of coffee production vary from farm to farm and type of shading, we aimed to quantify only the biomass fixation of coffee in relation to production, without taking into account the contribution of biomass generated by the different Agroforestry arrangements.
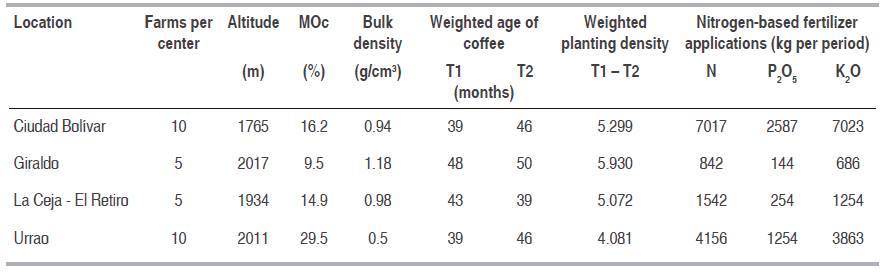
Some characteristics related to the crops of the farms within each center with specialty coffee production potential, such as agroecological zones, % of organic matter (MOc), and soil bulk, observed during the study period are shown in Table 1.
Table 1: Average characteristics of of the farms within each center.
The estimation of GHG emission and fixation in the production of coffee in those locations with a potential for production of specialty coffee, was carried out until production of coffee cherry, since this is the more standardized step in the production process, and the post-harvest processing of specialty coffee tends to meet each customer's own guidelines to better support cup quality.
Estimating the emission of CO 2 e in the processes of coffee cherry production
An interview and some questionnaires were conducted on each farm to determine the volume of application of synthetic nitrogen fertilizers, amendments, organic matter as well as coffee cherry production, concerning the harvest period. CO2e is equal to the production of N2O in Global warming potential because of the greenhouse effect, N2O with respect to CO2 (GWP). The N2ODirect - N was estimated from the sum of two main contributions, nitrogen fertilization and joint contribution of N mineralization, related to the loss of C from soil organic matter, incorporation of organic matter and contribution of N from agricultural residues (coffee leaf litter) (Klein et al., 2006):
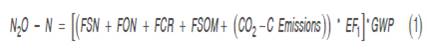
Where:
N2ODirect -N = annual direct emissions of N2O-N produced from managed soils, kg N2O-N year-1 N2O-Ncontribution N = annual direct emissions of N2O-N produced by N inputs to managed soils, Kg N2O-N year-1 N2O-NOS = annual direct emissions of N2O-N from managed organic soils, kg N2O-N year-1 N2O-NPRP = annual direct releases of N2O-N from urine and manure inputs to grazing lands, kg N2O-N year-1
In Equation 1, the terms N2O-NOS + N2O-NNprp do not only take into account direct contributions (N2O-NN Contribution); therefore, Equation 2 and 3 were used after some mathematics arrangements to adjust to the coffee crop dynamics.

Where:
N2O-N = annual direct emissions of N2O-N produced from managed soils, kg N2O-N/period. FSN = annual amount of N applied to soils in the form of synthetic fertilizer, kg N yearˉ¹/period. FON = annual amount of animal manure, compost, sewage sludge and other N inputs applied to soils by period. FCR = annual amount of N in agricultural waste (aerial and underground), kg N/period. FSOM = annual amount of N in mineral soils being mineralized, related to C loss from soil organic matter as a result of changes in land use or management, kg N/period. CO2 -C Emission = annual emissions of C by application of limes, kg C period. EF1 = emission factor for N2O emissions from N inputs, kg (N2O-N)ˉ¹ (kg N contribution)/period.
In this research, no emissions were found from the application of limes because there were no applications of calcium limestone (CaCO3) or dolomite (CaMg(CO3)2), which lead to CO2 emissions since they are dissolved and release bicarbonate (2HCO3 -), which is converted to CO2 and water (H2O). The few applications made by the producers were from soluble sources of CaO, which do not contain inorganic carbon; therefore, they are not included in the calculations for the estimation of the CO2 emissions from applications to the soil, as recommended by Klein et al. (2006).
Estimation of N 2 O and CO 2 e emission by application of synthetic nitrogen fertilizers to the soils, (FSN)
The nitrogen volume applied in the period (kg of N) was determined from equation 2 FSN, where total nitrogen fertilization contribution was established as follows:

Where:
FSN= Kg CO2e (per contribution of N)ˉ¹ EF1= 0.01 MN2O/MN2= 44/28 is the mass ratio of N2O to N2 molecules GWP N2O = 298. (Eggleston et al., 2006)
Estimation of N 2 O and CO 2 e emission related to C loss from organic matter of the soil, incorporation of organic matter and decomposition of litter. (FSOM, together with FON and FCR)
The FSOM was estimated from the soil calcination method of loss on ignition, (Zhang and Wang, 2014), which also quantified the FON and FCR in an indirect way. Two soil samples were taken at a depth of 20 cm per farm, 60 in total, at two different times, T1 and T2, in which the calcined organic matter (% MOc) was measured to obtain a single % MOc corresponding to the harvest period. A soil sample was also taken to determine the bulk (dry) density by means of the cylinder method.
For the estimation of C, the soil weight was established as a function of the bulk (dry) density at a depth of 20 cm and the average % MOc. The % C of the soils was calculated based on the IPCC guidelines (Eggleston et al., 2006), which corresponded to 35% organic matter (MO). A C mineralization rate of 1.39 % was estimated as reported by (Cardona and Sadeghian, 2005), for open-air coffees; in addition, a 44/12 kg C to kg CO2e conversion factor was used.
Estimation of CO 2 e fixation by biomass accumulation
To quantify the CO2e fixation rate through the accumulation of biomass for the harvest period (T1 to T2), where T1 was August 2014 and T2 was February 2015, the estimation was based on the age and planting density of the different lots of each farm because the coffee farms usually have several lots of different ages, varieties and agronomic management, which directly influences the biomass storage; for this reason, the change of existence of Carbon (ΔCB) as a function of age and weighted density of the farms was quantified. The measurements were developed at 20 sites randomly in the lot most relevant to the age and weighted density of each farm, for a total of 600 measurements per farm.
To quantify the aerial biomass of coffee at each site, the useful volume of the section was estimated according to Farfan and Rendon (2014) with Equation (4) and multiplied by the density of the coffee wood (0.91 g cm-3), and then multiplied by the total number of farm trees, which allowed us to estimate the total aerial biomass of the coffee plantation at a given time.

Where:
Vs = Volume of the tree´s section h = Height of section R = Largest radius r = Smallest radius
To estimate the aerial biomass in T2, lower diameters were measured at the base of the stem of each axis (R). The upper diameter (r) was measured in the transition zone from woody to green stem. The height (h) included the section of the woody stem, from the base to the transition zone between the lignified stem and green stem.
The aerial biomass in T1 was projected from the same site or tree in which the biomass of T2 was evaluated. The height was determined by subtracting the T2 height from the total height of tree growth, taking into account the rate of emission of one internode per month, according to recommendations of Ramirez (2014). Therefore, the height difference between the first (upper) internode and the seventh (lower) internode was measured. The lower diameter (R) measurement was taken at a height above the base corresponding to the growth height. The upper diameter (r) was the same as that measured in T2.
The CO2e fixation was estimated with the ΔCB equation of the existence difference method (Aalde et al., 2006), where the rate of accumulation or growth of the biomass included the sum of the aerial and underground biomass (root) for such period. A coffee biomass/aerial biomass ratio of 27% was estimated (Eggleston et al., 2006).
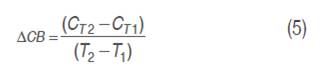

Where:
ΔCB = annual change in carbon existences of biomass (the sum of aerial and underground biomass) on land remaining in the same category (kg C period). CT1 = total carbon in biomass for each subcategory of land remaining in the same category at time T1 (kg C). CT2 = total carbon in biomass for each subcategory of land remaining in the same category at time T2 (kg C). C = total biomass carbon for the period T1 to T2. A = land area that remains in the same land use category (ha). V = volume of growing venal existence corresponding to the woody volume of the tree and excludes the branches, shoots, foliage and underground components, such as roots), (cm3 ha-1). i = ecological zone i (i = 1 a n) j = climatic domain j (j = 1 a n) ˉ¹ R = relationship between the aerial biomass and underground biomass, kg d.m. of underground biomass (kg d.m. of aerial biomass). Where R = 0.27 CF = dry matter carbon fraction, kg C (kg d.m.)ˉ¹. Being CF = 0.5 kg C/kg of dm. (Lasco et al., 2006). BCEFS = biomass conversion and expansion factor, for expansion of growing venal existence volume to aerial biomass, tons of aerial biomass growth (cm3 of growing existences volume)-1.
The quantification of CO2 accumulated in each fraction of biomass has been calculated through the relationship between the total weight of a CO2 molecule and the weight of the carbon atom.
In order to estimate the CO2e fixation per kg of coffee cherry through the annual change equation in carbon existence of biomass, the area of land (A) was modified by the total trees of the farm and the biomass conversion and expansion factor (BCEFS) was replaced by the projection of biomass accumulation from T2 to T1.
Balance of emission and fixation of GHG
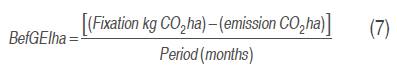
The greenhouse gas emission and fixation balance (BefGEIcc), in kg of CO2e per kg of produced coffee cherry (kg cc), was quantified using Equation 8 according to the guidelines of IPCC (Eggleston et al., 2006).

Experiment setup
Four experiment units were established in the locations of Ciudad Bolivar, Giraldo, Retiro-La Ceja and Urrao. Two different parameters were measured for each experiment unit: fixation and emissions.
GHG emission estimates (N2O-N, FSOM and CO2-C) were carried out in the four locations on 30 different farms with potential special coffees production. The measurements were taken at two different times: one in the initial period (T1) and another one in the final period (T2).
The GHG fixation estimation was carried out in the same four locations and 30 farms. On each farm, 20 sub-samples were chosen in the most representative lots in relation to the density and age of the crop in order to determinate the annual change in the carbon existence of biomass (ΔCB). The biomass of the coffee was measured the initial period (T1) and the final period (T2).
The different elements that comprised the response variable for both the emission and fixation were analyzed for differences between the locations through an analysis of variance (ANOVA).
RESULTS AND DISCUSSION
Average estimate per center of GHG emission in kg of CO 2 e per kg of coffee cherry
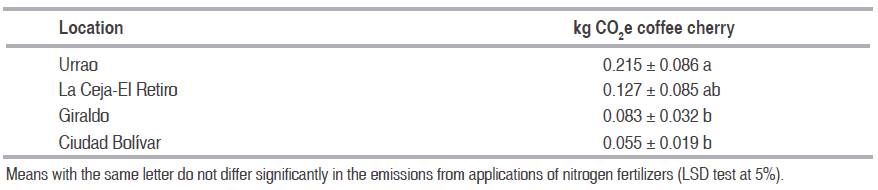
The Anova of average GHG emission by application of synthetic nitrogen fertilizers (kg of CO2e per kg of coffee cherry) (FSN) showed significant differences (P<0.0001) in the mean GHG emissions from nitrogen fertilizer applications in kg CO2e per kg of coffee cherry between the locations. Table 2 shows the comparison between the locations using the LSD test at a 0.05 significance level. Urrao emitted the most with 0.215 kg of CO2e per kg of coffee cherry, followed by La Ceja-El Retiro and Giraldo. Ciudad Bolívar and Giraldo emitted less GHG with 0.055 kg and 0.083 kg of CO2e per kg of coffee cherry, respectively. This was especially influenced by the fact that these locations presented the highest average cherry production in kg per tree, with 1.6 and 1.2, respectively.
Table 2: Average GHG emission per location with potential specialty coffee production from synthetic nitrogen fertilizer applications in kg CO2e per kg of coffee cherry.
The average emission by application of nitrogen fertilizers was 0.125 kg of CO2e per kg of coffee cherry, which accounts for 15.7% of total emissions, as reported by Noponen et al. (2012), in their studies on the quantification of the carbon footprint in conventional coffee in Costa Rica, which was 0.26 to 0.67 kg of CO2e per kg of coffee cherry, representing 50% of all emissions. Segura and Andrade (2012) reported an emission participation of nitrogen fertilizer applications ranging from 0.033 to 0.117 kg of CO2e per kg of coffee cherry, for a participation of 68 to 82% of the emissions. These percentages of participation in the emissions differ from the 15.7% quantified in this paper. This is probably due to the fact that these authors did not take into account the losses of C from soil MO and the decomposition of leaf litter.
The Anova of the average GHG emissions by loss of C from MOs, decomposition of leaf litter and input of MO in kg of CO2e per kg of produced coffee cherry showed significant differences (P = 0.003) in the mean emission by loss of C from MOs, decomposition of leaf litter and input of organic matter in kg of CO2e per kg of coffee cherry between the locations. Table 3 shows the corresponding average values per location.
Table 3: Average GHG emissions by loss of C from MOs, decomposition of leaf litter and input of MO in kg of CO2e per kg of produced coffee cherry per location.

An emission range from 0.38 to 1.180 was found, with an average emission of 0.674 kg of CO2e per kg of coffee cherry. Urrao presented statistical differences from all the other locations, duplicating the average emission of CO2e by loss of C at 1.108 Kg CO2e per kg of coffee cherry, in comparison with the other locations. This could be mainly because this location had the highest average content of % Moc, with 29.5%, as compared to 17.1% in Ciudad Bolívar, 15% in La Ceja-El Retiro, and 9.5% in Giraldo. Similarly, Urrao presented the lowest averages in the average production of coffee cherry per tree and planting density, with 0.82 kg of coffee cherry and 4.081 trees ha-1, respectively.
Segura and Andrade (2012), reported 6.95 kg CO2e per kg of coffee cherry, along with Montilla et al. (2008), who reported 6.23 kg CO2e per kg of coffee cherry, mainly because of the organic matter inputs. These results are far from the data obtained here since this measurement was taken more directly through the soil calcination method, which is closer to that published by Hergoualc'h et al. (2012).
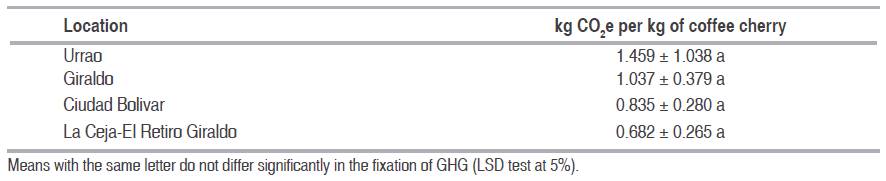
The Anova of average fixation of GHG by accumulation of biomass in kg of CO2e per kg of coffee cherry per center (∆GB) did not show significant differences (P=0.117) in the mean fixation produced during the period between the locations. Table 4 presents the corresponding averages per location. However, Urrao and Giraldo fixed the most. The fixation oscillated between 0.682 and 1.459 for an average of 1.068 kg of CO2e per kg of coffee cherry, which is the same as fixing an average of 8.941 kg of CO2e ha-1 year)-1, which is lower than that reported by Segura and Andrade (2012) of 13.1 kg of CO2e per kg of green coffee, representing an approximate equivalence of 2.6 kg of CO2e per kg of coffee cherry, but higher than that reported by Hergoualc'h et al. (2012, 2008).
Table 4: Average GHG fixation per location with potential specialty coffee production in kg CO2e per kg of produced coffee cherry.
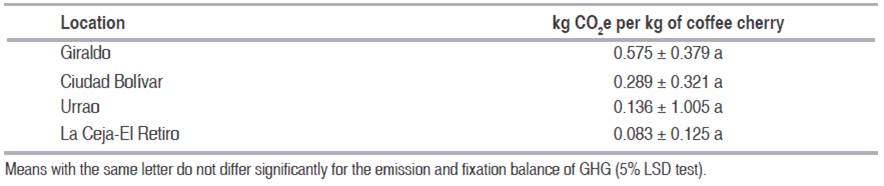
Average GHG emission and fixation balance per center with potential for specialty coffee production (BefGEIcc)
The Anova did not show significant differences (P=0.584) in the mean emission and fixation balances between the locations. Table 5 shows the balance between average fixation and emission of GHG per locations, in kg of CO2e per kg of coffee cherry. Generally, the production of coffee cherry in areas with a potential for specialty coffee production has a positive balance, fixing between 0.083 and 0.575 kg CO2e per kg of coffee cherry, for an average of 0.27 kg CO2e per kg of coffee cherry. Noponen et al. (2012) estimated the balance as a function of the changes in soil C stock, obtaining BefGEIcc values between 0.26 and 0.67 kg CO2e per kg of coffee cherry, results that are comparable with those found in this research.
Table 5: Emission and fixation balance of GHG per kilogram of coffee cherry.
Hergoualc'h et al. (2012), estimated the emission balance and fixation of GHG in mono-culture of coffee in Costa Rica in 3.83 Mg ha of CO2e year, also incorporating the traditional emission sources (applications of N fertilizers, limes and organic matter), finding emissions from changes in soil C of 0.27 kg CO2e per kg of coffee cherry, which are in line with those found in this research when doing conversions (3.2 Mg ha CO2e per year).
These results indicate that the coffee cherry production process in these locations with the applicable agronomic processes are being carried out in a sustainable and environmentally responsible way in terms of the GHG storage.
CONCLUSIONS
This research revealed that the balance of emission and fixation of GHG per locations with a potential for specialty coffee production was positive, which shows the environmental sustainability of the agronomic activities. This is worth highlighting for future uses of these productive systems in markets seeking green certifications/Green Seal certification.
It was estimated a positive fixation of 0.27 kg of CO2 equivalent per kg of coffee cherry. The statistical analysis did not show significant differences in the emission balance and GHG fixation in coffee cherry production between the locations with a potential for specialty coffee production in the Antioquia Department.
REFERENCES
References
Aalde H, Gonzalez P, Gytarsky M, Krug T, Kurz WA, Ogle S and Ravindranath NH. 2006. Capitulo 4: Tierras forestales. pp. 1-93. En: Directrices del IPCC de 2006 para los inventarios nacionales de gases de efecto invernadero. Editorial IGES, Japón. 425 p.
Andrade HJ, Segura MA, Canal DS, Feria M, Alvarado JJ, Marín LM, Pachón D and Gómez MJ. 2014. Chapter 3. The carbon footprint of coffee production chains in Tolima, Colombia. pp. 53-66. En: Oelbermann M (ed.). Sustainable agroecosystems in climate change mitigation. Editorial Wageningen Academic Publishers, Netherlands. 272 p. doi: 10.3920/978-90-8686-788-2_3.
Cardona C and Sadeghian S. 2005. Ciclo de nutrimentos y actividad microbiana en cafetales a libre exposición solar con sombrio de Inga spp. Cenicafé 56(2): 127–141.
De Pinto A, Li M, Haruna A, Hyman G, Martinez MAL, Creamer B and Martinez JD. 2016. Low emission development strategies in agriculture. An Agriculture, Forestry, and Other Land Uses (AFOLU) Perspective. World Development 87(1): 180–203. doi: 10.1016/j.worlddev.2016.06.013
Farfan VF and Rendon SJ. 2014. Producción de madera por la variedad Castillo y Tabi en sistemas agroforestales. En: Avances técnicos Cenicafé, http://biblioteca.cenicafe.org/bitstream/10778/563/1/avt0448.pdf. 4 p; Consulta: marzo 2015.
Federación Nacional de Cafeteros de Colombia FNC. 2014. Comportamiento de la industria cafetera colombiana. En: Federación Nacional de Cafeteros de Colombia, https://www.federaciondecafeteros. org/static/files/Informe_Industrial_2014_Web.pdf. 62 p; consulta: noviembre 2015.
Hergoualc’h K, Blanchart E, Skiba U, Hénault C and Harmand JM. 2012. Changes in carbon stock and greenhouse gas balance in a coffee (Coffea arabica) monoculture versus an agroforestry system with Inga densiflora, in Costa Rica. Agriculture. Ecosystems and Environment 148(1): 102–110. doi: 10.1016/j.agee.2011.11.018
Hergoualc’h K, Skiba U, Harmand JM and Hénault C. 2008. Fluxes of greenhouse gases from Andosols under coffee in monoculture or shaded by Inga densiflora in Costa Rica. Biogeochemistry 89(3): 329–345. doi: 10.1007/s10533-008-9222-7
Eggleston HS, Buendia L, Miwa K, Ngara T and Tanabe K. 2006. IPCC Guidelines for national greenhouse gas inventories, prepared by the National Greenhouse Gas Inventories Programme. IGES, Japón. 425 p.
Klein CD, Novoa RSA, Ogle S, Smith KA, Rochette P, Wirth TC and Rypdal K. 2006. Capitulo 11: Emisiones de N2O de los suelos gestionados y emisiones de CO2 derivadas de la aplicación de cal y urea. pp. 1-56. En: Directrices del IPCC de 2006 para los inventarios nacionales de gases de efecto invernadero. Editorial IGES, Japón. 425 p.
Lasco RD, Ogle S, Raison J, Verchot L, Wassmann R, Yagi K and Smith P. 2006. Capitulo 5: Tierras de cultivo. pp. 1–74. En: Directrices del IPCC de 2006 para los inventarios nacionales de gases de efecto invernadero. Editorial IGES, Japón. 425 p.
Noponen MRA, Jones G, Haggar JP, Soto G, Attarzadeh N and Healey JR. 2012. Greenhouse gas emissions in coffee grown with differing input levels under conventional and organic management. Agriculture. Ecosystems and Environment 151(1): 6–15. doi: 10.1016/j.agee.2012.01.019
Organización Internacional del Café. 2014. Comercio mundial del café (1963—2013): Reseña de los mercados, retos y oportunidades con que se enfrenta el sector. En: ICC 111-5 Rev. 1, http://juntadelcafe.org.pe/documentos/comercio-mundial-del-cafe-1963-2013-resena-de-los-mercados-retos-y-oportunidades-conque. 29 p; consulta: mayo 2015.
Ponte S. 2004. Estándares y sostenibilidad en el sector cafetero: una aproximación global a la cadena de valor. Revista Federación Nacional de Cafeteros 20(1): 1–79.
Ramirez BV. 2014. La fenología del café una herramienta para apoyar la toma de desiciones. Avance Técnico Cenicafé, http://biblioteca.cenicafe.org/handle/10778/489. CENICAFE. 8 p; consulta: noviembre 2015.
Rees RM, Flack S, Maxwell K and Mistry A. 2014. Chapter 23: Air: Greenhouse gases from agriculture. pp. 293-304. En Encyclopedia of Agriculture and Food Systems. Oxford: Academic Press. doi: 10.1016/B978-0-444-52512-3.00088-7
Montilla PJ, Arcila PJ, Aristizabal LM, Montoya REC, Puerta QGI and Cadena GG. 2008. Propiedades físicas y factores de conversión del café en el proceso de beneficio. Cenicafé 59(2): 120–142.
Segura MA and Andrade HJ. 2012. Huella de carbono en cadenas productivas de cafe (Coffea arabica L.) con diferentes estandares de certificacion en Costa Rica. Luna Azul 35(1): 60-67.
Zhang H and Wang JJ. 2014. Loss on Ignition Method. In: Agricultural Service Laboratory (ed.). Soil test methods from the Southeastern United States. En: Book. Retrieved from Methods Manual SERA, http://saaesd.ncsu.edu/docs/MethodsManualFinalSERA6.pdf. 157 p; consulta: febrero 2015.
How to Cite
APA
ACM
ACS
ABNT
Chicago
Harvard
IEEE
MLA
Turabian
Vancouver
Download Citation
CrossRef Cited-by
1. Diego Ivan Caviedes Rubio, Daniel Ricardo Delgado, Alfredo Olaya Amaya. (2023). Environmental impacts of certification programmes at Colombian coffee plantations. Economía Agraria y Recursos Naturales, 23(2), p.29. https://doi.org/10.7201/earn.2023.02.02.
2. Amanda Silva‐Parra, Juan Manuel Trujillo‐González, Eric C. Brevik. (2021). Greenhouse gas balance and mitigation potential of agricultural systems in Colombia: A systematic analysis. Greenhouse Gases: Science and Technology, 11(3), p.554. https://doi.org/10.1002/ghg.2066.
3. C. Chéron-Bessou, I. Acosta-Alba, J. Boissy, S. Payen, C. Rigal, A.A.R. Setiawan, M. Sevenster, T. Tran, A. Azapagic. (2024). Unravelling life cycle impacts of coffee: Why do results differ so much among studies?. Sustainable Production and Consumption, 47, p.251. https://doi.org/10.1016/j.spc.2024.04.005.
4. B Hafif, K D Sasmita. (2020). The organic carbon dynamics of peat soil under liberica coffee cultivation. IOP Conference Series: Earth and Environmental Science, 418(1), p.012021. https://doi.org/10.1088/1755-1315/418/1/012021.
Dimensions
PlumX
Article abstract page views
Downloads
License
Copyright (c) 2017 Revista Facultad Nacional de Agronomía Medellín

This work is licensed under a Creative Commons Attribution-NonCommercial 4.0 International License.
The journal allows the author(s) to maintain the exploitation rights (copyright) of their articles without restrictions. The author(s) accept the distribution of their articles on the web and in paper support (25 copies per issue) under open access at local, regional, and international levels. The full paper will be included and disseminated through the Portal of Journals and Institutional Repository of the Universidad Nacional de Colombia, and in all the specialized databases that the journal considers pertinent for its indexation, to provide visibility and positioning to the article. All articles must comply with Colombian and international legislation, related to copyright.
Author Commitments
The author(s) undertake to assign the rights of printing and reprinting of the material published to the journal Revista Facultad Nacional de Agronomía Medellín. Any quotation of the articles published in the journal should be made given the respective credits to the journal and its content. In case content duplication of the journal or its partial or total publication in another language, there must be written permission of the Director.
Content Responsibility
The Faculty of Agricultural Sciences and the journal are not necessarily responsible or in solidarity with the concepts issued in the published articles, whose responsibility will be entirely the author or the authors.