Published
Conversion of 3D seismic attributes to reservoir hydraulic flow units using a neural network approach: An example from the Kangan and Dalan carbonate reservoirs, the world's largest non-associated gas reservoirs, near the Persian Gulf
Keywords:
seismic attributes, seismic inversion, flow zone indicator, reservoir quality index, hydraulic flow unit, probabilistic neural networks. (en)This study presents an intelligent model based on probabilistic neural networks (PNN) to produce a quantitative formulation between seismic attributes and hydraulic flow units (HFUs). Neural networks have been used for the last several years to estimate reservoir properties. However, their application for hydraulic flow unit estimation on a cube of seismic data is an interesting topic for research. The methodology for this application is illustrated using 3D seismic attributes and petrophysical and core data from 6 wells from the Kangan and Dalan gas reservoirs in the Persian Gulf basin. The methodology introduced in this study estimates HFUs from a large volume of 3D seismic data. This may increase exploration success rates and reduce costs through the application of more reliable output results in hydrocarbon exploration programs. 4 seismic attributes, including acoustic impedance, dominant fre- quency, amplitude weighted phase and instantaneous phase, are considered as the optimal inputs for pre- dicting HFUs from seismic data. The proposed technique is successfully tested in a carbonate sequence of Permian-Triassic rocks from the studied area. The results of this study demonstrate that there is a good agreement between the core and PNN-derived flow units. The PNN used in this study is successful in modeling flow units from 3D seismic data for which no core data or well log data are available.
Resumen
Este estudio presenta un modelo inteligente basado en redes neuronales probabilísticas (PNN) para pro- ducir una formulación cuantitativa entre atributos sísmicos y unidades de flujo hidráulico (HFU). Las redes neuronales han sido utilizadas durante los últimos años para estimar las propiedades de reserva. Sin embargo, su aplicación para estimación de unidades de flujo hidráulico en un cubo de datos sísmicos es un tema importante de investigación. La metodología para esta aplicación está ilustrada a partir de datos tridimensionales y datos petrofísicos y de núcleo tomados en 6 pozos de las reservas de Kangan y Dalan, de la cuenca del Golfo Pérsico. La metodología introducida en este estudio estima las HFU de un gran volúmen de datos sísmicos tridimensionales. Esto podría incrementar los índices positivos de explora- ción y reducir los costos a través de una aplicación más confiable en resultados de producción para los programas de exploración en hidrocarbonos. Cuatro atributos sísmicos, obstrucción acústica, frecuencia dominante, fase de amplitud media y fase instantánea, son considerados en este trabajo como aportes claves para predecir los datos sísmicos de las HFU. La técnica propuesta ha sido evaluada exitosamente en una secuencia carbonada de rocas del Pérmicotriásico tomadas del área de estudio. Los resultados de este trabajo demuestran que hay concordancia entre la base de las PNN y las unidades derivadas de flujo. Las PNN utilizadas en este estudio son capaces de modelar unidades de flujo de datos sísmicos tridimen- sionales para los cuales no hay un centro de datos o una secuencia de datos disponible.
SEISMIC PROSPECTION
Conversion of 3D seismic attributes to reservoir hydraulic flow units using a neural network approach: An example from the Kangan and Dalan carbonate reservoirs, the world's largest non-associated gas reservoirs, near the Persian Gulf
Mohammad Amin Dezfoolian1, Mohammad Ali Riahi2 and Ali Kadkhodaie-Ilkhchi3
1 Young Researchers and Elite Club, Science and Research Branch, Islamic Azad University, Tehran, Iran. dezfoolian@rocketmail.com. Corresponding author.
2 Institute of Geophysics, University of Tehran, Tehran, I. R. Iran. mariahi@ut.ac.ir
3 Geology Department, Faculty of Natural Science, University of Tabriz, Iran. kadkhodaie_ali@tabrizu.ac.ir
Manuscript received: 17/10/2012
Accepted for publication: 02/12/2013
ABSTRACT
This study presents an intelligent model based on probabilistic neural networks (PNN) to produce a quantitative formulation between seismic attributes and hydraulic flow units (HFUs). Neural networks have been used for the last several years to estimate reservoir properties. However, their application for hydraulic flow unit estimation on a cube of seismic data is an interesting topic for research. The methodology for this application is illustrated using 3D seismic attributes and petrophysical and core data from 6 wells from the Kangan and Dalan gas reservoirs in the Persian Gulf basin. The methodology introduced in this study estimates HFUs from a large volume of 3D seismic data. This may increase exploration success rates and reduce costs through the application of more reliable output results in hydrocarbon exploration programs. 4 seismic attributes, including acoustic impedance, dominant frequency, amplitude weighted phase and instantaneous phase, are considered as the optimal inputs for predicting HFUs from seismic data. The proposed technique is successfully tested in a carbonate sequence of Permian-Triassic rocks from the studied area. The results of this study demonstrate that there is a good agreement between the core and PNN-derived flow units. The PNN used in this study is successful in modeling flow units from 3D seismic data for which no core data or well log data are available.
Key words: seismic attributes, seismic inversion, flow zone indicator, reservoir quality index, hydraulic flow unit, probabilistic neural networks.
RESUMEN
Este estudio presenta un modelo inteligente basado en redes neuronales probabilísticas (PNN) para producir una formulación cuantitativa entre atributos sísmicos y unidades de flujo hidráulico (HFU). Las redes neuronales han sido utilizadas durante los últimos años para estimar las propiedades de reserva. Sin embargo, su aplicación para estimación de unidades de flujo hidráulico en un cubo de datos sísmicos es un tema importante de investigación. La metodología para esta aplicación está ilustrada a partir de datos tridimensionales y datos petrofísicos y de núcleo tomados en 6 pozos de las reservas de Kangan y Dalan, de la cuenca del Golfo Pérsico. La metodología introducida en este estudio estima las HFU de un gran volúmen de datos sísmicos tridimensionales. Esto podría incrementar los índices positivos de exploración y reducir los costos a través de una aplicación más confiable en resultados de producción para los programas de exploración en hidrocarbonos. Cuatro atributos sísmicos, obstrucción acústica, frecuencia dominante, fase de amplitud media y fase instantánea, son considerados en este trabajo como aportes claves para predecir los datos sísmicos de las HFU. La técnica propuesta ha sido evaluada exitosamente en una secuencia carbonada de rocas del Pérmicotriásico tomadas del área de estudio. Los resultados de este trabajo demuestran que hay concordancia entre la base de las PNN y las unidades derivadas de flujo. Las PNN utilizadas en este estudio son capaces de modelar unidades de flujo de datos sísmicos tridimensionales para los cuales no hay un centro de datos o una secuencia de datos disponible.
Palabras clave: atributos sísmicos, inversión sísmica, indicador de zona de flujo, índice de calidad de depósito, unidad de flujo hidráulico, redes neuronales probabilísticas.
Introduction
Among the various geophysical techniques available for reservoir characterization, 3D seismic attributes have proven to be among the most useful. One of the greatest strengths of 3D seismic attributes is the dense and regular sampling of data over the region of interest, providing images that accurately represent the areal extent of the features of interest. When seismic amplitude changes associated with the features of interest are not noticeable on vertical sections, horizontal time or horizon slices often yield distinct patterns that are easily recognizable. Among the more valuable seismic attributes are those sensitive to reservoir impedance, thickness or geomorphology. Although there are a few hundred seismic attributes that are in common use today, here we discuss the application of post-stack attributes for the estimation of hydraulic flow units. Acoustic impedance, dominant frequency, amplitude weighted phase and instantaneous phase attributes are used as optimal attributes for the estimation of hydraulic flow units. We demonstrate that the value of using these attributes is useful in mapping the HFUs in the Persian Gulf Kangan and Dalan supergiant gas reservoirs.
Because well log data are sparse and seismic data contain low vertical resolution, combining both datasets is an important task for reservoir characterization. Reservoir characterization is a conceptual model of a reservoir or oil and gas field that can be constructed from sparse data, such as well data or from low vertical resolution data, such as seismic data or a combination of both datasets. The well logging is sparse in space, but seismic logging has a high resolution in the space direction compared with well logging.
Usually many seismic attributes are available and can be combined with well data for the estimation of flow units. The last decade has witnessed significant advances in the study and application of expert systems in the petroleum industry. The establishment of the existence of an intelligent formulation between two sets of data (inputs/outputs) has been the main topic of such studies. One such topic that has been of great interest is to characterize how 3D seismic data are related to lithology, rock types, fluid content, porosity, shear wave velocity and other reservoir properties. Petrophysical parameters, such as water saturation, porosity and permeability, are important data for hydrocarbon reservoir modeling. Previously, several researchers have worked on predicting these parameters from seismic data using statistical methods and intelligent systems (Nikravesh et al., 1998; Balch et al., 1999; Trappe and Hellmich, 2000; Nikravesh and Aminzadeh, 2001; Wong and Nikravesh, 2001; Meldahl et al., 2001; Russell et al., 2002; Russell et al., 2003; Nikravesh and Hassibi, 2003; Russell, 2004; Aristimun and Aldana, 2006; Chopra and Marfurt, 2006; Soubotcheva and Stewart, 2006).
The introduction of petrophysics and petroleum engineering science into the mathematics and computer science area has played a significant role in solving petroleum industry problems. The application of artificial intelligence techniques, such as artificial neural networks, fuzzy logic and genetic algorithms, in reservoir characterization has been considered to be a milestone in the last decade's improvements in the petroleum industry, which has resulted in a significant decrease in exploration expenses (Dezfoolian and Sanaee, 2012). Generally, geological, petrophysical and seismic data are not clear-cut and are associated with inherent uncertainties. Artificial neural networks have become one of the most modern and robust techniques for the analysis of geosciences data. These networks are able to recognize patterns between a set of input and output data (Rezaee et al., 2007; Kadkhodaie-Ilkhchi et al., 2006; Kadkhodaie et al., 2009).
Regional geology
In the studied field (Fig. 1), gas accumulation is mostly limited to the Permian–Triassic stratigraphic units. These units are known as the "Kangan–Dalan Formations," which constitute very extensive natural gas reservoirs in the field and Persian Gulf area. In addition, this area is composed of a carbonate–evaporate series commonly known as the Khuff Formation.

The gas-condensate bearing reservoirs of this field belong to the Kangan formation of the Triassic age and Dalan formations of the Permian age. These carbonate formations were deposited in a shallow marine environment during a general marine transgression that began in the middle of the Permian age and lasted until the early Triassic age. The basal section of the Dashtak formation, which was formed throughout the lower, middle and upper parts of the Triassic period, is composed of argillaceous siltstone, shale and dolomite, with anhydrite interbeds. The remaining middle and upper parts mainly consist of dolomite intercalation. The Dashtak formation is known to be a good seal for the Kangan-Dalan reservoirs. In Arabian nomenclature, the Kangan and Dalan reservoirs are equivalent to the Khuff Formation. Within these reservoirs, there are 4 main producing levels, which from top to bottom are K1, K2, K3 and K4, each separated by anhydritic layers. Each of these levels has been divided into several subzones. A massive anhydrite body, known as the Nar Member, separates K4 from the underlying K5 member that exhibits poor reservoir characteristics.
K1 and K2 are Kangan's producing layers. The dolomitic part of K1 is characterized to be mudstone, mudstone to packstone, beige, moderately hard to hard, crystalline to cryptocrystalline, have occasional pelloids, pebbles and shell fragments, have local mudcracks in mudstone, slightly argillaceous in parts, have thin layers of anhydrite and o have good to fair vuggy and intercrystalline porosity. Its limestone is defined as mudstone, wackstone, off white to white, cream to light brown, brownish gray, soft, amorphous, chalky, cryptocrystalline to microcrystalline, brittle to crumbly, washable, slightly argillaceous, having traces of re-crystallized calcite and having poor to not visible porosity. It also contains anhydrite, which is white, off white, soft to firm, amorphous, cryptocrystalline and washable. On the other hand, K2 consists of limestone and dolomite. The limestone can be illustrated as mudstone, wackstone, grainstone, white to off white, cream, light gray, light brown, soft to firm, microcrystalline to fine crystalline, dolomitic and anhydritic in parts, and slightly argillaceous. The dolomite section is an alternation of grainstone with oolites and cream packstone, moldic and vuggy fair to good porosity and moderately hard to hard.
The second important hydrocarbon bearing formation is the Dalan formation, which is composed of the 3 main producing layers of K3, K4 and Nar. The K3 and K4 layers mainly consist of anhydrite, dolomite and limestone. The K3 dolomites are gray to dark gray, dark brown, brittle, fine crystalline, slightly argillaceous, hard to moderately hard, locally calcareous, micro-sucrosic, traced with oolites and pelloids and characterized by poor to visible porosity. The K3 anhydrite is characterized as milky white, soft to firm, amorphous, microcrystalline to cryptocrystalline, and is washable. Its limestone section is mainly mudstone and wackstone and can be light gray, off white, light grayish brown, soft, amorphous, cryptocrystalline to microcrystalline, chalky in parts, moderately argillaceous and having no visible porosity. On the other hand, the K4 dolomites are thin alternations of mudstone-wackstone with packstone-grainstone, light brown, light brownish gray to gray, moderately hard to hard, cryptocrystalline to microcrystalline, locally crystalline, brittle, sucrosic, traced with pelloids and oolites, locally argillaceous and carbonaceous and characterized by good visible porosity. The limestone part includes mudstone-wackstone and packstone-grainstone and is light brown, light gray, microcrystalline, oolitic, traced with pelloids and characterized by good visible porosity. The anhydrites in K4 are milky white, soft to firm, amorphous, cryptocrystalline and washable. Nar consists of anhydrite and dolomite. The anhydrite section can be summarized as white to milky white, soft to firm, amorphous, cryptocrystalline to microcrystalline, massive and washable; the associated dolomite section is light brown to light brownish gray, moderately hard to hard, compact, cryptocrystalline to microcrystalline, sucrosic and characterized by no visual porosity.
Data used in this article was collected from the drilled wells in the Kangan and Dalan carbonate formations pertaining to the studied field.
HFUs classification
HFUs are defined as correlatable and mappable zones within a reservoir that control fluid flow. Each flow unit is characterized by a flow zone indicator (FZI), which can be understood in terms of the relationship between the volume of void space ( ) and the geometric distribution of pore space (quantified as the reservoir quality index, RQI) as follows (Amaefule et al., 1993):


RQI can be calculated using the following equations:

The FZI can be rearranged in terms of the measurable RQI as given below:

Where k is permeability in mD and is the fractional porosity.
Rocks with a narrow range of FZI values belong to a single hydraulic unit, i.e., they have similar flow properties (Prasad, 2003). To estimate core-derived HFUs from 3D seismic attributes, which is the main objective of this study, the FZI data are calculated for 4 cored wells in one of the Persian Gulf hydrocarbon fields using the available porosity and permeability data. In this paper, data collected from the drilled wells and the 3D seismic data from the Kangan (K1 & K2), Dalan (K3 & K4) and Nar carbonate formations are presented. The formations that fall within the age of the Permian-Triassic range are known as reservoir formations, which cover large regions of the Persian Gulf. Flow unit classification is carried out on the basis of calculated flow zone indicators. Graphical clustering, using the RQI- plot, is found to be the simplest analytical method for determining the flow unit numbers, although it is not sufficient to distinguish between different flow units or to estimate their boundaries. To overcome these limitations, hierarchical cluster analysis is performed (Matlab user's guide, 2012). Cluster analysis starts by setting the number of flow units equal to the number of samples, then gradually merging the samples with similar FZI values into joint clusters. The sum squared error (SSE) in the log FZI calculation from the known primary porosity and permeability is evaluated using classifications with a different number of flow units (clusters) (Fig. 2a). The results show that any increase in the number of clusters above 5 does not lead to a significant reduction in the flow units estimation error. The clustering of FZI data is performed on the basis of the logarithm of FZI values because the FZI values calculated from actual field data usually exhibit a log-normal distribution. Because the FZI distribution is a superposition of multiple log-normal distributions, a histogram of log FZI values should show N number of normal distributions for N number of HFUs. Therefore, a histogram analysis is used as an alternative tool for clustering analysis. Fig. 2b shows the histogram of a log FZI distribution over the cored intervals. This is another efficient method for identifying the optimal number of flow units. In this regard, 5 HFUs are distinguished. This is consistent with the results of cluster analysis, indicating the reliability of the method applied. The flow units identified in the studied reservoir are as follows:
HFU 1: log FZI< -0.37
HFU 2: -0.37< log FZI< 0.19
HFU 3: 0.19< log FZI< 0.73
HFU 4: 0.73< log FZI< 1.36
HFU 5: log FZI> 1.36
The geological description of the clustered flow units is as follows.
HFU1: Shaly limestone and shaly dolostone with anhydrite interbeds; mudstone.
HFU2: Limestone; mudstone to packstone.
HFU3: Dolostone; mudstone to packstone.
HFU4: Limestone and dolomitic limestone; grainstone.
HFU5: Dolostone and limy dolostone; grainstone.

Porosity-permeability cross-plots for these flow units are shown in Fig. 3. This graph demonstrates that the subdivision of the studied reservoir into flow units illustrates the stronger relationships between porosity and permeability within each individual flow unit. The relationship between RQI and is used to show that samples with similar FZI values lie close together on a semilog plot of porosity versus permeability (Amaefule et al., 1993). Fig. 4 shows a plot of RQI versus for data from all cored intervals. HFU1 shows a poor reservoir quality with low to average permeability and porosity. HFU1 is mainly composed of fine grained, well rounded, moderately sorted sequences with high clay content. HFUs 2 and 3 have low to medium reservoir quality. HFU 4 has medium to good reservoir quality. HFU5 is composed of facies with high permeability and porosity values with an excellent reservoir quality. After identification of the flow units, we will attempt to merge them with seismic traces at well locations. The process of converting a 3D seismic cube to reservoir flow units is discussed below.


Correlation of well logs with seismic data
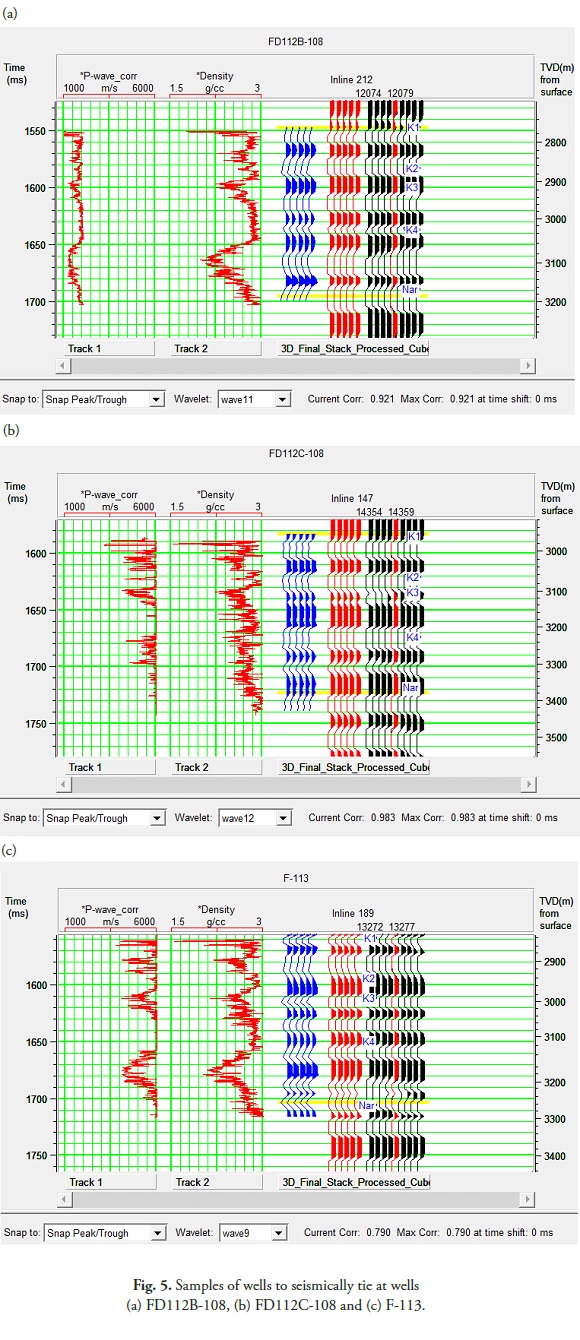
In the first step of this study, well log data are correlated to seismic data. Synthetic seismograms are generated for the available wells, including F-105, F-109, F-113, FD112B-108, FD112C-108 and FD112D-108. The acoustic velocities from the sonic logs are multiplied by the bulk density values from density logs to compute the acoustic impedance logs. This impedance is converted to reflectivity, which is then converted from depth to time using a suitable time–depth relationship. Finally, the reflectivity in time is convolved with an appropriate wavelet to produce a synthetic seismogram. The depth-to-time conversion of the well logs is accomplished by applying checkshot data, which has been supplied for all wells. It was necessary to create synthetics and to extract the wavelets iteratively for the placement of the log data in time. This depth-to-time process allowed for a comparison of the well logs and their associated tops with the seismic data in time. Horizon interpretations and geologic well tops are used as an aid in determining a time–depth relationship for deviated wells. The results of wells-to-seismic tie for wells FD112B-108, FD112C-108 and F-113 are illustrated in Fig. 5. As shown in the figure, the correlation between the synthetic seismogram (blue) and composite trace (red) at FD112B-108, FD112C-108 and F-113 is 0.92, 0.98 and 0.79, respectively.
Post-stack Seismic Inversion
A seismic reflection occurs when there is a change in acoustic impedances in the earth's layers. Post-stack seismic inversion is the process that attempts to remove the seismic source signature (wavelet) effect, which consequently reconstructs the velocity or impedance structure of underground layers from stacked seismic traces. It is assumed that the stack section does not contain the wavelet effect due to its removal by deconvolution. Therefore, wavelet side lobes are removed, and the tuning effect is diminished and resolution is increased. As such, a seismic reflection can be considered as the opposite of forward modeling, which involves creating a synthetic seismic section based on a model of the earth. To extract the seismic acoustic impedance as a 3D seismic attribute, a seismic inversion is carried out.
A post-stack seismic inversion is the process by which we analyze stacked seismic traces and attempt to reconstruct the velocity or impedance structure of the earth. First, an initial geological inversion model is created for the seismic inversion. An important component for building the model for the seismic inversion is a set of seismic horizons. These horizons are used to guide the interpolation between wells. When the model is built, the seismic data are ready for the inversion process. This process is performed in 2 stages. Fig. 6 shows the seismic impedances derived from post-stack seismic inversion crossing the well locations (wells FD112B-108, FD112C-108 and F-113). The inversion result is an attribute that is used for this research. The color scale is acoustic impedance. The seismic volume has been processed through a model-based inversion algorithm to produce an acoustic impedance volume. This volume is used as an attribute in the process. The color scale is shown in acoustic impedance units, with the higher acoustic impedance colored red to purple. The low acoustic impedance values are green to yellow. The acoustic impedance cubes are generated for all of the 3D seismic surveys using a model-based seismic inversion algorithm. The acoustic impedance cube is generated as a strong input to support the estimation of the HFU cube. Fig. 7 compares the well log impedance and the seismic impedance in wells FD112B-108, FD112C-108 and F-113. Table 1 shows the correlation and error between the well log impedance and the seismic impedance in wells FD112B-108, FD112C-108 and F-113.


Selection of optimal seismic attributes
Generally, the purpose of applying several statistical and intelligent models is to find linear and non-linear relationships and structures between input and output data. For this purpose, there should be a logical relationship between the input and target parameter. In this section, the statistical relationships between the input data (seismic attributes) and output data (log FZI) are investigated through the application of a multi-regression analysis. A multi-regression analysis is a simple and practical method to find the strongest inputs for predicting a target parameter. Accordingly, the multi-attributes to be used in the construction of the ANN models are chosen based on the trend obtained from regression analysis. The results of a multi-regression analysis for predicting HFUs are shown in Table 2. As seen in Table 2, adding more attributes improves the prediction process. This does not always mean that the added attributes are able to predict the true signal in the target data. The validation error can be considered as a criterion for determining when to stop adding attributes to the input set. The MSE (mean square error) between the real and estimated data is calculated. Training data are presented to the network during training, and the network is adjusted according to its error. The training set is used to train and create the network. The actual output of the training set data is used to develop the weights in the network. Validation data are used to measure network generalization and to halt training when generalization stops improving. The validation set is used to evaluate the accuracy of the newly built network by providing the network with a set of data it has never observed. According to Table 2, the first 4 attributes composed of acoustic impedance, dominant frequency, amplitude weighted phase and instantaneous phase are considered to be the optimal input sets for predicting HFUs.

Design of a probabilistic neural network for the estimation of HFUs
A probabilistic neural network (PNN) is a forward feed network built with 3 layers that can be used for predicting both continuous or discrete (classification) data. It was first proposed by Specht (1990) and is based on a distance concept between objects. It is a fast and efficient method to map a set of input data to their outputs. Pj is the distance scale factor for each of the input attributes. The only parameter of the PNN that needs to be optimized is the scale factor, Pj. In comparison with the other types of neural networks, such as the multi-layer perceptron that requires many parameters to be optimized, a PNN is simple, fast and efficient. The optimal value of Pj is obtained when the validation error reaches its minimum value. For optimizing distance scale factor Pj, the range parameter is taken between 0.10 and 3.00. The number of Pj values to evaluate is set at 25. The optimized values of Pj are as follows:
Acoustic impedance: 0.425; dominant frequency: 0.626; amplitude weighted phase: 0.885; instantaneous phase: 1.894; and global Pj: 1.014. The MSE of PNN models in the test data is measured as 0.015654. This error magnitude is obtained from the testing well.
Finally, using the PNN constructed for this research, the 3D seismic data of the studied reservoir are converted to HFUs. Seismic sections showing the distribution of the PNN estimated HFUs for testing data are shown in Fig. 8. This figure shows estimated HFUs for seismic data. As seen in Fig. 8, seismic sections crossing the well location indicate that the reservoir is mainly composed of flow units 2, 3 and 4, with good reservoir quality. According to Figs. 3 and 4, HFU 5 has the best reservoir quality, HFU 1 shows the worst reservoir quality and HFUs 2, 3 and 4 have good reservoir quality. These HFUs are shown in Fig. 8 separately. Fig. 9 shows a data slice through the PNN neural network that results in 1600 ms for studied area. As shown in this figure, the HFUs can be observed on the slice image, but the HFUs are not more obvious compared to what can be observed on the section image.
Conclusion
In this study, a PNN is used for the classification of HFUs from seismic attributes. The methodology introduced in this study is able to estimate HFUs from a large volume of 3D seismic data. This may increase exploration success rates and reduce costs through the application of more reliable results in hydrocarbon exploration programs. By analyzing core data and investigating its relation to seismic attributes, it is possible to offer a model for HFU prediction from 3D seismic data. The sum squared error (SSE) in the log FZI calculation from the known porosity and permeability data is used as a criterion for the identification of the optimum number of flow units. A histogram analysis is used to evaluate the results using classifications of the different number of flow units (clusters). The statistical relationships between input data (seismic attributes) and output data (HFUs) are investigated through the application of multi-regression analyses. Accordingly, the multi-attributes to be used in the construction of ANN models are chosen based on the trend obtained from regression analyses. The validation error can be considered as a criterion for determining when to stop adding attributes to the input set. 4 attributes, including acoustic impedance, dominant frequency, amplitude weighted phase and instantaneous phase, are considered to be the optimal inputs for predicting HFUs. The optimized values of the scale factor (Pj) in PNN are defined as follows: acoustic impedance: 0.425; dominant frequency: 0.626; amplitude weighted phase: 0.885; instantaneous phase: 1.894; and global Pj: 1.014.
Among the various attributes used, acoustic impedance shows a strong correlation with log FZI data. The results of this study show that a PNN is successful for converting a 3D volume of seismic data to flow units. Neural networks are still among the fastest and most robust tools for reservoir modeling and characterization.
The results of this research provide a unique parameter, the Flow Zone Indicator, for delineating the number of layers (hydraulic units) required for the assignment of geological and petrophysical parameters in numerical simulators.
Acknowledgements
The authors wish to thank Mr. Khorasani and Mr. Khoshdel from the NIOC and Mr. Soleimani from the Institute of Geophysics, University of Tehran for their useful comments on this work. The second author greatly appreciates the support of the Institute of Geophysics and the research council of the University of Tehran, which enabled him to perform this research.
References
Amaefule, J. O., Altunbay, M., Tiab, D., Kersey D. G., and Kedan, D. K. (1993). Enhanced reservoir description: Using core and log data to identify hydraulic (flow) unites and predict permeability in uncored intervals / wells. SPE. 26436: 1-16.
Aristimun, O. J., Aldana, M., (2006). Fuzzy logic prediction of petrophysical parameters (porosity and velocity) at La Faja del Orinoco, Venezuela. European Geosciences Union, Geophysical Research Abstracts. 8. 03825.
Balch, R.S., Stubbs, B.S., Weiss., W.W., Wo, S., (1999). Using artificial intelligence to correlate multiple seismic attributes to reservoir properties. Proceedings of the Society of Petroleum Engineers Annual Technical Conference, Houston, TX, USA. 553–566.
Chopra, S., Marfurt, K., (2006) .Seismic attributes- a promising aid for geologic prediction: Canadian Society of Exploration Geophysicists Recorder 2006 Special Edition. 111–121.
Dezfoolian, M. A., and Sanaee, R. (2012). A Comparison of Reservoir Mineralogy Prediction Utilizing Logging Data and Elastic Wave Velocities by Virtue of an Artificial Neural Network in South Pars Field. Petroleum Science and Technology. 30: 817–829.
Kadkhodaie, A., Rezaee, M.R., Rahimpour-Bonab, H. and Chehrazi, A. (2009). Petrophysical data prediction from seismic attributes using committee fuzzy inference system, Computers & Geosciences. 35: 2314–2330
Kadkhodaie-Ilkhchi, A., Rezaee, M.R., Moallemi, S.A. (2006). A fuzzy logic approach for the estimation of permeability and rock types from conventional well log data: an example from the Kangan reservoir in Iran Offshore Gas Field, Iran. Journal of Geophysics and Engineering 3: 356–369.
Matlab User's guide. (2012). Statistical toolbox, Matlab CDRoom. The Math Works, Inc.
Meldahl, P., Heggland, R., Bril, B., Groot, P., (2001). Identifying faults and gas chimneys using multiattributes and neural networks. The Leading Edge. 20: 474–478.
Nikravesh, M., Aminzadeh, F., (2001). Mining and fusion of petroleum data with fuzzy logic and neural network agents. Journal of Petroleum Science and Engineering. 29: 221–238.
Nikravesh, M., Hassibi, M., (2003). Intelligent reservoir characterization (IRESC). Proceedings of IEEE International Conference on Industrial Informatics 2003. Banff, Alberta, Issue, 21–24: 369–373.
Nikravesh, M., Novak, B., Aminzadeh, F., (1998). Data mining and fusion with integrated neuro-fuzzy agents: rock properties and seismic attenuation. Proceeding of JCIS 1998, The Fourth Joint Conference on Information Sciences, North Carolina, USA.
Prasad, M. (2003). Velocity-permeability relations within hydraulic units. Geophysics. 68: 108-117.
Rezaee, M.R., Kadkhodaie-Ilkhchi, A., Barabadi, A. (2007). Prediction of shear wave velocity from petrophysical data utilizing intelligent systems: an example from a sandstone reservoir of Canarvon Basin, Australia. Journal of Petroleum Science and Engineering. 55: 201–212.
Russell, B.H. (2004). The application of multivariate statistics and neural networks to the prediction of reservoir parameters using seismic attributes. Ph.D. Dissertation, University of Calgary, Alberta. pp. 392.
Russell, B.H., Lines, L.R., Hampson, D. P., (2003). Application of the radial basis function neural network to the prediction of log properties from seismic data. Exploration Geophysics. 34: 15–23.
Russell, B.H., Ross, C.P., Lines, L.R., (2002). Neural networks and AVO. The Leading Edge. 21 (3): 268–277.
Soubotcheva, N., Stewart, N., (2006). Predicting lithology and porosity at the pikes peak heavy oilfield, Saskatchewan using 3D seismic data and well logs. Canadian Society of Exploration Geophysicists Recorder. 35-39.
Specht, D. (1990). Probabilistic neural networks. Neural Networks 3. 109–118.
Svirsky, D., Ryazanov, A., Pankov, M., Yukos, E.P., and Corbett , P.W.M. (2004). Hydraulic flow units resolve reservoir description challenges in a Siberian Oil Field. SPE. 87056.
Trappe, H., Hellmich, C., (2000). Using neural networks to predict porosity thickness from 3D seismic. First Break. 18 (9): 377–384.
Wong, P.M., Nikravesh, M., (2001). Introduction: field applications of intelligent computing techniques. Journal of Petroleum Geology. 24 (4): 381–387.
How to Cite
APA
ACM
ACS
ABNT
Chicago
Harvard
IEEE
MLA
Turabian
Vancouver
Download Citation
Article abstract page views
Downloads
License
Earth Sciences Research Journal holds a Creative Commons Attribution license.
You are free to:
Share — copy and redistribute the material in any medium or format
Adapt — remix, transform, and build upon the material for any purpose, even commercially.
The licensor cannot revoke these freedoms as long as you follow the license terms.
The Earth Sciences Research Journal is the copyright holder for these license attributes.