
Published
Load area aggregation considering integration of electric vehicles to the system
Agregación de áreas de carga considerando la integración de vehículos eléctricos a la red
DOI:
https://doi.org/10.15446/ing.investig.v35n1Sup.53652Keywords:
Reduction of power systems, measurement-based load modeling approach, electric vehicle, particle swarm optimization. (en)Reducción de sistemas de potencia, modelado de carga basado en mediciones, vehículo eléctrico, optimización por enjambre de partículas. (es)
studies. In order to validate the application of the proposed methodology, a 30-bus power system considering several disturbances and levels of penetration of the electric vehicles was used. The results show that the equivalent network model allows the reproduction of different events with an acceptable accuracy when it is compared to the original system behavior.
DOI: https://doi.org/10.15446/ing.investig.v35n1Sup.53652
Load area aggregation considering integration
of electric vehicles to the system
Agregación de áreas de carga considerando la integración
de vehículos eléctricos a la red
L.F. Rodríguez-Garcia1, S.M. Pérez-Londoño2, and J.J. Mora-Flórez3
1 Luis Fernando Rodriguez: Electrical engineer, M.Sc. Universidad Tecnológica de Pereira, Colombia. Affiliation: Researcher at ICE3, Universidad Tecnológica de Pereira, Colombia. E-mail: luferodriguez@utp.edu.co.
2 Sandra Milena Pérez Londoño: Electrical engineer, M.Sc. Universidad Tecnológica de Pereira, Colombia. Ph.D., Universidad Nacional de Colombia. Affiliation: Associated professor at Universidad Tecnológica de Pereira, Pereira, Colombia. E-mail: saperez@utp.edu.co.
3 Juan José Mora Flórez: Electrical engineer, M.S Universidad Industrial de Santander, Bucaramanga, Colombia. Ph.D., Universitad de Girona, España. Affiliation: Associated professor at Universidad Tecnológica de Pereira, Pereira, Colombia. E-mail: jjmora@utp.edu.co.
How to cite: Rodríguez-Garcia, L.F., Pérez-Londoño, S.M., & Mora-Flórez, J.J. (2015). Load area aggregation considering integration of electric vehicles to the system. Ingeniería e Investigación, 35(Sup1), 42-49.
DOI: https://doi.org/10.15446/ing.investig.v35n1Sup.53652
ABSTRACT
Current electric power systems have an increasing penetration of electric vehicles, and its effect has to be considered in different studies, such as optimal dispatch or voltage stability, among others. Additionally, considering that power system analysis becomes complex when the number of buses increase, this paper presents a methodology for aggregation of load areas that use a measurement-based load modeling approach based on an evolutionary computational technique and a classical reduction method. This aggregate load area model is proposed to reduce areas that ddconsider electric vehicle (EV) load models. The proposed method provides a static equivalent load model and an equivalent network that can be used to reduce the computational effort required by power system studies. In order to validate the application of the proposed methodology, a 30-bus power system considering several disturbances and levels of penetration of the electric vehicles was used. The results show that the equivalent network model allows the reproduction of different events with an acceptable accuracy when it is compared to the original system behavior.
Keywords: Reduction of power systems, measurement-based load modeling approach, electric vehicle, particle swarm optimization.
RESUMEN
Con la inclusión de los vehículos eléctricos en las redes de energía es necesario analizar su impacto en los diferentes estudios, como el caso del despacho óptimo o análisis de estabilidad de tensión, entre otros. Debido a que el análisis de los sistemas de potencia se hace más complejo a medida que se incrementa el número de barras, en este artículo se presenta una metodología para la agregación de áreas de carga, que emplea el modelado de carga basado en mediciones, que a su vez se basa en una técnica computacional evolutiva y un método clásico de reducción. Se propone este modelo de agregación de área de carga con el fin de reducir áreas que contienen modelos de carga de vehículos eléctricos. El método propuesto provee un modelo equivalente estático de carga y de la red, que puede emplearse para reducir el tiempo computacional requerido para análisis específicos en la red. La metodología propuesta se valida en el sistema modificado IEEE de 30 barras, ante diferentes perturbaciones y diferentes niveles de penetración de los vehículos eléctricos. Los resultados muestran que el equivalente de red obtenido permite reproducir los diferentes eventos con una aceptable exactitud en comparación con el comportamiento del sistema original.
Palabras clave: Reducción de sistemas de potencia, modelado de carga basado en mediciones, vehículo eléctrico, optimización por enjambre de partículas.
Received: September 14th 2015
Accepted: October 10th 2015
Introduction
Nowadays, power system studies may become complex as new elements are increasingly connected to the network. One of these special elements are the electric vehicles (EV), which pose new challenges and have become an important area of research. These load elements presented a growing interest in the last years, as shown in Figure 1, due to their environmental and economic benefits, compared to conventional vehicles (Global EV Outlook 2015 Update, 2015).
Several studies on grid impacts associated with EV charging were proposed; steady-state voltage stability has been analyzed in (Dharmakeerthi, Mithulananthan & Saha, 2014) (Mitra & Venayagamoortghy, 2010), small signal stability in (Das & Aliprantis, 2008), influence in grid load capacity in (Hadley, 2006) and power quality in (Richardson, Flynn & Keane, 2010) (Garcia & Pecas, 2013), among others. However, as mentioned above, the presence of these loads in studies may imply exigent computational analysis efforts, and therefore the incorporation of EV load model in network reduction methodologies is required, since it was not previously analyzed.

Figure 1. Global EV sales.
Source: http://www.iea.org
Currently, power grids are huge and highly interconnected systems, with thousands of elements that present complex interactions among them. Generally, when a specific study is performed in these systems, analysts are interested in the behavior of a specific part of the system (internal), and therefore it is required to employ tools that allow to reduce the rest of the system (external) that does not require a detailed description. The objective of the network reduction is to obtain an equivalent system (static or dynamic) at the interface to the non-reduced part of the grid (internal system), which presents a similar behavior compared to the original system. This allows an improvement of the computational time and reduces the resources used in several analysis tasks (Sturk, Vanfretti, Milano & Sandberg, 2012).
During the last decades, different techniques on power system reduction were proposed. These methods are suitable for stability analysis, steady state power flow for security assessment and control applications. Generator aggregation based in coherency approach (Chow, Galarza, Accari & Price, 1995) (Milano & Srivastava, 2009), modal analysis (Chaniotis & Pai, 2005)(Ghosh & Senroy, 2012) and identification approach (Ramirez, 1999) were widely used, in contrast to the equivalents of loads that was less analyzed. This has been sustained by the uncertainty in the composition and diverse characteristics of loads that do not allow to define an adequate and accurate model. Additionally, the integration of new load models in the power systems, such as electric vehicles (EV) increases such uncertainties.
Related to load area reduction, the following approaches were proposed: In (Wen, Jiang, Wu & Cheng, 2003) (Wen, Wu, Nutall, Shimmin & Cheng 2003) the authors proposed an aggregated load area model (ALAM). A genetic algorithm was used to find the parameters of an equivalent static load model and ficticious transmission lines for power transient stability analysis. A ZIP load model with frequency dependent terms was used to replace the external area in a 5-bus power system. It was demonstrated that the aggregated load area model can accurately capture the behavior of the load area in both steady-state and transient analysis; however, only static loads were considered in these two references. Later, the same authors, Wen, Wu et al, in (Wen et al., 2004) proposed the incorporation of an aggregate exponential recovery model in order to achieve the dynamic characteristics of the ALAM for long-term voltage stability analysis. Another evolutionary computation technique such as Particle Swarm Optimization was used to obtain an equivalent load area model. For instance, in (Wei, Wang, Wu & Lu, 2005) the parameters of fictitious line (R, X), line shunt admittance together with six coefficients of the ZIP load model were identified using one step identification scheme compared with the two-step scheme used in the previous references (Wen, Jiang, Wu & Cheng, 2003) (Wen, Wu, Nutall, Shimmin & Cheng 2003).
The methodologies above exposed also require parameter estimation of equivalent load and parameters of lines that interconnect it to the boundary nodes. This can represent a major computational effort, due to the several parameters that must be estimated. In this paper, the authors propose the reduction of the effort of the estimation algorithm, using, first, a classical reduction methods such as static Ward reduction for fictitious line parameter determination, and, next, only an optimization technique for the estimation of the equivalent load parameter of the load area that includes EVs.
The structure of this paper is organized as follows. Section II presents the theoretical background related to EV applied load models and the network reduction formulation. In Section III the proposed methodology is exposed. Based on that, the simulation results are shown when the methodology is tested on a modified IEEE 30 bus system in Section IV. Finally, in Section V the main conclusions obtained from the result analysis and the future work tasks are presented.
Theoretical Background
Electric vehicle load model
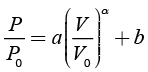
According to the previous scientific related documents review, the constant power load model has been widely used to represent the EV load in distribution systems, but it was found that this assumption might not be accurate (Haidar & Muttaqi, 2013). Recently in (Dharmakeerthi et al., 2014), the authors propose a combination of constant power and an exponential load model with negative a for static voltage stability purposes. This negative characteristic is due to the influence of the parasitic resistance of the input filter inductor. Equation (1) represents this formulation.
 (1)
(1)
Where parameters a, b and α depend on resistance values of charger configuration and P0 represents the power consumption of the charger at the reference voltage (V0 ). This load model was used in this paper.
Network reduction
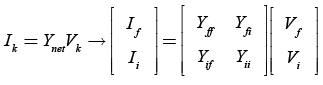
For power system reduction purposes, it is necessary to divide the power system into three parts: an external area, which is susceptible to being replaced by an equivalent representation (for this paper, it corresponds to the loading area); an internal area, which is the rest of the system under study and remains unaltered during the reduction process; and a set of boundary buses which links these areas. The existing equivalent methods including the Thevenin equivalent method, the traditional Ward equivalent method (Ward, 1974) and the extended Ward equivalent method (Monticelli et al.,1979) were widely used. For this paper, the classical Ward equivalent was used. The Ward equivalent methodology replaces the external system for a set of transmission lines (that interconnect boundary nodes Ymn) and a set of power injections and shunt admittances Y0i connected to boundary nodes. Figure 2 shows the configuration of the system.
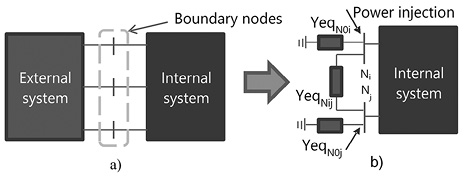
Figure 2. a. Power system division for reduction purpose. b. Equivalent network after Ward equivalent. Source: (Deckmann et al., 1980).
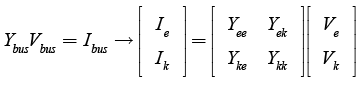
Initially, consider the full system nodal admittance matrix Ybus(2), that can be rewritten in terms of subscript e and is related to a set of nodes of external subsystem; and subscript k, which corresponds to set of boundary and internal nodes subsystem.
 (2)
(2)
Where Ibus is the nodal injection current vector, Vbus is the nodal voltage vector. In order to obtain the network reduction with the Ward approach (Deckmann et al, 1980), the Gaussian elimination method is applied to Ybus, as shown in Equation (3).
 (3)
(3)
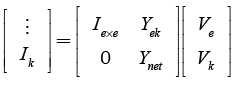
Where Ie×e is an upper triangular matrix of size e×e and Ynet is the reduced system´s nodal admittance matrix according to Equation (4).
 (4)
(4)
Subscript f is related to the boundary nodes set and subscript i is related to the internal nodes set. Matrix Ynet includes equivalent shunt admittances Y0j and equivalent branches connecting boundary-boundary buses Ymn of Figure 2, according to Equations (5) and (6).
 (5)
(5)
 (6)
(6)
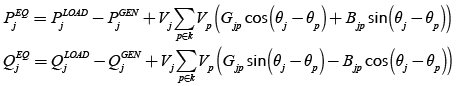
Shunt admittances connected to each boundary bus Y0j are calculated by subtracting the shunt capacitance of lines of the internal system to the value obtained from Equation (6). Finally, the Ward equivalent method considers equivalent power injections at boundary buses (Monticelli et al., 1979), as shown in Equation (7).
 (7)
(7)
Where  ,
,  are the real and reactive power of load elements connected in boundary node j respectively;
  ,
,  are the real and reactive power injections in boundary j, respectively; Gjp and Bjp are the real and imaginary parts of the j-p element pertaining to the reduced admittance matrix Ynet ; Vj, θj correspond to the voltage magnitude and the voltage angle value of node j, respectively.
Methodology
The purpose behind the network reduction is to develop an aggregate load model to facilitate static analysis of the power system when penetration of EV loads is considered.
The proposed approach for load area reduction is based on strategies that divide the power system under study in three subsystems (area to be reduced or external subsystem, the boundary buses and the internal subsystem) as depicted in Figure 3. For this study, load area is considered as the external subsystem (including EV load models and ZIP load models connected to external nodes), which is finally represented by means of equivalent ZIP load models connected to the boundary buses, whose parameters are calculated using a measurement-based load modeling process.
Only the impedances that interconnect boundary buses are obtained from a Ward equivalent method. This allows the reduction of the effort of the estimation algorithm and improves the aggregation load process.
The general procedure is depicted in Figure 3, where initially a Ward equivalent of the external system is calculated; this area is supposed to contain only loads and EV models. Subsequently, measurements of active and reactive power flowing in the external area are obtained, in order to determine an equivalent representation of power consumed by the load area; this procedure is achieved using Particle Swarm Optimization (PSO) for the minimization of the differences between the measured data and model simulated data.
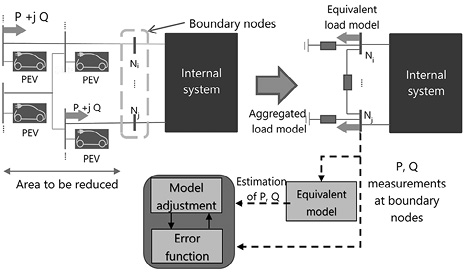
Figure 3. Aggregation load area structure.
Load model parameterization using measurements
A measurement-based load modeling procedure is applied to obtain a representation by means of a load model of the power supplied to the load area. This procedure requires of the initial selection of a model structure, which is expected to accurately represent the response of elements aggregated by the load model; this model has a defined structure of unknown parameters. Once a model structure is chosen, a fitting process is used to determine a set of these parameters that best fit the model response to the measurements acquired from the power system.
Model structure definition
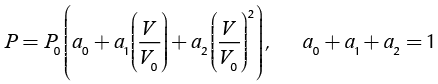
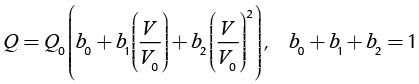
Equivalent loads connected to each boundary bus are represented using a ZIP load model as shown in Figure 3. This structure is defined according to Equations (8) and (9):
 (8)
(8)
 (9)
(9)
where P, Q are the active and reactive power consumed by the load, P0, Q0 are the initial active and reactive power consumed by the load (obtained from a power flow solution), a0, a1, a2 are coefficients related to constant power, constant current and constant impedance components of active load, and b0, b1, b2 are coefficients related to constant power, constant current and constant impedance components of the reactive load, respectively.
Estimation of load parameters
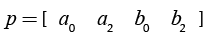
The estimation process can be formulated as an optimization process, where a set of load model parameters is determined in order to minimize the differences between measurements and load response. The optimization process applied for this study is Particle Swarm Optimization (Del Valle et al., 2008)(Hong, 2009)(Yoshida et al., 2000). PSO is a population-based method where solutions, called particles, fly around the search space according to its own experience and swarm experience. Each particle p is composed of four elements, as indicated in Equation (10).
 (10)
(10)
With the remaining parameters, a1, b1 are calculated according to Equations (8) and (9). A modified particle swarm optimization method that uses a mechanism of speed restart is applied for estimation (Rodríguez, Pérez and Mora, 2013).
Test results
In this section, the proposed aggregation load model approach is validated in a modified IEEE 30-bus test system (PSTCA, 2015) that considers EV load model incorporation.
The power system is divided into the following external, boundary and internal networks in order to reduce the loading area. The proposed division is shown in Table 1 and is depicted in Figure 4. This division is proposed to define an area of a high concentration of loads, which is separated from the main sources of power generation.
Table 1. Power system division for network reduction.
|
Internal system |
1 2 3 4 5 6 7 8 9 11 13 25 26 27 28 29 30 |
|
Boundary buses |
10 12 24 |
|
External system (shaded area) |
14 15 16 17 18 19 20 21 22 23 |
Figure 4. Test system division for reduction.
Source: (PSTCA, 2015).
Loads in the internal system are represented using ZIP load models. EV load models exposed in Equation (1) are also considered for loads connected to buses 18, 21 and 24, equivalent to 40 %, 20 % and 30 % of total active load connected to the bus. The parameters of EV load models are selected according to (Dharmakeerthi, Mithulananthan and Saha, 2014). The selected parameters consider the worst-case scenario for voltage stability, which corresponds to the most negative value for the exponent of EV load model.
Validation of the proposed methodology
In order to test the capabilities of the aggregation strategy, a cross-validation-based method is proposed. A set of three disturbances is simulated and measurements of voltage magnitude at boundary buses, active power and reactive power flowing into the external area are also stored. The considered disturbances include outage of line connected between buses 1 and 2 (dataset 1), three-phase fault at bus 7, fault resistance of 0.1 p.u. and fault time of 200 ms (dataset 2) and three-phase fault at bus 30, fault resistance of 0.1 p.u. and fault time of 250 ms (dataset 3).
These disturbances are simulated to consider different levels of voltage variation, which have a direct effect on the load model ability to represent the aggregated load response. To illustrate the severity of the disturbances in the power system, Figure 6 shows the voltage variation at bus 10 during these disturbances.
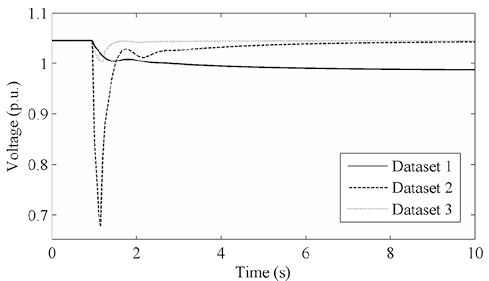
Figure 5. Voltage variation at bus 10 for the simulated events.
In this case, the second event has the greatest voltage variation of the considered disturbances, which may have implications on load area equivalent generalization.
The equivalent system obtained for dataset 1 is shown in Figure 6, where three equivalent transmission lines are included, L10-12, L12-24 and L10-24, and three equivalent ZIP load models at the boundary buses. The results obtained with the network reduction methodology are shown in Table 2.
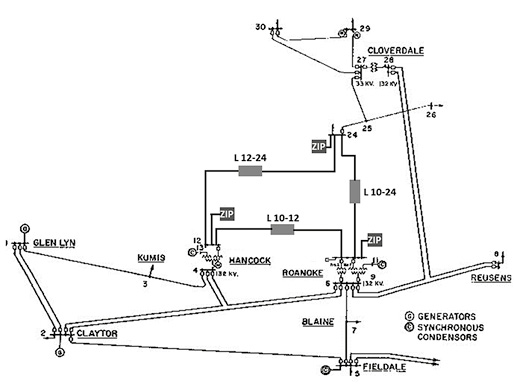
Figure 6. Equivalent power system for modified IEEE 30-bus system.
Table 2. Equivalent line parameters and shunt admittances for dataset 1.
|
Parameter |
Value (p.u) |
|
Impedance L10-12 |
0.12823501 + 0.30729292i |
|
Impedance L12-24 |
0.33232569 + 0.65118768i |
|
Impedance L10-24 |
0.13300940 + 0.22521537i |
|
Shunt bus 10 |
-2.22044604e-16 + 4.16333634e-17i |
|
Shunt bus 12 |
-7.77156117e-16 - 5.55111512e-15i |
|
Shunt bus 14 |
2.22044604e-16 + 1.77635683e-15i |
Table 3 summarizes the estimated parameters for equivalent ZIP loads connected to boundary buses.
Table 3. Estimated ZIP parameters for equivalent loads.
|
Parameters |
Bus 10 |
Bus 12 |
Bus 24 |
|
a0 |
0.34216 |
0.04718 |
0.34607 |
|
a2 |
0.48377 |
0.38127 |
0.48792 |
|
b0 |
0.26202 |
0.36583 |
0.07772 |
|
b2 |
0.12420 |
0.58146 |
0.07238 |
Figures 7 and 8 show the results for active and reactive power of the power injection at bus 10; these results include the validation of the equivalent response to the same disturbance used for estimation, indicated as Disturbance 1. However, it is important to analyze if this model is also adequate to represent the power injection under different contingencies; in this case, a cross validation method is useful to analyze the generalization capability of the model. In general terms, if a set of N measurements are stored, a load equivalent is obtained using one of these datasets and validated with the remaining datasets. An error indicator is determined for each validation case, as for active and reactive power. An average relative error is calculated according to (11):
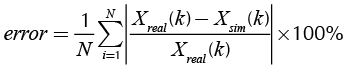 (11)
(11)
In relation to the generalization capabilities of the equivalent load model presented in Table 2, the cross validation process was applied. Figures 7 and 8 also show the results for active and reactive power response of load area equivalent obtained from Dataset 1 at bus 10, when it is validated using information of Datasets 1 to 3. Dotted lines indicate Measured data obtained from datasets (M), while solid lines indicate Simulated data obtained from load area equivalent response (S).
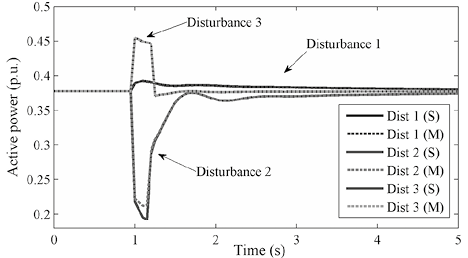
Figure 7. Active power response of load area equivalent under three different scenarios.
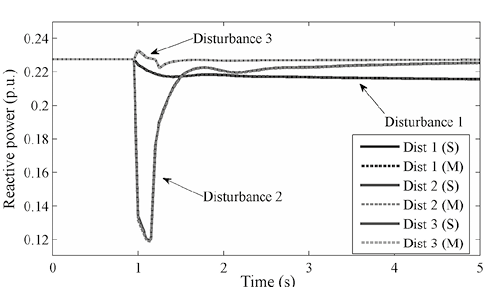
Figure 8. Active power response of load area equivalent under three different scenarios.
With exception of load area active power response to disturbance 2, measured data from power system and simulated data from load area equivalent are overlapped in Figures 7 and 8. The differences observed for the validation process considering disturbance 2 are due to the fact that load equi-valent was obtained with data of a voltage disturbance from 1.03 p.u. to 0.99 p.u.; however, it was tested to represent a disturbance with a voltage variation from 1.03 to 0.68.
Load equivalents are more accurate when these are tested with disturbances that have a similar voltage variation compared to the disturbance used for estimation. Tables 4 and 5 summarize cross-validation results for active and reactive power, respectively.
For all models and buses, estimation errors are less than 1 %. The load area equivalent obtained using the Dataset 3 (Model 3) has considerable higher errors when it is validated using Dataset 1 and Dataset 2. This is due to the fact that Model 3 has a better response when disturbances have a similar response to the measurements used for obtaining the load model. However, it is evident that estimation errors are still low and load equivalents are valid under these circumstances.
Table 4. Active power cross-validation.
|
Bus 10 |
Dataset 1 |
Dataset 2 |
Dataset 3 |
|
|
Model 1 |
0.0122 |
0.14376 |
0.00027 |
|
|
Model 2 |
0.42512 |
0.13893 |
0.01595 |
|
|
Model 3 |
0.01068 |
0.18646 |
0.00059 |
|
|
Bus 12 |
Dataset 1 |
Dataset 2 |
Dataset 3 |
|
|
Model 1 |
0.00478 |
0.02867 |
0.00772 |
|
|
Model 2 |
0.12531 |
0.01419 |
0.00539 |
|
|
Model 3 |
0.40492 |
0.11334 |
0.00731 |
|
|
Bus 24 |
Dataset 1 |
Dataset 2 |
Dataset 3 |
|
|
Model 1 |
0.01712 |
0.09388 |
0.00875 |
|
|
Model 2 |
0.53780 |
0.14298 |
0.01369 |
|
|
Model 3 |
0.87991 |
0.23030 |
0.01819 |
Table 5. Reactive power cross-validation.
|
Bus 10 |
Dataset 1 |
Dataset 2 |
Dataset 3 |
|
|
Model 1 |
0.01661 |
0.06628 |
0.00562 |
|
|
Model 2 |
0.18636 |
0.01546 |
0.00591 |
|
|
Model 3 |
0.08035 |
0.16943 |
0.00524 |
|
|
Bus 12 |
Dataset 1 |
Dataset 2 |
Dataset 3 |
|
|
Model 1 |
0.03605 |
0.13484 |
0.03069 |
|
|
Model 2 |
0.52618 |
0.05718 |
0.02081 |
|
|
Model 3 |
1.38231 |
0.32133 |
0.02795 |
|
|
Bus 24 |
Dataset 1 |
Dataset 2 |
Dataset 3 |
|
|
Model 1 |
0.02118 |
0.09915 |
0.07723 |
|
|
Model 2 |
0.28984 |
0.04775 |
0.06943 |
|
|
Model 3 |
3.10707 |
1.03557 |
0.07636 |
Equivalent validation considering changes in penetration levels of EV load
In order to verify the equivalent response after changes in load composition, loads of EV load models are increased to 1.5 times its rated value. Equivalent load area is obtained using Dataset 2 (Model 2). Initial power of ZIP loads needs to be recalculated using load flow information; however, ZIP load model parameters are not modified. Fault event of dataset 1 is simulated for the modified system. Active and reactive power results for each bus are depicted in Figures 9-11. Despite variation in load composition due to the increase of EV active load, the load area equivalent response is adequate for the representation of the load area.
Conclusions
In this paper, a methodology based on measurement based load modeling approach and the classical reduction method for aggregation of load area model is proposed. The equivalent ZIP load model and the fictitious lines and shunt admittances obtained, can substitute the external system that considers EV load models, preserving the internal system behavior. The equivalent model system parameters can be obtained using an evolutionary computational technique based on system measurements and the Ward equivalent method. Satisfactory results were obtained when the equivalent load model had been tested under several perturbation and different penetration levels of EV load.
This methodology can be easily implemented when measurements at boundary nodes are available. This will allow a continuous updating process of the equivalent load model.
Due to the fact that large scale deployment of EVs could bring major challenges to power system analysis, the methodology proposed in this paper can provide an alternative tool to reduce the associated efforts. Future work will involve other equivalent load models when a large number of EVs in the power grid are considered.
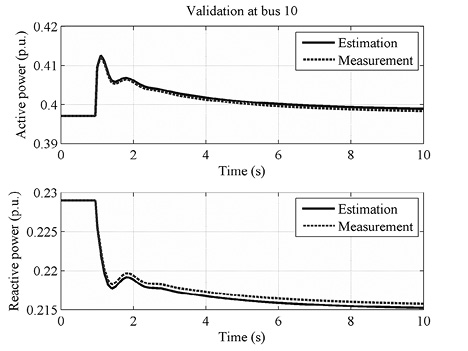
Figure 9. Active and reactive power response of power flowing through bus 10.
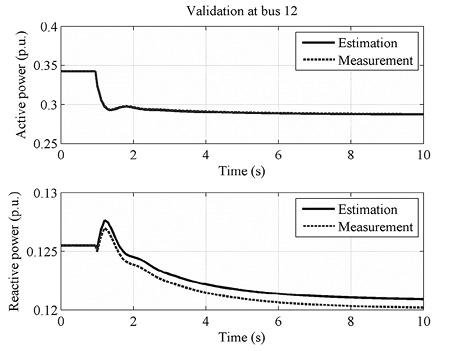
Figure 10. Active and reactive power response of power flowing through bus 12.
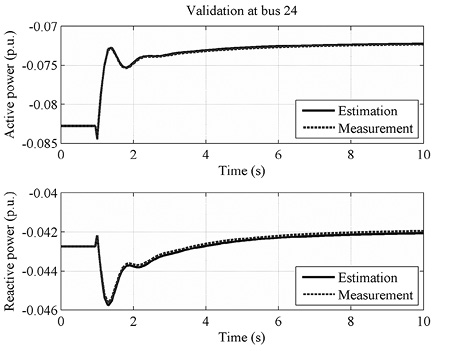
Figure 11. Active and reactive power response of power flowing through bus 24.
Acknowledgments
The authors are grateful for the support from (COLCIENCIAS) and the Universidad Tecnológica de Pereira, Colombia, under contract 566 “Jóvenes Investigadores e Innovadores”.
References
Duki, S. & Sari, A., (2013). A new approach to physics-based reduction of power system dynamic models. Electric Power Systems Research, vol. 101, pp. 17-24.DOI: 10.1016/j.epsr.2013.03.005
Chaniotis, D. & Pai, M. A., (2005). Model reduction in power systems using Krylov subspace methods., IEEE Trans Power Syst, 20 (2), pp. 888 -894. DOI: 10.1109/TPWRS.2005.846109
Chow, J.H., Galarza, R., Accari, P. & Price, W.W., (1995). Inertial and slow coherency aggregation algorithms for power system dynamic model reduction. IEEE Trans on Power Systems, 10 (2), pp. 680-685. DOI: 10.1109/59.387903
Das T & Aliprabtis DC, (2008). Small-signal stability analysis of power system integrated with PHEVs. Presented at Energy 2030 conf,. IEEE, p. 1-4. DOI: 10.1109/energy.2008.4781036
Deckmann, S., Pizzolante, A., Monticelli, A., Stott, B. & Alsac, O., (1980). Studies on Power System Load Flow Equivalencing., IEEE Trans. Power App. and Syst., PAS-99 (6), pp. 2301-2310. DOI: 10.1109/tpas.1980.319798
Del Valle, Y., Venayagamoorthy, G.K., Mohagheghi, S., Hernandez, J.-C. & Harley R. G. (2008), Particle Swarm Optimization: Basic Concepts, Variants and Applications in Power Systems, IEEE Transactions on Evolutionary Computation, 12 (2), pp. 171-195. DOI: 10.1109/TEVC.2007.896686
Dharmakeerthi CH., Mithulananthan N., & Saha TK., (2014). Impact of electric vehicle fast charging on power system voltage stability. Electric Power Energy Systems, 57, pp. 241–249
Garcia-Valle, R., & Pecas, J., (2013), Electric vehicle integration into modern power networks. Springer, p. 298.
Ghosh, S., & Senroy, N., (2012). A comparative study of two model order reduction approaches for application in power systems. Presented at IEEE PES General Meeting, pp.1-8. DOI: 10.1109/pesgm.2012.6344785
Global EV Outlook 2015 Update (2015). International Energy Agency. http://www.iea.org/topics/transport/subtopics/electricvehiclesinitiative.
Hadley S., Impact of Plug-in Hybrid Vehicles on the Electric Grid (2006). Oak Ridge, TN: Oak Ridge National Laboratory, 2006. DOI: 10.2172/974613
Haidar, A.M.A., & Muttaqi, K.M., (2013), Impact assessment of electric vehicle demand through load modeling, Presented at 2013 Australasian Universities Power Engineering Conference (AUPEC).
Hong, W.-C., (2009), Chaotic particle swarm optimization algorithm in a support vector regression electric load forecasting model, Energy Conversion and Management, 50 (1), pp. 105-117. DOI: 10.1016/j.enconman.2008.08.031
Milano, F., & Srivastava, K., (2009), Dynamic REI equivalents for short circuit and transient stability analyses, Electric Power Systems Research, 79 (6), pp. 878- 887.DOI: 10.1016/j.epsr.2008.11.007
Mitra P., & Venayagamoorthy GK. (2010), Wide area control for improving stability of a power system with plug-in electric vehicles. IET Generation Transmission Distribution, 4, 1151-1163. DOI: 10.1049/iet-gtd.2009.0505
Monticelli, A., Deckmann, S., Garcia, A., & Stott, B. (1979), Real-Time External Equivalents for Static Security Analysis, IEEE Trans on Power Apparatus and Systems, PAS-98 (2), pp. 498-508. DOI: 10.1109/TPAS.1979.319387
PSTCA, Power Systems Test Case Archive Retrieved 2015, http://www.ee.washington.edu/research/pstca/
Ramirez, J.M. (1999), Obtaining dynamic equivalents through the minimization of a line flows function, International Journal of Electrical Power & Energy Systems, 21 (5), pp. 365-373. DOI: /10.1016/S0142-0615(99)00005-8
Richardson P., Flynn D., & Keane A., (2010), Impact Assessment of Varying Penetrations of Electric Vehicles on Low Voltage Distribution Systems, Presented at IEEE PES General Meeting, pp. 1-6. DOI: 10.1109/PES.2010.5589940
Rodriguez, L., Perez, S., & Mora , J.J., (2013). Particle swarm optimization applied in power system measurement-based load modeling., IEEE Congress on Evolutionary Computation, pp. 2368-2375. DOI: 10.1109/cec.2013.6557852
Sturk, C., Vanfretti, L., Milano, F., & Sandberg, H., (2012), Structured model reduction of power systems, Presented at American Control Conference (ACC), pp. 2276-2282.
Ward, J.B. Equivalent circuits for power flow studies (1974), IEEE Trans on Power Apparatus and Systems, PAS-68, pp. 373–382.
Wei, J., Wang, J., Wu, Q., & Lu, N., (2005). Power System Aggregate Load Area Modelling by Particle Swarm Optimization., International Journal of Automation and Computing, 2, pp. 171-178. DOI: 10.1007/s11633-005-0171-5
Wen, J. Y., Jiang, L., Wu, Q., & Cheng, S., (2003). Power system load modelling by learning based on system measurements, IEEE Transactions on Power Delivery, 18, pp. 364-371. DOI: 10.1109/TPWRD.2003.809730
Wen, J., Wu, Q., Nuttall, K., Shimmin, .D, & Cheng, S., (2003). Construction of power system load models and network equivalence using an evolutionary computation technique, International Journal of Electrical Power & Energy Systems, 25 (4), pp. 293-299. DOI: 10.1016/S0142-0615(02)00080-7
Wen, J., Wu, Q., Turner, D., Cheng, S., Fitch, J., & Mann, S., (2004). Aggregate Load Area Model for Voltage Stability Studies. Presented at International Conference on Power System Technology, Singapore, pp. 1585-1588.
Yoshida, H., Kawata, K., Fukuyama, Y., Takayama, S. and Nakanishi, Y. (2000), A particle swarm optimization for reactive power and voltage control considering voltage security assessment,” IEEE Trans. Power Systems, 15 (4), pp.1232-1239. DOI: 10.1109/59.898095
How to Cite
APA
ACM
ACS
ABNT
Chicago
Harvard
IEEE
MLA
Turabian
Vancouver
Download Citation
CrossRef Cited-by
1. Bin Huang, X. Y. Shang, J. H. Zheng, Zhigang Li, Q. H. Wu, X. X. Zhou. (2019). Electrical Network Equivalent Modeling Method with Boundary Buses Interconnected. 2019 IEEE PES GTD Grand International Conference and Exposition Asia (GTD Asia). , p.429. https://doi.org/10.1109/GTDAsia.2019.8716015.
2. Adriana Marcela Quintero, Cristian Camilo Mendoza, Francisco Santamaría, Jorge Alexander Alarcon. (2018). Dynamic consumption representation of electric vehicles based on battery capacity. DYNA, 85(204), p.177. https://doi.org/10.15446/dyna.v85n204.59459.
Dimensions
PlumX
Article abstract page views
Downloads


License
Copyright (c) 2015 Luis Fernando Rodríguez-García, Sandra Milena Pérez-Londoño, Juan José Mora-Flórez

This work is licensed under a Creative Commons Attribution 4.0 International License.
The authors or holders of the copyright for each article hereby confer exclusive, limited and free authorization on the Universidad Nacional de Colombia's journal Ingeniería e Investigación concerning the aforementioned article which, once it has been evaluated and approved, will be submitted for publication, in line with the following items:
1. The version which has been corrected according to the evaluators' suggestions will be remitted and it will be made clear whether the aforementioned article is an unedited document regarding which the rights to be authorized are held and total responsibility will be assumed by the authors for the content of the work being submitted to Ingeniería e Investigación, the Universidad Nacional de Colombia and third-parties;
2. The authorization conferred on the journal will come into force from the date on which it is included in the respective volume and issue of Ingeniería e Investigación in the Open Journal Systems and on the journal's main page (https://revistas.unal.edu.co/index.php/ingeinv), as well as in different databases and indices in which the publication is indexed;
3. The authors authorize the Universidad Nacional de Colombia's journal Ingeniería e Investigación to publish the document in whatever required format (printed, digital, electronic or whatsoever known or yet to be discovered form) and authorize Ingeniería e Investigación to include the work in any indices and/or search engines deemed necessary for promoting its diffusion;
4. The authors accept that such authorization is given free of charge and they, therefore, waive any right to receive remuneration from the publication, distribution, public communication and any use whatsoever referred to in the terms of this authorization.