Publicado
Discriminatory accuracy of serological tests for detecting Trypanosoma cruzi using the ROC curve and the standard methodology
Precisión discriminatoria de pruebas serológicas para Trypanosoma cruzi aplicando metodología estándar y de curva COR
DOI:
https://doi.org/10.15446/revfacmed.v68n1.71092Palabras clave:
Trypanosoma cruzi, Serology, ROC Curve, Sensitivity and Specificity (en)Trypanosoma cruzi, Serología, Curva ROC, Sensibilidad y especificidad (es)
Descargas
Introduction: Serological tests are used to confirm Trypanosoma cruzi infection and their discriminatory accuracy depends on the established decision threshold. Both, the standard methodology and the receiver operating characteristic (ROC) curve methodology allow obtaining such threshold.
Objective: To compare the discriminatory accuracy of the standard methodology and the ROC curve methodology regarding serological tests for confirming T. cruzi infection.
Materials and methods: A set of anti-T. cruzi antibodies values from subjects previously classified as healthy or as having Chagas disease were used, and computer simulations were performed under homoscedasticity and heteroscedasticity conditions. Sensitivity, specificity, 100% sensitivity, 100% specificity, and perfect-decision were calculated.
Results: The discriminatory accuracy obtained with the standard methodology favored specificity (98.22% to 99.56%) over sensitivity (67.25% to 87.14%), while in the ROC curve methodology a balance between sensitivity (94.56% and 96.44%) and specificity (90.35% and 92.11%) was observed. Also, in the ROC curve methodology a greater perfect-decision ratio was observed, which, under homoscedasticity conditions, was >90%. Decisions thresholds were affected by heteroscedasticity conditions.
Conclusion: The ROC curve methodology showed better discriminatory accuracy, therefore its use for calculating decision thresholds in serological tests for detecting Chagas disease is recommended.
Introducción. Las pruebas serológicas se utilizan para detectar infección por Trypanosoma cruzi y su precisión discriminatoria depende del umbral de decisión establecido. La metodología estándar y la de curva característica operativa del receptor (COR) permiten obtener tal umbral.
Objetivo. Comparar la precisión discriminatoria de la metodología estándar y la metodología de curva COR en lo que respecta a pruebas serológicas para detectar infección por T. cruzi.
Materiales y métodos. Se utilizó un conjunto de valores de anticuerpos contra T. cruzi de individuos clasificados como chagásicos o sanos y se realizaron simulaciones computarizadas en condiciones homocedásticas y heterocedásticas. Se calculó sensibilidad, especificidad, sensibilidad=100%, especificidad=100% y decisión-perfecta.
Resultados. La precisión discriminatoria de la metodología estándar favoreció la especificidad (98.22% a 99.56%) sobre la sensibilidad (67.25% a 87.14%), mientras que la de la curva COR mostró un equilibrio entre sensibilidad (94.56% y 96.44%) y especificidad (90.35% y 92.11%). Esta última metodología también evidenció una mayor proporción de decisión-perfecta, la cual llegó a ser >90% en condiciones de homocedasticidad. Los umbrales de decisión fueron afectados por las condiciones de heterocedasticidad.
Conclusión. La metodología de la curva COR mostró una mejor precisión discriminatoria, por lo que se recomienda su uso para el cálculo de umbrales de decisión en pruebas serológicas para la enfermedad de Chagas.
ORIGINAL RESEARCH
DOI: https://doi.org/10.15446/revfacmed.v68n1.71092
Received: 18/03/2018 Accepted: 27/06/2018
Discriminatory accuracy of serological tests for detecting Trypanosoma cruzi using the ROC curve and the standard methodology
Precisión discriminatoria de pruebas serológicas para Trypanosoma cruzi aplicando metodología estándar y de curva COR
Marvin Querales1,2, Ana Rita De Lima2,3, Harú Martínez-de Cordero4, Domenica Carolina Cannova5, María Isabel Simons5, Luis Pérez-Ybarra6
1 Universidad de Carabobo - Faculty of Health Sciences - School of Biomedical and Technological Sciences - Department of Biochemistry - Valencia - Venezuela.
2 Universidad de Carabobo - Faculty of Health Sciences - Instituto de Biología Molecular de Parásitos (BioMolP) - Protozoology Laboratory - Valencia - Venezuela.
3 Universidad de Carabobo - Faculty of Health Sciences - Bioanalysis School - Department of Morphophysiology - Valencia - Venezuela.
4 Universidad Central de Venezuela - Faculty of Agronomy - Department of Agricultural Engineering - Maracay - Venezuela.
5 Universidad de Carabobo - Faculty of Health Sciences - School of Biomedical and Technological Sciences - Department of Parasitology - Leishmaniasis and Entomology Laboratory - Valencia - Venezuela.
6 Universidad de Carabobo - Faculty of Health Sciences - School of Bioanalysis - Department of Basic Sciences - Maracay - Venezuela.
Corresponding author: Luis Pérez-Ybarra. Departamento de Ciencias Básicas, Escuela de Bioanálisis, Facultad de Ciencias de la Salud, Universidad de Carabobo. Campus La Morita, Núcleo Aragua, módulo A. Telephone number: +58 241 6004000, ext.: 404241. Maracay. Venezuela. Email: lmpy2005@gmail.com.
Abstract
Introduction: Serological tests are used to confirm Trypanosoma cruzi infection and their discriminatory accuracy depends on the established decision threshold. Both, the standard methodology and the receiver operating characteristic (ROC) curve methodology allow obtaining such threshold.
Objective: To compare the discriminatory accuracy of the standard methodology and the ROC curve methodology regarding serological tests for confirming T. cruzi infection.
Materials and methods: A set of anti-T. cruzi antibodies values from subjects previously classified as healthy or as having Chagas disease were used, and computer simulations were performed under homoscedasticity and heteroscedasticity conditions. Sensitivity, specificity, 100% sensitivity, 100% specificity, and perfect-decision were calculated.
Results: The discriminatory accuracy obtained with the standard methodology favored specificity (98.22% to 99.56%) over sensitivity (67.25% to 87.14%), while in the ROC curve methodology a balance between sensitivity (94.56% and 96.44%) and specificity (90.35% and 92.11%) was observed. Also, in the ROC curve methodology a greater perfect-decision ratio was observed, which, under homoscedasticity conditions, was >90%. Decisions thresholds were affected by heteroscedasticity conditions.
Conclusion: The ROC curve methodology showed better discriminatory accuracy, therefore its use for calculating decision thresholds in serological tests for detecting Chagas disease is recommended.
Keywords: Trypanosoma cruzi; Serology; ROC Curve; Sensitivity and Specificity (MeSH).
Querales M, De Lima AR, Martínez-de Cordero H, Cannova DC, Simons MI, Pérez-Ybarra L. Discriminatory accuracy of serological tests for detecting Trypanosoma cruzi using the ROC curve and the standard methodology. Rev. Fac. Med. 2020;68(1):107-16. English. doi: https://doi.org/10.15446/revfacmed.v68n1.71092.
Resumen
Introducción. Las pruebas serológicas se utilizan para detectar infección por Trypanosoma cruzi y su precisión discriminatoria depende del umbral de decisión establecido. La metodología estándar y la de curva característica operativa del receptor (COR) permiten obtener tal umbral.
Objetivo. Comparar la precisión discriminatoria de la metodología estándar y la metodología de curva COR en lo que respecta a pruebas serológicas para detectar infección por T. cruzi.
Materiales y métodos. Se utilizó un conjunto de valores de anticuerpos contra T. cruzi de individuos clasificados como chagásicos o sanos y se realizaron simulaciones computarizadas en condiciones homocedásticas y heterocedásticas. Se calculó sensibilidad, especificidad, sensibilidad=100%, especificidad=100% y decisión-perfecta.
Resultados. La precisión discriminatoria de la metodología estándar favoreció la especificidad (98.22% a 99.56%) sobre la sensibilidad (67.25% a 87.14%), mientras que la de la curva COR mostró un equilibrio entre sensibilidad (94.56% y 96.44%) y especificidad (90.35% y 92.11%). Esta última metodología también evidenció una mayor proporción de decisión-perfecta, la cual llegó a ser >90% en condiciones de homocedasticidad. Los umbrales de decisión fueron afectados por las condiciones de heterocedasticidad.
Conclusión. La metodología de la curva COR mostró una mejor precisión discriminatoria, por lo que se recomienda su uso para el cálculo de umbrales de decisión en pruebas serológicas para la enfermedad de Chagas.
Palabras clave: Trypanosoma cruzi; Serología; Curva ROC; Sensibilidad y especificidad (DeCS).
Querales M, De Lima AR, Martínez-de Cordero H, Cannova DC, Simons MI, Pérez-Ybarra L. [Precisión discriminatoria de pruebas serológicas para Trypanosoma cruzi aplicando metodología estándar y de curva COR]. Rev. Fac. Med. 2020;68(1):107-16. English. doi: https://doi.org/10.15446/revfacmed.v68n1.71092.
Introduction
Chagas disease is diagnosed using parasitological and serological methods. Parasitological methods, such as blood smear, peripheral blood smear and thick blood smear, are utilized during the acute phase, since there is a high level of parasitemia. In the chronic phase, because parasitemia is low and intermittent, serological tests such as indirect hemagglutination, indirect immunofluorescence (IFA), ELISA tests, Machado-Guerreiro reaction and Western Blot are preferred.
Although serological tests are highly sensitive, cross-reactions may occur with other parasites such as Trypanosoma rangeli and Leishmania spp. Consequently, diagnosing a patient with Chagas disease requires positivity for this condition on 2 out of 3 serological tests.1
The ELISA test is widely used because of its high sensitivity and good specificity depending on the antigen used.2 This is a semi-quantitative technique that establishes a relative antibody concentration depending on the higher dilution of the patient’s serum, which allows detecting the formation of immune complexes; in other words, a cut-off point or decision threshold is chosen. Results above this threshold are considered positive, while those below are considered negative.3 However, this classification has a margin of error due to the sensitivity and specificity of the test since their values depend on the level chosen as a threshold.4
The traditional or standard method to establish a decision threshold consists of setting it at 2 or 3 standard deviations away from the mean of a group of patients classified as negative for a given condition or disease under the assumption of independence;5-7 however, this method is arbitrary and inappropriate when the assumption is violated.8 A variant of this methodology is to use the trimmed mean and 2 or 3 trimmed standard deviations, which are estimated by eliminating 5% of the extreme values, both upper and lower, from the data set of negative patients.9
Another methodology used to determine the threshold is the receiver operating characteristic (ROC) curve, which is widely accepted to select an optimal cut-off point for a serological test.10,11 The curve is generated by plotting the sensitivity values for the potential test cut-off points on the y-axis as a function of the 1-specificity value on the x-axis;10 the best cut-point provides the highest sensitivity and specificity simultaneously.12 Both the ROC curve and the standard methodology have advantages when establishing decision thresholds,10,12 therefore they are used interchangeably.
In this sense, the objectives of the present work were to compare the standard and the ROC curve methodologies and to determine which yields better results in the serological diagnosis of Chagasic patients. The starting point was the results of serological tests and computer-simulated samples, taking into account the influence of population variances on their efficiency.
Materials and methods
Real data populations
IgG antibody titers against T. cruzi measured in terms of optical density (OD) were considered as real data populations. These data were obtained from the archive of samples processed between 1992 and 2014 by the Instituto de Biología Molecular de Parásitos (Institute of Molecular Biology of Parasites, BioMolP by its acronym in Spanish) and the Department of Parasitology of the Universidad de Carabobo, Valencia-Venezuela. Based on these records, mean (μ) and variance (σ2) were estimated for the results of both healthy individuals, μS and σ25, and Chagasic patients, μE and σ2E.
Healthy individuals
This sample was made up of the OD values obtained from the sera of individuals from non-endemic areas for Chagas disease with negative IFA, ELISA, and Western Blot tests.
Chagas patients
This sample was made up of the OD values obtained from the sera of Chagasic patients from the endemic states of Carabobo and Cojedes, Venezuela, with positive results in at least 2 of the 3 tests mentioned above.13-15
Ethical considerations
Both healthy individuals and Chagasic patients gave their informed consent to take part in epidemiological studies on T. cruzi. The ethical principles for medical research involving human subjects set out in the Declaration of Helsinki were respected.16 This research was endorsed by the Bioethics Commission of the Faculty of Health Sciences, chaired by the Directorate of Research and Intellectual Production of the Faculty of Health Sciences of the Universidad de Carabobo, which guaranteed that the bioethics and biosafety principles were applied as stated in Minutes D1-058-11 of March 14, 2011.
Enzyme-linked immunoassay
The total proteins of T. cruzi epimastigotes of human origin were used as the antigen, which was identified using the discrete typing unit (DTU) named TcI based on the methodology outlined by De Lima et al.15 The TcI DTU was selected because it is the most common in Venezuela, representing about 95% of the isolates.17-19
Simulated samples
The simulated data were obtained using the add-in for producing random numbers from a normal or Gaussian distribution of the Microsoft Excel program.20 On the other hand, the population parameters values used to generate the simulated samples were obtained from the characterization of the real data populations described above.
A population of healthy individuals (PS) was defined using mean (μS) and variance (σ25), as well as 3 sets of 5 populations of Chagasic patients (PE): 1 set with the same variance of the population of healthy individuals (homoscedastic) and 2 sets with population variances different from that of the population of healthy individuals (heteroscedastic), for a total of 16 simulated populations.
As mentioned above, the variance in the homoscedastic set corresponded to that of the real data population of healthy individuals (σ25). Regarding heteroscedastic sets, in the first case, the variance was obtained in the population from real data of Chagasic patients (σ2E), while, for the second, the pooled or weighted variance (σ2c) was calculated with the population variances of healthy individuals and Chagasic patients.
The means of the simulated populations of Chagasic patients were defined as a function of the mean of healthy individuals (μS) and the pooled standard deviation (σc). Thus, the mean values for Chagasic patients were defined by PE1: μE1= μS+0.5 σc; PE2: μE2= μS+ σc; PE3: μE3= μS+2σc; PE4:μE4=μS+3σc y PE5: μE5= μS+4σc, to build up populations of Chagasic patients with means increasingly distant from those of the healthy
233were generated for the population PS and for each population PE. Each one consisted of nS simulated observations coming from PS, and of nE simulated observations coming from PEi, i=1,2, ..., 5. The size of nS and nE was set at nS= nE=30, because this is the most widely used sample size in practice (Table 1).
Table 1. Population parameters and variance conditions.
|
Population |
Equal variance assumption |
|||||
|
Homoscedasticity |
Heteroscedasticity-1 |
Heteroscedasticity-2 |
||||
|
Mean |
Variance |
Mean |
Variance |
Mean |
Variance |
|
|
Healthy |
μS |
σ25 |
μS |
σ25 |
μS |
σ25 |
|
Chagas-1 |
μS +0.5σc |
σ25 |
μS +0.5σc |
σ2E |
μS +0.5σc |
σ2c |
|
Chagas-2 |
μS + σc |
μS + σc |
μS + σc |
|||
|
Chagas-3 |
μS +2σc |
μS +2σc |
μS +2σc |
|||
|
Chagas-4 |
μS +3σc |
μS +3σc |
μS +3σc |
|||
|
Chagas-5 |
μS +4σc |
μS +4σc |
μS +4σc |
|||
Source: Own elaboration.
The set of results of healthy individuals and Chagasic patients was named scenario, and 5 scenarios were constructed for each of the variance assumptions: i=1,2, ..., 5. Scenario-1: {PS, PE1}, Scenario-2: {PS, PE2}, Scenario-3: {PS, PE3}, Scenario-4: {PS, PE4} and Scenario-5: {PS, PE5}. In this way, 15 scenarios with simulated data were obtained.
These scenarios are fundamental to simulation since the sensitivity and specificity of the tests require information from healthy and Chagasic individuals on the ROC curve. The samples of healthy individuals were the same in each simulated scenario; only the simulated samples for the Chagasic patients varied, so this method allows maintaining the same point of comparison between Chagasic patients and healthy individuals.
Decision thresholds
The standard and ROC curve methodologies were applied to obtain the decision thresholds or critical values (VC) for the real data and the simulated samples; the calculations were made using a routine written in Excel. For the standard methodology (Std), four VC were established: StdM1=μ+2σ, StdM2, μ+3σ, StdM3 = μ*+2σ* and StdM4=μ*+3σ*, where μ* and σ* are the trimmed arithmetic mean and the trimmed standard deviation, respectively.
The VC of ROC curves were estimated using the minimum quadratic distance (MQD) and the Youden Index (IY). For MQD, VC is min(MQD)=min{(1-sensitivity)2+(1-specifity)2}, and for IY, VC is max (IY )=max{sensitivity+specifity-1}.21,22
Sensitivity and specificity
For the real data and the simulated scenarios, a k-th observation (yK) was deemed healthy if yK≤ Vpc and sick if , where Vpc is the decision threshold of the p test. For the simulated samples, the k-th observation yijk and the decision threshold Vicjp depended on the i scenario and the simulated sample j; i=1,2,…,5; j=1,2,…,n*.
Sensitivity and specificity of a test were given by:

True positives are Chagasic patients declared positive through p test, while true negatives are healthy individuals declared negative through this same test.
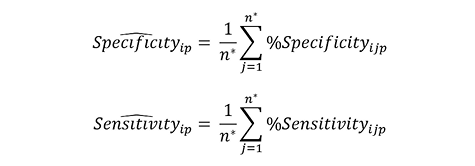
The sensitivity and specificity of the methodologies applied in the simulated populations were compared based on the estimates given by
Comparison of discriminatory accuracy
of applied methodologies]
To compare discriminatory accuracy, it was established how many samples of the tests had sensitivity and specificity equal to 100%. Thus, for scenario i and test p, it was obtained:
Healthy individuals:
Chagasic patients:

The proportions of samples with specificity and sensitivity equal to 100% were given by:

Similarly, the number of samples in which the tests had sensitivity and specificity equal to 100% was determined. This result was named perfect-decision and was obtained with the equations

The proportions of samples with perfect-decision were given by

Results
Real data
The population of healthy individuals was NS=901 with the parameters μS=0.12226 and σ2=0.0531. On the other hand, the Chagasic patients were NE=342 with the parameters μE=0.4093 and σE=0.2234. The pooled standard deviation of both populations was σC=0.1255 The parameters were measured using the OD, and the absolute frequency distributions showed an overlapping response region for the OD of the 2 groups, with a total of 589 data (47.39%) (Figure 1).

Figure 1. Optical density result of the test for immunoglobulin G against Trypanosoma cruzi.
Source: Own elaboration.
The thresholds of Vc for the ROC curve method were similar to each other and lower than all those of the standard
method (IY=0.186, MQD=0.182, StdM1=0.229, StdM2=0.282, StdM3=0.194 and StdM4=0.230). Likewise, in the ROC curve, these values were located towards the center of the region of overlapping results, while they tended to be located towards the right in the standard method, favoring the specificity of the test. Sensitivity and specificity values were more balanced for the ROC curve methodology (sensitivity: 96%, specificity: 92%) than for the standard methodology (sensitivity: 67-87%, specificity: 99%). For the standard methodology, the most balanced equation was StdM3 with sensitivity of 87% and specificity of 98%.
Simulated samples
The mean of the population of healthy individuals was set at μS=0.1226 and the variance for the condition of homoscedasticity was σ25 =(0.0531)2. Under heteroscedastic conditions, the variance for healthy observations was σ25 =(0.0531)2, while two values were considered for Chagasic populations: the variance of real data for Chagasic patients (heteroscedasticity-1), σ2E1≡σ2E=(0.2234)2, and the pooled variance for groups of healthy and Chagasic individuals (heteroscedasticity-2), σ2E2≡σ2C=(0.1255)2. The population means for Chagasic patients were established at PE1: μE1=0.18535 ; PE2: μE2=0.2481 ; PE3: μE3= 0.3736 ; PE4: μE4= 0.4991 ; PE5: μE5=0.6246. As for real data, all these parameters correspond to OD readings.
Decision thresholds
The mean values obtained for Vc in the standard tests showed a fixed value for all three variance assumptions since they only depend on the population of healthy individuals. On the other hand, StdM2 and StdM4 showed the highest Vc, while those obtained with StdM3 were very close to those of the ROC curve in the second and third scenarios (Table 2).
Table 2. Decision thresholds for the detection of immunoglobulin G against Trypanosoma cruzi. Simulated data.
|
Equal variance assumption |
Methodology |
Scenario |
||||
|
1 |
2 |
3 |
4 |
5 |
||
|
Homoscedasticity |
IY |
0.1492 |
0.1804 |
0.2238 |
0.23 |
0.2301 |
|
MQD |
0.1526 |
0.1819 |
0.2238 |
0.23 |
0.2301 |
|
|
StdM1 |
0.2273 |
0.2273 |
0.2273 |
0.2273 |
0.2273 |
|
|
StdM2 |
0.2796 |
0.2796 |
0.2796 |
0.2796 |
0.2796 |
|
|
StdM3 |
0.1953 |
0.1953 |
0.1953 |
0.1953 |
0.1953 |
|
|
StdM4 |
0.2316 |
0.2316 |
0.2316 |
0.2316 |
0.2316 |
|
|
Heteroscedasticity-1 |
IY |
0.1994 |
0.2006 |
0.2057 |
0.2143 |
0.2223 |
|
MQD |
0.1719 |
0.1768 |
0.1925 |
0.2093 |
0.2215 |
|
|
StdM1 |
0.2273 |
0.2273 |
0.2273 |
0.2273 |
0.2273 |
|
|
StdM2 |
0.2796 |
0.2796 |
0.2796 |
0.2796 |
0.2796 |
|
|
StdM3 |
0.1953 |
0.1953 |
0.1953 |
0.1953 |
0.1953 |
|
|
StdM4 |
0.2316 |
0.2316 |
0.2316 |
0.2316 |
0.2316 |
|
|
Heteroscedasticity-2 |
IY |
0.1822 |
0.1865 |
0.2059 |
0.2226 |
0.2293 |
|
MQD |
0.1608 |
0.1739 |
0.2022 |
0.2227 |
0.2293 |
|
|
StdM1 |
0.2273 |
0.2273 |
0.2273 |
0.2273 |
0.2273 |
|
|
StdM2 |
0.2796 |
0.2796 |
0.2796 |
0.2796 |
0.2796 |
|
|
StdM3 |
0.1953 |
0.1953 |
0.1953 |
0.1953 |
0.1953 |
|
|
StdM4 |
0.2316 |
0.2316 |
0.2316 |
0.2316 |
0.2316 |
|
IY: Youden index; MQD: minimum quadratic distance; StdM1: standard methodology 1; StdM2: standard methodology 2; StdM3: standard methodology 3; StdM4: standard methodology 4.
Source: Own elaboration.
The ROC curve methodologies showed Vc with little difference between them, which decreased when the mean of the Chagasic patients group moved away from the mean of healthy individuals and was higher under heteroscedasticity conditions. Likewise, Vc increased as a function of the mean of the Chagasic patients group (Table 2).
Discriminatory accuracy
Sensitivity and specificity
Homoscedasticity: For standard methodologies, specificity means were higher using StdM2, followed by StdM4 and Std1; StdM3 showed the lowest mean value. In addition, all estimators of this methodology revealed specificity values >90%. For ROC methodologies, IY and MQD showed similar specificity with a minimum of about 75% that increased as the average Chagasic patient population moved away from the mean of healthy individuals (Figure 2A).
Sensitivity in all scenarios was higher in IY and MQD, ranging from 75% to 100%. Regarding standard methodologies, StdM3 showed the best behavior with 42% sensitivity in scenario-1, while StdM2 showed the lowest value with sensitivity of 5.21% in the same scenario (Figure 2B).
Heteroscedasticity-1: For specificity, both methodologies showed high values in all scenarios; the highest mean value was observed in StdM2 (approximately 100%), followed by StdM4 and StdM1 (values around 98%). For the ROC curve methodologies, heteroscedasticity affected MQD more than IY —the latter with 95% in scenario-1 and 99% in scenario-5. However, both showed a progressive increase according to the mean values of the Chagasic patient populations (Figure 2C).
For sensitivity, although the best behavior was obtained by MQD with a minimum value of 55% in scenario-1 and 97% in scenario-5, IY had a similar behavior. As for the standard methodology, StdM3 provided better sensitivity values and the mean values were similar to those of IY. The standard methodology that showed the lowest sensitivity values was StdM2, reaching values above 60% only from scenario-4 (Figure 2D).
Heteroscedasticity-2: The mean specificity values were higher using the methodologies for StdM2 (99.95%), StdM1 and StdM4 (98% each). On the other hand, StdM3 caused a decrease in specificity by reaching an average of 92%. For the ROC methodologies, the IY had a better behavior than MQD (Figure 2E).
The best sensitivity values were observed with MQD, followed by IY and StdM3; the values were equal to MQD from scenario-3 onwards. The methodology that yielded the lowest mean sensitivity values was StdM2 (Figure 2F).
Sensitivity=100% and specificity=100
Homoscedasticity: StdM2 showed specificity=100% in almost all the simulated samples, followed by StdM4 and StdM1 with percentages around 50%. StdM3 showed specificity=100% in only 5% of cases. In the ROC curve methodologies, both showed a similar behavior, going from a low frequency of specificity=100% in the first two scenarios to a high percentage from scenario-3 onwards (87%) (Figure 3A).

Figure 2. Specificity and sensitivity value estimators
StdM1=μ+2σ; StdM2=μ+3σ; StdM3=μ*+2σ*; StdM4=μ*+3σ*; MQD: minimum quadratic distance.
Source: Own elaboration.
All methodologies showed low frequency sensitivity=100% in the first 2 scenarios; however, the percentages shown by IY and MQD were higher than the others. Similarly, all methodologies showed a notable increase in sensitivity=100% from scenario-3 onwards, except StdM2, with higher IY and StdM3 values (95%) (Figure 3B).
Heteroscedasticity-1: The methodology that had the highest frequency of specificity=100% was StdM2 with 98.6%; the others showed percentages ≤55% and the lowest value was observed in StdM3 with 5%. Both ROC curve methodologies showed a progressive increase but IY was less affected than MQD by heteroscedasticity (Figure 3C).
All methodologies obtained low percentages of sensitivity=100% until scenario-4 and ≤50% in scenario-5. In the latter, the methodology that yielded the highest value was StdM3 (39.7%), followed by the ROC curve methodologies (35%); the one with the lowest value was StdM2 (Figure 3D).
Heteroscedasticity-2: The standard methodology with the highest accuracy for specificity=100% was StdM2 (98.6%); the others showed an accuracy ≤55%. Of the ROC curve methodologies, IY showed the best performance, although it presented low frequencies in the first 3 scenarios (42% maximum) and increased from scenario-4 onwards (Figure 3E).
With the exception of StdM2, the applied methodologies obtained values >10% sensitivity=100% from scenario-3 onwards, reaching a high percentage in scenario-5. IY, MQD and StdM3 showed the best behavior; the latter had the highest values (Figure 3F).

Figure 3. Estimators of specificity=100% and sensitivity=100% rates.
StdM1=μ+2σ; StdM2=μ+3σ; StdM3=μ*+2σ*; StdM4=μ*+3σ*; MQD: minimum quadratic distance.
Source: Own elaboration.
Perfect-decision
Homoscedasticity: In the first 2 scenarios, no methodology yielded perfect-decision values, and the ROC curve methodologies showed the highest percentages from scenario-3 onwards; both IY and MQD showed the same values (between 83% and 99%). As for standard methodologies, only StdM2 showed similar values from scenario-4 onwards; the others reached a maximum of 55% decision-perfect (Figure 4A).
Heteroscedasticity-1: From scenario-4 onwards, perfect decisions began to be observed. The highest percentages corresponded to IY and MQD (28%), which also showed twice the value of the methodologies StdM1 and StdM4. In addition, few cases were observed with StdM3 (2%) (Figure 4B).
Heteroscedasticity-2: Perfect-decisions could be seen from scenario-3 onwards. The highest percentages corresponded to the ROC curve methodologies (figures between 60% and 96% without distinction between IY and MQD). Of the standard methodologies, only StdM2 reached figures >80%, while the lowest values were obtained by StdM3 (Figure 4C).

Figure 4. Decision-perfect ratio estimators
StdM1=μ+2σ; StdM2=μ+3σ; StdM3=μ*+2σ*; StdM4=μ*+3σ*; MQD: minimum quadratic distance.
Source: Own elaboration.
Discussion
The ELISA cut-off points obtained through the ROC curve methodology showed a better discriminatory accuracy for T. cruzi serology than the standard methodology. Although it is not appropriate to diagnose a patient as Chagasic based on a single serological test, it is known that, from the three techniques recommended by the World Health Organization, the ELISA test is the most used for an initial approach, especially in epidemiological studies that evaluate a large number of patients.1
The discriminatory accuracy of a diagnostic test depends on its sensitivity and specificity. These values are mainly obtained due to the overlapping of the results of healthy and sick individuals.10,23 In the present study, such OD overlapping region is observed in healthy individuals and Chagasic patients regarding real data, which evidences that this behavior is associated with the accuracy of the results in serological tests.
For Vc, the standard methodology tended towards high values, which deviated the balance from discriminatory accuracy to specificity, reaching 100% in many cases. This significantly affects sensitivity, as only patients with the most evident immune response will be diagnosed as positive. On the other hand, the Vc obtained using the ROC curve methodology, both for IY and MQD, generated more balanced sensitivity and specificity values, often at around 90%. This discrepancy in the decision thresholds is explained because the standard methodology, unlike the ROC curve methodology, does not consider the two populations under study to estimate the cut-off point. Therefore, the ROC curve, besides generating greater discriminatory accuracy, provides greater confidence to the analyst.23
Barajas-Rojas et al.24 show that the application of StdM1 leads to a specificity value of about 97.5%. Greiner & Böhning25 state that this method does not consider sensitivity, therefore it does not reflect the main function of a decision threshold, i.e., it does not differentiate subpopulations of infected individuals from those not infected. This is highly relevant since a test with low sensitivity generates a large number of false negative results.
In this regard, Sharma & Jain26 report that the standard method tends to generate false negative results, especially in cases where 1) positive patients are receiving medical treatment, 2) antibody or antigen titers are not high enough, or 3) at the onset of infection. In this context, false negatives are a significant issue for the diagnosis of serious diseases, as misdiagnosed patients will not receive the necessary treatment, especially in the initial stages of the disease.27
Other studies have reported satisfactory results using the ROC curve methodology and are in line with this study. Fernández-López et al.28 evaluated procalcitonin as a marker for diagnosing invasive bacterial infection in febrile infants and obtained sensitivity of 95.5% and specificity of 84.6%, while Pérez et al.29 studied body mass index as an estimator of overweight and fat distribution in Venezuelan children and adolescents, finding sensitivity between 86% and 100% and specificity between 92% and 100% for different age groups.
Regarding the ROC curve methodologies evaluated, IY was less affected than MQD by heteroscedasticity, which coincides with studies reporting inconsistency in the decision threshold obtained by both methods.21,22 Although both techniques give equal weight to sensitivity and specificity values, some authors recommend using IY because it reflects the intention to maximize the percentage of correct classification of healthy and sick patients.21,22
During the validation process of a diagnostic test, a correct classification of patients based on their actual health condition is expected.30 With this in mind, the decision-perfect percentage showed a better performance for ROC curve methodologies, as they were higher than the standard in all cases. These results support the hypothesis that, between these two methodologies, the ROC curve is the best choice for establishing decision thresholds in serological tests.
It should be noted that ROC curve methodologies identify, as was the case of this work, the decision threshold with higher joint sensitivity and specificity, which supports what is proposed by Fan et al.12 However, such a threshold does not necessarily determine the potentially higher sensitivity and specificity values for the serological test, as such extreme values usually correspond to different cut-off points, one for sensitivity and one for specificity.31 In fact, there are situations where a diagnostic test with high sensitivity or high specificity is needed; in these scenarios it is not advisable to use the decision threshold obtained by means of the ROC curve. Instead, it is appropriate to determine the specificity and sensitivity values obtained for different cut-off points and to choose the most suitable one as appropriate.32
McNicol33 points out that ROC curves constructed in the presence of heteroscedasticity show a behavior different from their homoscedastic analogues. This occurs because the former, in theory, may have up to two decision thresholds: one similar to that found in the presence of homoscedasticity —that is, located at the central interception of the noise and signal distributions— and another spurious and displaced towards the end of the noise or signal distribution, depending on whether the distribution with the greatest variance is of the signal or of the noise distribution, respectively.
Although no spurious thresholds were identified in the present work, it was observed that sensitivity and specificity were affected by heteroscedasticity in the ROC curve methodologies. On the other hand, in the case of the traditional method, heteroscedasticity did influence sensitivity, but not specificity. Thus, in Figures 2, 3 and 4 it was observed that when the variance of the Chagasic patient population is greater, its influence is also greater, and that the heterocedasticity-1 assumption (greater variance) was the one that showed the worst behavior of all the methodologies. Furthermore, it was found that in ROC curve methodologies, IY was less affected than MQD by heteroscedasticity, which is another reason for preferring the former.
Conclusion
Bearing in mind the specific conditions of this work, the ROC curve methodology had a better discriminatory accuracy than the standard methodology in the serological testing for T. cruzi. Therefore, the use of the ROC curve methodology is recommended to establish the decision thresholds since it has a better performance, considering that the averages of the Chagasic patient populations move away from those of healthy individuals.
Conflicts of interest
None stated by the authors.
Funding
This research was supported by the Universidad de Carabobo through the project CDCH 2014-003.
Acknowledgements
To Professors Carlos Espino, William Quintana, José Luis Duque, Clara Nancy Gutiérrez, Wilfre Machado, Judith García, Mairett Rodríguez and Jorge Flores, for their valuable comments and suggestions.
References
- World Health Organization (WHO). Control of Chagas disease: second report of the WHO Expert Committee. Geneva: WHO technical report series 905; 2002.
- Brasil PE, De Castro L, Hasslocher-Moreno AM, Sangenis LH, Braga JU. ELISA versus PCR for diagnosis of chronic Chagas disease: systematic review and meta-analysis. BMC Infect Dis. 2010;10:337. http://doi.org/br9pzq.
- López-Ratón M, Rodríguez-Álvarez MX, Cadarso-Suárez C, Gude-Sampedro F. OptimalCutpoints: An R package for selecting optimal cutpoints in diagnostic test. J Stat Softw. 2014;61(8):1-36. http://doi.org/c75c.
- Akobeng AK. Understanding diagnostic tests 3: receiver operating characteristic curves. Acta Pædiatric. 2007;96(5):644-7. http://doi.org/bkzzp7.
- Rha SY, Yang WI, Gong SJ, Kim JJ, Yoo NC, Roh JK, et al. Correlation of tissue and blood plasminogen activation system in breast cancer. Cancer Lett. 2000;150(2):137-45. http://doi.org/dkxqsj.
- Classen DC, Morningstar JM, Shanley JD. Detection of antibody to murine cytomegalovirus by enzyme-linked immunosorbent and indirect immunofluorescence assays. J Clin Microbiol. 1987 [cited 2019 Aug 23];25(4):600-4. Available from: https://bit.ly/2XYjjQk.
- Lardeux F, Torrico G, Aliaga C. Calculation of the ELISA’s cut-off based on the change-point analysis method for detection of Trypanosoma cruzi infection in Bolivian dogs in the absence of controls. Mem Inst Oswaldo Cruz. 2016;111(8):501-4. http://doi.org/f8w95g.
- Ridge SE, Vizard AL. Determination of the optimal cutoff value for a serological assay: an example using the Johne’s Absorbed EIA. J Clin Microbiol. 1993;31(5):1256-61.
- Wilcox RR. Trimmed means. In: Balakrishnan N, Colton T, Everitt B, Piegorsch W, Ruggeri F, Teugels JL, editors. Wiley StatsRef: Statistics Reference Online. Wiley; 2014. http://doi.org/c75d.
- Hajian-Tilaki K. Receiver operating characteristic (ROC) curve analysis for medical diagnostic test evaluation. Caspian J Intern Med. 2013 [cited 2019 Aug 23];4(2):627-35. Available from: https://bit.ly/2LK4nPn.
- Obuchowski NA, Lieber ML, Wians FH. ROC Curves in clinical chemistry: uses, misuses, and possible solutions. Clin Chem. 2004;50(7):1118-25. http://doi.org/bmzvpp.
- Fan J, Upadhye S, Worster A. Understanding receiver operating characteristic (ROC) curves. CJEM. 2006;8(1):19-20. http://doi.org/c75f.
- De Lima AR, Farías MN, Tortolero E, Navarro MC, Contreras VT. Purificación parcial y empleo de fracciones glicosídicas de Trypanosoma cruzi en el diagnóstico de la enfermedad de Chagas. Acta Cient Ven. 2001;52(4):235-47.
- De Lima AR, Arévalo P, Bastidas V, Bolívar ML, Navarro MC, Contreras VT. Efecto de las condiciones de mantenimiento de Trypanosoma cruzi sobre la calidad de los antígenos para el diagnóstico serológico de la enfermedad de Chagas. Salus. 2007;11(Supl 1):20-6.
- De Lima A, Castro V, Querales M, Leal U, Contreras V, Graterol D, et al. Seroprevalencia de la infección por Trypanosoma cruzi en el Municipio San Diego. Estado Carabobo. Venezuela. Avan Cienc Salud. 2012 [cited 2019 Aug 23];1(2):40-5. Available from: https://bit.ly/2JujRFK.
- World Medical Association (WMA). WMA Declaration of Helsinki – Ethical principles for medical research involving human subjects. Fortaleza: 64th WMA General Assembly; 2013 [cited 2019 Aug 14]. Available from: https://bit.ly/2rJdF3M.
- Rivera MG, Herrera L, Morocoima A, Aguilar CM, Gárate T, López M, et al. Genetic variability of Trypanosoma cruzi TcI isolates from rural and urban areas of Venezuela. J Vector Borne Dis. 2015;52(1):23-9.
- Añez N, Crisante G, Añez-Rojas N, Rojas A, Moreno G, da Silva FV, et al. Genetic typing of Trypanosoma cruzi isolates from different hosts and geographical areas of western Venezuela. Bol Malariol Salud Amb. 2009;49(2):251-8.
- Carrasco HJ, Segovia M, Llewellyn MS, Morocoima A, Urdaneta-Morales S, Martínez C, et al. Geographical distribution of Trypanosoma cruzi genotypes in Venezuela. PLoS Negl Trop Dis. 2012;6(6):e1707. http://doi.org/f33d63.
- Mediaactive. Manual de Excel 2010. Barcelona, España: MARCOMBO, S.A.; 2010.
- Perkins NJ, Schisterman EF. The inconsistency of “optimal” cutpoints obtained using two criteria based on the receiver operating characteristics curve. Am J Epidemiol. 2006;163(7):670-5. http://doi.org/d8khz2.
- Fluss R, Faraggi D, Reiser B. Estimation of the Youden Index and its associated cutoff point. Biom J. 2005;47(4):458-72. http://doi.org/c5f32w.
- Worster A, Innes G, Abu-Laban RB. Diagnostic testing: an emergency medicine perspective. CJEM. 2002;4(5):348-54. http://doi.org/c75g.
- Barajas-Rojas JA, Riemann HP, Franti CE. Notes about determining the cut-off value in enzyme-linked immunosorbent assay (ELISA). Prev Vet Med. 1993;15(2-3):231-3. http://doi.org/cdv596.
- Greiner M, Böhning D. Letter to the editor: Notes about determining the cut-off value in enzyme-linked immunosorbent assay (ELISA) - Reply. Prev Vet Med. 1994;20(4):307-10. http://doi.org/dh25w3.
- Sharma B, Jain R. Right choice of a method for determination of cut-off values: A statistical tool for a diagnostic test. Asian J Med Sci. 2014;5(3):30-4. http://doi.org/c75p.
- Donis JH. Evaluación de la validez y confiabilidad de una prueba diagnóstica. Avan Biomed. 2012 [cited 2019 Aug 23];1(2):73-81. Available from: https://bit.ly/2G3Yqcn.
- Fernández-López A, Luaces-Cubells C, Valls-Tolosa C, Ortega-Rodríguez J, García-García JJ, Mira-Vallet A, et al. Procalcitonina para el diagnóstico precoz de infección bacteriana invasiva en el lactante febril. An Pediatr. 2001;55(4):321-8. http://doi.org/f2kcnv.
- Pérez BM, Landaeta-Jiménez M, Amador J, Vásquez M, Marrodán MD. Sensibilidad y especificidad de indicadores antropométricos de adiposidad y distribución de grasa en niños y adolescentes venezolanos. Interciencia. 2009;34(2):84-90.
- Smith CJ. Diagnostic tests (1) - sensitivity and specificity. Phlebology. 2012;27(5):250-1. http://doi.org/c75q.
- Cerda J, Cifuentes L. Uso de curvas ROC en investigación clínica. Aspectos teórico-prácticos. Rev Chilena Infectol. 2012;29(2):138-41. http://doi.org/c75r.
- Tarabla HD. Validación de pruebas diagnósticas. Rev FAVE Cienc Vet. 2002;1(1):37-42. http://doi.org/c75s.
- McNicol D. A primer of signal detection theory. New York: Psychology Press. New York; 2005.
Referencias
World Health Organization (WHO). Control of Chagas disease: second report of the WHO Expert Committee. Geneva: WHO technical report series 905; 2002.
Brasil PE, De Castro L, Hasslocher-Moreno AM, Sangenis LH, Braga JU. ELISA versus PCR for diagnosis of chronic Chagas disease: systematic review and meta-analysis. BMC Infect Dis. 2010;10:337. http://doi.org/br9pzq.
López-Ratón M, Rodríguez-Álvarez MX, Cadarso-Suárez C, Gude-Sampedro F. OptimalCutpoints: An R package for selecting optimal cutpoints in diagnostic test. J Stat Softw. 2014;61(8):1-36. http://doi.org/c75c.
Akobeng AK. Understanding diagnostic tests 3: receiver operating characteristic curves. Acta Pædiatric. 2007;96(5):644-7. http://doi.org/bkzzp7.
Rha SY, Yang WI, Gong SJ, Kim JJ, Yoo NC, Roh JK, et al. Correlation of tissue and blood plasminogen activation system in breast cancer. Cancer Lett. 2000;150(2):137-45. http://doi.org/dkxqsj.
Classen DC, Morningstar JM, Shanley JD. Detection of antibody to murine cytomegalovirus by enzyme-linked immunosorbent and indirect immunofluorescence assays. J Clin Microbiol. 1987 [cited 2019 Aug 23];25(4):600-4. Available from: https://bit.ly/2XYjjQk.
Lardeux F, Torrico G, Aliaga C. Calculation of the ELISA’s cut-off based on the change-point analysis method for detection of Trypanosoma cruzi infection in Bolivian dogs in the absence of controls. Mem Inst Oswaldo Cruz. 2016;111(8):501-4. http://doi.org/f8w95g.
Ridge SE, Vizard AL. Determination of the optimal cutoff value for a serological assay: an example using the Johne's Absorbed EIA. J Clin Microbiol. 1993;31(5):1256-61.
Wilcox RR. Trimmed means. In: Balakrishnan N, Colton T, Everitt B, Piegorsch W, Ruggeri F, Teugels JL, editors. Wiley StatsRef: Statistics Reference Online. Wiley; 2014. http://doi.org/c75d.
Hajian-Tilaki K. Receiver operating characteristic (ROC) curve analysis for medical diagnostic test evaluation. Caspian J Intern Med. 2013 [cited 2019 Aug 23];4(2):627-35. Available from: https://bit.ly/2LK4nPn.
Obuchowski NA, Lieber ML, Wians FH. ROC Curves in clinical chemistry: uses, misuses, and possible solutions. Clin Chem. 2004;50(7):1118-25. http://doi.org/bmzvpp.
Fan J, Upadhye S, Worster A. Understanding receiver operating characteristic (ROC) curves. CJEM. 2006;8(1):19-20. http://doi.org/c75f.
De Lima AR, Farías MN, Tortolero E, Navarro MC, Contreras VT. Purificación parcial y empleo de fracciones glicosídicas de Trypanosoma cruzi en el diagnóstico de la enfermedad de Chagas. Acta Cient Ven. 2001;52(4):235-47.
De Lima AR, Arévalo P, Bastidas V, Bolívar ML, Navarro MC, Contreras VT. Efecto de las condiciones de mantenimiento de Trypanosoma cruzi sobre la calidad de los antígenos para el diagnóstico serológico de la enfermedad de Chagas. Salus. 2007;11(Supl 1):20-6.
De Lima A, Castro V, Querales M, Leal U, Contreras V, Graterol D, et al. Seroprevalencia de la infección por Trypanosoma cruzi en el Municipio San Diego. Estado Carabobo. Venezuela. Avan Cienc Salud. 2012 [cited 2019 Aug 23];1(2):40-5. Available from: https://bit.ly/2JujRFK.
World Medical Association (WMA). WMA Declaration of Helsinki – Ethical principles for medical research involving human subjects. Fortaleza: 64th WMA General Assembly; 2013 [cited 2019 Aug 14]. Available from: https://bit.ly/2rJdF3M.
Rivera MG, Herrera L, Morocoima A, Aguilar CM, Gárate T, López M, et al. Genetic variability of Trypanosoma cruzi TcI isolates from rural and urban areas of Venezuela. J Vector Borne Dis. 2015;52(1):23-9.
Añez N, Crisante G, Añez-Rojas N, Rojas A, Moreno G, da Silva FV, et al. Genetic typing of Trypanosoma cruzi isolates from different hosts and geographical areas of western Venezuela. Bol Malariol Salud Amb. 2009;49(2):251-8.
Carrasco HJ, Segovia M, Llewellyn MS, Morocoima A, Urdaneta-Morales S, Martínez C, et al. Geographical distribution of Trypanosoma cruzi genotypes in Venezuela. PLoS Negl Trop Dis. 2012;6(6):e1707. http://doi.org/f33d63.
Mediaactive. Manual de Excel 2010. Barcelona, España: MARCOMBO, S.A.; 2010.
Perkins NJ, Schisterman EF. The inconsistency of “optimal” cutpoints obtained using two criteria based on the receiver operating characteristics curve. Am J Epidemiol. 2006;163(7):670-5. http://doi.org/d8khz2.
Fluss R, Faraggi D, Reiser B. Estimation of the Youden Index and its associated cutoff point. Biom J. 2005;47(4):458-72. http://doi.org/c5f32w.
Worster A, Innes G, Abu-Laban RB. Diagnostic testing: an emergency medicine perspective. CJEM. 2002;4(5):348-54. http://doi.org/c75g.
Barajas-Rojas JA, Riemann HP, Franti CE. Notes about determining the cut-off value in enzyme-linked immunosorbent assay (ELISA). Prev Vet Med. 1993;15(2-3):231-3. http://doi.org/cdv596.
Greiner M, Böhning D. Letter to the editor: Notes about determining the cut-off value in enzyme-linked immunosorbent assay (ELISA) - Reply. Prev Vet Med. 1994;20(4):307-10. http://doi.org/dh25w3.
Sharma B, Jain R. Right choice of a method for determination of cut-off values: A statistical tool for a diagnostic test. Asian J Med Sci. 2014;5(3):30-4. http://doi.org/c75p.
Donis JH. Evaluación de la validez y confiabilidad de una prueba diagnóstica. Avan Biomed. 2012 [cited 2019 Aug 23];1(2):73-81. Available from: https://bit.ly/2G3Yqcn.
Fernández-López A, Luaces-Cubells C, Valls-Tolosa C, Ortega-Rodríguez J, García-García JJ, Mira-Vallet A, et al. Procalcitonina para el diagnóstico precoz de infección bacteriana invasiva en el lactante febril. An Pediatr. 2001;55(4):321-8. http://doi.org/f2kcnv.
Pérez BM, Landaeta-Jiménez M, Amador J, Vásquez M, Marrodán MD. Sensibilidad y especificidad de indicadores antropométricos de adiposidad y distribución de grasa en niños y adolescentes venezolanos. Interciencia. 2009;34(2):84-90.
Smith CJ. Diagnostic tests (1) - sensitivity and specificity. Phlebology. 2012;27(5):250-1. http://doi.org/c75q.
Cerda J, Cifuentes L. Uso de curvas ROC en investigación clínica. Aspectos teórico-prácticos. Rev Chilena Infectol. 2012;29(2):138-41. http://doi.org/c75r.
Tarabla HD. Validación de pruebas diagnósticas. Rev FAVE Cienc Vet. 2002;1(1):37-42. http://doi.org/c75s.
McNicol D. A primer of signal detection theory. New York: Psychology Press. New York; 2005.
Cómo citar
APA
ACM
ACS
ABNT
Chicago
Harvard
IEEE
MLA
Turabian
Vancouver
Descargar cita
Licencia
Derechos de autor 2020 Revista de la Facultad de Medicina

Esta obra está bajo una licencia Creative Commons Reconocimiento 3.0 Unported.
-