Published
A Semi-Supervised Deep Learning Model for Defective lime Classification
Modelo semisupervisado de aprendizaje profundo para la clasificación de limones
DOI:
https://doi.org/10.15446/ing.investig.112835Keywords:
semi-supervised learning, citrus fruit classification, anomaly detection, precision agriculture applications (en)aprendizaje semisupervisado, clasificación de frutos cítricos, detección de anomalías, aplicaciones para agricultura (es)
For consumers, the predominant fruit selection criterion is visual quality, a factor that classification models emulate when employing images as input data. Most classification paradigms presuppose a balance across classes. In the field of defective fruit detection, databases commonly exhibit a pronounced imbalance between healthy and defective fruit counts. Such disparity can compromise the robustness of classification models or introduce biases stemming from insufficient data. This study introduces a semi-supervised classification framework based on anomaly detection to identify defective lime fruits (Citrus aurantifolia). The framework employs the reconstruction error obtained from an autoencoder neural network and a calculated anomaly probability to locate samples within a two-dimensional space designed for such purpose. Based on the defined parameter ranges, the limes are categorized as either healthy or defective. The proposed classification model underwent training utilizing the publicly accessible Fruits360 database and was tested with a set of 118 new and unlabeled lime images. The classification model attained a precision of 94%, a recall of 0.88, and an F1-score of 0.91 across the test set. These results corroborate that models based on anomaly detection constitute a promising solution to the inherent challenges of unbalanced classification tasks. They offer the advantage of requiring minimal training data and reduced training times while maintaining efficacy, even when the evaluation dataset diverges substantially from the training set. Thus, the proposed model can serve as a decision support tool for farmers, producers, and consumers.
Para los consumidores, el criterio predominante en la selección de frutas es la calidad visual, un factor que los modelos de clasificación emulan cuando emplean imágenes como datos de entrada. La mayoría de los paradigmas de clasificación presuponen un equilibrio entre las clases. En el ámbito de la detección de frutas defectuosas, las bases de datos suelen presentar un desequilibrio pronunciado entre el recuento de frutas sanas y defectuosas. Esta disparidad puede comprometer la solidez de los modelos de clasificación o introducir sesgos derivados de la insuficiencia de datos. En este estudio se introduce un marco de clasificación semisupervisada basado en la detección de anomalías para identificar frutos defectuosos de limón (Citrus aurantifolia). El modelo emplea el error de reconstrucción de una red neuronal autoencoder y una probabilidad de anomalía calculada para localizar muestras dentro de un espacio bidimensional diseñado para tal propósito. A partir de los rangos de parámetros definidos, los limones se clasifican como sanos o defectuosos. El modelo de clasificación propuesto fue entrenado mediante la base de datos de acceso público Fruits360 y evaluado con un conjunto de 118 imágenes de limones nuevas y sin etiquetar. El modelo de clasificación obtuvo una precisión del 94 %, una recuperación del 0,88 y un valor F1 0,91 en el conjunto de pruebas. Estos resultados corroboran que los modelos basados en la detección de anomalías constituyen una solución prometedora a los retos inherentes de las tareas de clasificación no equilibradas; ofrecen la ventaja de requerir datos de entrenamiento mínimos y tiempos de entrenamiento reducido, manteniendo la eficacia incluso cuando el conjunto de datos de evaluación diverge sustancialmente del conjunto de entrenamiento. Así, el modelo propuesto puede servir como herramienta de apoyo en las decisiones de agricultores, productores y consumidores.
Recibido: 7 de febrero de 2024; Aceptado: 2 de octubre de 2024
RESUMEN
Para los consumidores, el criterio predominante en la selección de frutas es la calidad visual, un factor que los modelos de clasificación emulan cuando emplean imágenes como datos de entrada. La mayoría de los paradigmas de clasificación presuponen un equilibrio entre las clases. En el ámbito de la detección de frutas defectuosas, las bases de datos suelen presentar un desequilibrio pronunciado entre el recuento de frutas sanas y defectuosas. Esta disparidad puede comprometer la solidez de los modelos de clasificación o introducir sesgos derivados de la insuficiencia de datos. En este estudio se introduce un marco de clasificación semisupervisada basado en la detección de anomalías para identificar frutos defectuosos de limón (Citrus aurantifolia). El modelo emplea el error de reconstrucción de una red neuronal autoencoder y una probabilidad de anomalía calculada para localizar muestras dentro de un espacio bidimensional diseñado para tal propósito. A partir de los rangos de parámetros definidos, los limones se clasifican como sanos o defectuosos. El modelo de clasificación propuesto fue entrenado mediante la base de datos de acceso público Fruits360 y evaluado con un conjunto de 118 imágenes de limones nuevas y sin etiquetar. El modelo de clasificación obtuvo una precisión del 94 %, una recuperación del 0,88 y un valor F1 0,91 en el conjunto de pruebas. Estos resultados corroboran que los modelos basados en la detección de anomalías constituyen una solución prometedora a los retos inherentes de las tareas de clasificación no equilibradas; ofrecen la ventaja de requerir datos de entrenamiento mínimos y tiempos de entrenamiento reducido, manteniendo la eficacia incluso cuando el conjunto de datos de evaluación diverge sustancialmente del conjunto de entrenamiento. Así, el modelo propuesto puede servir como herramienta de apoyo en las decisiones de agricultores, productores y consumidores.
Keywords
semi-supervised learning, citrus fruit classification, anomaly detection, precision agriculture applications.ABSTRACT
For consumers, the predominant fruit selection criterion is visual quality, a factor that classification models emulate when employing images as input data. Most classification paradigms presuppose a balance across classes. In the field of defective fruit detection, databases commonly exhibit a pronounced imbalance between healthy and defective fruit counts. Such disparity can compromise the robustness of classification models or introduce biases stemming from insufficient data. This study introduces a semi-supervised classification framework based on anomaly detection to identify defective lime fruits (Citrus aurantifolia). The framework employs the reconstruction error obtained from an autoencoder neural network and a calculated anomaly probability to locate samples within a two-dimensional space designed for such purpose. Based on the defined parameter ranges, the limes are categorized as either healthy or defective. The proposed classification model underwent training utilizing the publicly accessible Fruits360 database and was tested with a set of 118 new and unlabeled lime images. The classification model attained a precision of 94%, a recall of 0.88, and an F1-score of 0.91 across the test set. These results corroborate that models based on anomaly detection constitute a promising solution to the inherent challenges of unbalanced classification tasks. They offer the advantage of requiring minimal training data and reduced training times while maintaining efficacy, even when the evaluation dataset diverges substantially from the training set. Thus, the proposed model can serve as a decision support tool for farmers, producers, and consumers.
Keywords
semi-supervised learning, citrus fruit classification, anomaly detection, precision agriculture applications.Introduction
Citrus fruits are among the most consumed and produced in the world. However, it is estimated that their production will decrease within the next 10 years due to factors such as climate change, land use issues, and diseases.
In recent years, precision agriculture has helped farmers and producers (Ayoub Shaikh et al., 2022; Nowak, 2021; D. Li et al., 2021; González-Barbosa et al., 2022) to create optimized systems for crop production, crop estimation, weather monitoring, disease detection, and defect identification (Wang et al., 2022; Mzoughi and Yahiaoui, 2023; E. Li et al., 2023; Gokulnath and Usha Devi, 2021; Chaturvedi et al., 2023; Naranjo-Torres et al., 2021; Aparicio Pico et al., 2022; Puerto Cuadros, 2024). Other factors can affect crop production, such as diseases and pests (George et al., 2022; Bao et al., 2021). For a producer, the fruit must have the best possible visual appearance, as it is the main aspect that the customers look for in the market (Blasco et al., 2016). Hence, it is essential to distinguish good fruit from those with defects or poor visual appearance (Ghazal et al., 2021). The early detection of diseases and defects has become a critical task to ensure crop production and quality (Soltani Firouz, 2022), easier post- harvest processing (Zhang et al., 2021), and longer shelf- life(Bhole, 2021). The consumers purchasing decision is heavily influenced by the quality and appearance of the fruit; a good healthy fruit without defects is the first choice (Blasco et al., 2016). Therefore, having an automated and efficient system to monitor the citrus production process is essential in continuing to meet the global demand (Food and Agriculture Organization, 2022; Lozano and Archibald, 2022; Peng et al., 2023).
Despite the fact that some systems have been proposed and developed to improve citrus production, most of them focus on the study of diseases and defects in tree leaves(Arnal Barbedo, 2019; Khanramaki et al., 2021; Ümit Atila et al., 2021). The evaluation of leaves is one of the fastest available methods, but it can lead to biased results since the decision is based on limited samples rather than on the entire tree or an inspection of the fruit produced. Furthermore, these systems often use private and customized databases (Lu and Young, 2020) and provide limited results. In addition, the fact that a leaf is defective does not mean that the fruit produced is. Therefore, fruit evaluation arises as an alternative method to leaf assessment.
Classifying healthy fruits from defective ones is the final step in the post-harvest process. At this stage, the fruit is prepared for storage, and the selection is based on its visual quality, so both producers and consumers look for the fruit with the best appearance.
The use of images and their processing is an alternative to detect and identify diseases and defects in tree leaves and fruits. Machine vision systems allow for precise defect localization using RGB (Cubero et al., 2014; Tan et al., 2021), X-ray, multi-spectral, satellite (Cándido-Mireles et al., 2023; Toosi et al., 2022), and aerial images (Futerman et al., 2023; Istiak et al., 2023). More recently, the use of machine and deep learning models has helped to make machine vision systems more automated, accurate, and efficient (Palei et al., 2023). Deep learning models based on convolutional neural networks (CNNs) can handle large amounts of information and make decisions based on key features such as color, shape, and texture. However, to obtain a good result using a CNN, it is necessary to have a large and diverse database, a balance of classes, and labeled samples (Gron, 2017; Goodfellow et al., 2016; Ibrahim and Kuban, 2023). Additionally, it takes a considerable amount of time to train these networks, with the risk of overfitting or bias when making decisions. One paradigm that addresses some of these challenges is semi-supervised learning (Thoidis et al., 2021; Gao et al., 2022; Memarzadeh et al., 2022).
An alternative to CNNs are autoencoders (Bank et al., 2021). These types of neural networks adopt a different approach by using a latent space that retains the most important information of the input data. They also have the advantage of being able to work with unlabeled or barely labeled data, so they can work as unsupervised or semi- supervised classification models and can be robust to input noise and anomalous data (Cazzonelli and Kulbach, 2023). Given these advantages, an autoencoder can be used as a classification model based on anomaly detection, e.g., in a dataset of samples that do not match the learned features and are considered anomalous. This approach is useful when dealing with imbalanced datasets. In some real-world scenarios, the data available for different classes can be highly imbalanced. In contrast, traditional machine learning models assume a class balance, so they can be prone to overfitting or to bias.
In the field of precision agriculture, anomaly detection can be applied to detect defective or diseased fruit. In a lime dataset, anomalous data correspond to damaged, injured, or sick fruits, or to any other fruit with a compromised visual appearance. Fruit diseases are a serious threat to lime harvesting, yet defective limes can only be observed during the post-harvest process or in the delivery stages. Therefore, the citrus industry and the horticultural industry in general necessitate rapid and automated disease detection tools throughout the post-harvest period.
The objective of this work is to develop a semi-supervised classification system to separate healthy limes from defective ones. The paradigm of autoencoders, combined with the advantages of semi-supervised learning, constitutes a versatile yet robust combination for such tasks. In this case, defective limes are difficult to obtain due to current high-quality standards. By using anomaly detection, defective limes can be identified with relatively little effort by teaching the model the characteristics of a healthy lime. Consequently, if a lime does not meet these characteristics, it is considered defective. The anomaly detection approach addresses the issues of data scarcity, overfitting, and heightened training times commonly associated with traditional classification models. This article proposes a classification system based on anomaly detection using autoencoders to obtain the reconstruction error of the input data (images) as well as the value of a kernel density estimation function.
The main contributions of this work are presented below.
The anomaly detection model was trained exclusively with images of healthy limes.
Predictions were made with the probability of an image and the reconstruction error value.
The encoder can be used as a feature extractor for further classification models.
Related work
A novel deep learning model used to detect defected regions in citrus fruits is proposed in (Dhiman et al., 2022). The model uses the Felzenswalb algorithm as the main approach to measure pixel intensity in the images. The fruits in this database can have one of three damage severity levels: low, medium, and high. Additionally, there is a fourth class for healthy fruits. The model achieved an accuracy value of 99%, 97%, and 96% for low-, medium-, and high-severity levels. For healthy fruit, the model showed 96% accuracy.
The study by (Fan et al., 2020) presents a deep learning architecture based on neural networks with a low-cost vision system to detect defective apples in a fruit sorting machine. The proposed architecture used images of both classes for training and performance validation, achieving an accuracy of 96.5%. The trained model was validated by loading it onto an independent sorting machine using 200 apples, obtaining an accuracy of 92%.
Another approach for fruit quality classification is presented in (Hanh and Bao, 2022). This article proposes a machine vision system to classify limes in the Vietnam region into three quality groups: bad, regular, and best. For classification, the authors use a P-score, which counts the number of pixels in the image that are considered healthy within the fruit peel. The quality of limes is poor if the P- score is less than 35. The lime quality is considered good if P is between 35 and 85. Lastly, if the P-score is greater than 85, the quality is the best.
An orange categorization system using different features such as color, fruit size, shape, and surface defects was reported in (Hasan et al., 2021). In their system, oranges were classified using three CNN models, with the third model achieving an accuracy of 92.25%. In parallel, a classification model using a conditional generative adversarial network (CGAN) and the Lemon Quality Dataset was developed in (Bird et al., 2022), aiming to address the shortage of defective lime images with the CGAN. Although the reconstructions lacked consistency regarding the shape, color, and texture of the fruit, the authors managed to achieve an accuracy value of 88.75% in their experiments.
A computer vision system was reported in (Chen et al., 2018) for the automatic detection and classification of oranges based on their external features. Utilizing a combination of color- and texture-based characteristics, this system classifies oranges into four categories, each corresponding to a different level of ripeness. The model's performance was evaluated by the authors, with the system achieving an impressive accuracy of 97.5%. This led to the conclusion that the proposed system presents significant opportunities for enhancing both efficiency and accuracy in industrial applications.
A spectroscopy system developed to evaluate the phytopathological condition of mango fruit is presented in (Cabrera Ardila et al., 2020a), given mangoes' susceptibility to anthracnose infections during the harvesting phase. The authors monitored the progression of the pathogen, categorizing the fruits into three stages: healthy, asymptomatic, and diseased. Various classification algorithms, such as linear discriminant analysis (LDA), random forests (RF) and support vector machines (SVM), were used to assess the data. The best accuracy value was given by LDA, ranging from 91-100% across the three stages.
A novel approach for identifying surface defects in oranges using computer vision techniques was proposed in (Rong et al., 2017). A sliding window algorithm was applied by the authors to segment the images, which allowed detecting defects of varying sizes and shapes. The proposed method was tested on a custom dataset and achieved an accuracy rate of 91.5%.
A robust and generalized CNN model for detecting black spot disease and ripeness levels in orange fruit was introduced in (Momeny et al., 2022) by fine-tuning pre- trained models. Data-augmentation techniques were used by the authors to increase the dataset size and enhance their model's performance. The learning-to-augment strategy employed is a technique that generates new training data by adding noise to existing images. This helped to improve the performance of the deep neural network model, making it more robust and better able to generalize to new unseen data with an accuracy of 99.5%.
The state of the art shows deep learning to be the most marked trend in recent years. However, one of the most important challenges is the absence of a standard or universal database to establish a common frame of reference to evaluate the work done. Each proposal tends to create its own database, adapted to specific needs and particular applications, hindering direct comparison between methods and results.
Classification was identified as the main task within the studies found, with a focus on assessing the health of fruits or categorizing them by type. Despite advances in deep learning techniques, the amount of data used in these studies is often limited, which restricts the generalization capacity of the models developed. This data limitation not only affects the accuracy and robustness of the models, but also poses interesting challenges for their application in broader and more varied scenarios and tasks. In summary, although deep learning shows potential in citrus fruit classification, the absence of standard databases and the current limitations regarding the amount of available data are critical challenges that need to be addressed in order to improve overall performance and results comparability in this field.
Methodology
Model description
The proposed model is based on the autoencoder algorithm. An autoencoder is a type of algorithm with the primary purpose of learning an abstract representation of the data by learning to reconstruct a set of input observations (Bank et al., 2021). This representation can then be used for different applications. In recent years, convolutions have been added to autoencoders to reduce dimensions. The variant studied herein is known as convolutional autoencoders (CAEs). CAEs are a type of CNN that use convolutional, pooling, and deconvolutional layers to create and refine feature maps from input images, ultimately reconstructing the original input through unsupervised learning. By employing the convolution operator, CAEs filter input signals to extract significant content, encoding inputs into fundamental signals and reconstructing them to minimize error. Unlike traditional CNNs, which are primarily used for supervised classification tasks, CAEs focus on learning optimal filters for feature extraction and input reconstruction. This approach modifies the standard autoencoder by incorporating convolutional layers in the encoder and transposing convolutional layers in the decoder, effectively capturing spatial statistics in image data (Maheshwari et al., 2022). CAEs are better suited for image processing tasks since they capture spatial patterns and relationships between pixels, resulting in a more accurate image reconstruction (Michelucci, 2022). Figure 1 shows the workflow followed to carry out the classification tasks.
The model takes a color image of any size as input. Then, the input image passes from the input layer to a preprocessing layer, where its size changes to 96 × 96. The image is also standardized in this layer. After the pre-processing layer, there is an image augmentation layer. Here, the image is transformed through various adjustments, including rotation, brightness, contrast, and changes in pose. These changes provide the autoencoder with more data in the training stage (dos Santos Tanaka and Aranha, 2019; Shijie et al., 2017). The augmentation stage helps the autoencoder learn from new situations or instances in which the lime fruit may appear.
The autoencoder processes the input image into a condensed representation known as the latent space. In this part of the network, the input data become a lower- dimensional representation of the input image, capturing its most significant features in a compact, encoded format. Because the latent space is smaller than the input image, it effectively reduces data complexity. Exploring this space enables the generation of data points that mirror the original, allowing for advanced operations like clustering, classification, and anomaly detection.
Figure 1.: Graphical representation of the workflow proposed for the classification of the lime images
The encoder
The next segment of the model is the encoder, which converts input data into the latent space. This process aims to retain as much of the initial information as possible. The proposed encoder design incorporates three down-sampling stages. In each stage, the dimensions of the image are reduced, while its complexity is increased. This is achieved through a sequence of convolutional layers paired with max- pooling layers. Consistency is maintained throughout the process by using identical kernel sizes and stride values for the convolutional and max-pooling layers, while the rectified linear unit (ReLU) serves as the activation function for all layers. Variations arise only in the number of filters within the convolutional layers and in the pool sizes for the max- pooling layers. Initially, the convolutional layers start with 16 filters. This number then decreases to 8 and subsequently to 3 for the second and third layers, respectively. In tandem, the pool size expands progressively as the model delves deeper. Upon completion of the encoding process, the transformed data emerge with the dimensions 3 × 3 × 3, which constitutes the latent space of the proposed model. This compressed output then proceeds to the next phase: the decoder.
The decoder
The decoder is responsible for reconstructing the input data from the encoder's compressed latent representation, producing an output that closely resembles the original input. This step is crucial in an autoencoder's architecture, as the quality of the decoder directly influences the fidelity of the reconstruction (Gron, 2017). The decoder reverses the encoder's process by up-sampling the compressed data to its original dimensionality. A well-crafted decoder ensures high-quality reconstructions, whereas a sub-optimal one may result in poor quality. Reflecting the autoencoder's symmetrical design, the decoder of the proposed model mirrors the encoder's structure with reversed operations.
Figure 2.: Architecture of the convolutional autoencoder used in this work. It consists of an encoder, a latent space, and a decoder. The input is a 96 × 96 color image that is progressively compressed by convolution and max-pooling layers to a latent representation of size 3 × 3 × 3. The decoder then up-samples the latent representation to reconstruct the original 96 × 96 image via up-sampling and convolutional layers. The network's total parameter count is 3738, with 16 convolutional filters in the initial and final layers, ensuring efficient feature extraction and image reconstruction.
Training the model
The next phase in the workflow involves training the model. Google Colaboratory's services and TensorFlow were utilized for coding and training. The basic GPU environment of Google Colaboratory, equipped with an NVIDIA K80 with 12GB of VRAM and an Intel Xeon CPU with 13GB of RAM, was selected for the training process. The Fruits360 dataset (Murean and Oltean, 2018), a publicly accessible collection of 90 483 images across 120 fruit and vegetable categories, including apples, bananas, oranges, limes, and tomatoes, was employed for both training and validation. The dataset was built for object recognition, classification, and detection tasks. It includes color images 96 × 96 pixels in size, captured from various angles, under different lighting conditions, and against contrasting poses and backgrounds. Every image has an assigned label (organized in folders) that serves to identify the type of fruit or vegetable. Furthermore, each class is divided into training and validation sets.
The Fruits360 dataset is used as a valuable benchmark for the development of fruit classification or detection models (Siddiqi, 2020; Latif et al., 2023; Rathnayake et al., 2022; Dandekar et al., 2020). Within the dataset, there is a subset of lime images (Citrus aurantifolia). The lime images were chosen for their close resemblance to the lime varieties commonly found in Mexico regarding both color and visual features. The lime subset comprises a total of 822 lime images, which were partitioned into 656 for training and 166 for validation, i.e., approximately an 80-20 split. This distribution was adopted due to the fixed number of training and validation images in the dataset.
Table 1 presents the data distribution and the hyperparameters selected for model training. The training process spanned 500 epochs and incorporated an early- stopping mechanism to mitigate the risk of overfitting.
Table 1.: Parameters used for the training stage
Subsequent to training, the model became adept at recognizing the characteristics of a healthy lime. This allowed applying the trained model for predictions on both familiar and novel lime images. A lime was classified as defective if it lacked the characteristics that the model was trained to recognize as indicative of a healthy specimen. Conversely, a lime that exhibited these learned traits was deemed healthy.
Figure 3.: Loss curve of the model during the training stage. The blue line denotes the loss value for the training set, and the orange one denotes the loss value for the validation set.
Making predictions for new images
The model returns a loss value after the image goes through all the convolution layers. This value is called the reconstruction error (RE). For this case, the RE is a measure that quantifies how similar the decoded output of the autoencoder is to the original input data. This RE serves as the main feedback during the training phase of an autoencoder; by optimizing this error, it should learn to capture the important features and patterns of the input data. Ideally, the RE value would be 0, meaning that the model can recreate the input image without errors. In practice, this does not occur often.
The RE value is used to evaluate the quality of a reconstructed image. One way to ensure that an autoencoder is trained correctly is to compare it inputs and outputs; the differences should be insignificant (Gron, 2017). Since the model is trained to identify healthy lime images, when a faulty image is introduced, the RE should be higher. However, the RE value should not be the only metric to evaluate the performance of a model (Beggel et al., 2020).
A second reference value was calculated to this effect. This value, derived from the latent space, was utilized to calculate a probability density using the kernel density estimation (KDE) technique (Hu et al., 2020). KDE is a non- parametric technique for estimating the probability density function (PDF) of a random variable. It can estimate the probability distribution of a set of data and constitutes a helpful tool for data analysis, as it allows the user to visualize the data distribution more effectively than other visual representations. Unlike parametric methods, KDE does not rely on assuming a specific parametric form of the density function; instead, KDE learns the shape of the density from the data itself. This kind of flexibility makes this method popular as a tool for analyzing data from complex distributions (Lang et al., 2022; Cao et al., 2016). By combining the autoencoder's RE and the data's KDE value, anomalies (defective limes in this case) can be detected in an unknown dataset. This approach enables the automatic detection of anomalies without prior knowledge of the expected data distribution. Anomalies are data points with a high RE value and a low probability density, as estimated by the KDE function.
Results
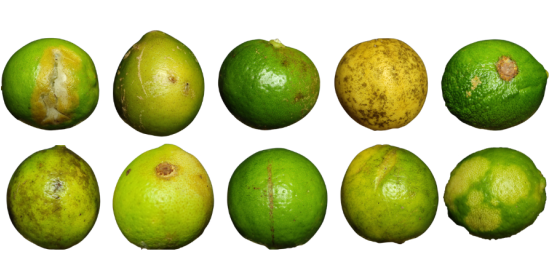
Another dataset of 118 lime images was constructed to evaluate the model's performance on new, previously unseen samples. These images differed significantly in size (1080×1080 pixels), color, texture, and geometry from those in the Fruits360 dataset. Moreover, the background of the images was removed. This approach allowed assessing the classification model's ability to generalize its learning of the normal class. A sample of these new images is shown in Figure 4.
Figure 4.: Some of the limes used to test the model's performance. These images had the background segmented. The limes were harvested from orchards located in the town of Tecolapa, in the state of Colima, Mexico. As can be seen, all the fruits exhibit at least one type of defect that affects their visual quality.
The RE was calculated for the new test set by passing the each new image through the model. Then, this value, as given by the trained model, was used to calculate the KDE probability for all the datasets. Figure 5 shows the distribution of the REs and the values of the KDE function for all the three datasets. By illustrating these values in a scatter plot, we can evaluate whether the model can detect an anomaly (and locate it if present) in an unknown dataset. Figure 6 illustrates the data point distribution using both values.
Figure 5.: Distribution of values for the training and validation datasets. a) Histogram of RE values for both datasets; b) histogram showing the KDE function values for both datasets. The blue bars represent training data, and the orange bars represent the validation data. The distributions reveal that the RE values for both datasets lie within the expected ranges, highlighting the effectiveness of the proposed method in identifying regions corresponding to healthy lime fruit.
We propose two ways to evaluate the performance of the classification model. The first approach is to look at where the value of a new image would lie in the plot after the model reconstructs it and calculates the value of the KDE function. However, this strictly necessitates visualization in the scatter plot in order to provide an accurate result. The second approach is to establish two thresholds, as shown in Equation (1), where healthy (normal class) and anomaly (anomalous class) are the possible output classes; error refers to the RE value; density represents the KDE function value; emin and emax denote the lower and upper threshold values for the RE, respectively; and dmin and dmax represent the lower and upper threshold values for the KDE function. These values are based on the minimum and maximum values observed in both histograms in Figure 5.
Equation 1 label = \left\{ \begin{array}{ll}\mathrm{healthy~if~}e_{min}< error< e_{max} & \mathrm{~d~}_{min}< density< d_{max}\\ \mathrm{anomaly~otherwise} & \mathrm{~d~}_{max} \end{array} \right.These thresholds are used to automate the classification of the faulty limes. Therefore, if a new lime image has a value within both thresholds, it will be considered a healthy lime; otherwise, it will be deemed defective. The threshold values determine the cutoff points for distinguishing between anomalies and normal instances.
In an anomaly detection application, the objective of the model is to find all possible anomalies in a given dataset. In this work, a confusion matrix (Table 2) was elaborated under the following considerations: true positives (TP) were the anomalies (defective limes) that lay outside the proposed thresholds; false positives (FP) corresponded to all the limes that were anomalies but fell between the established thresholds; true negatives (TN) were all healthy limes (if any) that were correctly classified as such; and false negatives (FN) are the healthy ones misclassified as defective.
Table 2.: Confusion matrix built with the predictions
Table 3 presents the classification reports, as calculated using the SkLearn framework (Pedregosa et al., 2011), the k-nearest neighbors algorithm (kNN), and principal components analysis (PCA).
Figure 6.: Scatter plot made using the KDE probability value and the RE. The red and blue regions indicate the training and validation datasets, respectively. The black stars are the distribution of the data points for the test set. The majority of the test data points lie outside the red and blue regions. However, some data points fell into them, implying that there are some limes that the model missed to detect as anomalies.
Table 3.: Classification report provided by Sklearn with the metrics of the proposed model, the kNN algorithm, and the PCA
The value of the classification model's metrics has different interpretations. The recall value (0.88) is higher for the anomalous class than for the normal class (0.80). For the normal class, the precision is 0.65, meaning that the number of instances detected is lower than that of the anomalous class (0.94). To summarize, the classification model performs better at identifying anomalies (unhealthy lime fruits) than in normal instances. This behavior suggests that the model can identify instances of the anomalous class, i.e., it has a strong ability to detect the TPs of said class in comparison with the normal one. The high recall values for both classes are also desirable under these circumstances, as they minimize the FN rate while increasing the detection rate of TPs without causing misclassification. Given that the value is almost identical, it can be assumed that the model captures the same proportion of positive instances (either normal or anomalous) across different scenarios and circumstances in different databases, meaning that the model is consistent when making predictions with unknown data.
A comparison with a more recent approach was carried out, i.e., an autoencoder using the VGG16 architecture. This architecture is among the most widely used for classification and feature extraction tasks. Additionally, it benefits from being pre-trained on the ImageNet database. By utilizing the TensorFlow framework, it was possible to work with a pre-trained version of VGG16 and employ transfer learning, followed by fine-tuning with images from the Fruits360 dataset. The VGG16 architecture is a deep CNN that consists of 16 layers, primarily composed of convolutional and fully connected layers. The architecture includes five convolutional blocks, each followed by max-pooling layers, and three fully connected layers at the end, making it highly effective for image classification tasks. The decoder part of VGG16 was implemented using TensorFlow and Python, following the same structure as the network, albeit inversely. Since the decoder's task is merely to reconstruct the input data, fine-tuning this section of the autoencoder was not necessary. The number of epochs, data distribution, and hyperparameters were consistent with those used in our autoencoder model. Moreover, as with our proposal, the RE and KDE values were calculated. Figure 7 shows their distribution.
Figure 7.: Scatter plot obtained from the KDE and RE values of the VGG16 autoencoder. The orange crosses are the anomalous points (defective limes), while the blue stars correspond to the healthy fruit.
An analysis of the density plots and the distribution of the points revealed distinct patterns between the training and anomaly datasets. Upon evaluating the overlap between these distributions, a small number of anomaly points (orange crosses) were found to lie within the high-density region of the training data (blue stars), signifying incorrect classification.
This approach demonstrates a similar precision value to our proposed method (around 95%). Notably, the number of anomalous points that lie within the normal data is approximately 20, which is higher than that of our method. Nonetheless, a lower proportion of the normal points are within the region of anomalous data.
Discussion
Since this work aims to detect as many anomalies as possible, the precision metric was prioritized. For example, a FN rate is more critical in a medical diagnosis scenario than a FP. In this case, classifying a healthy lime as faulty is less critical than misclassifying a faulty one as healthy. As shown in Table 2, the model has fewer FNs than FPs, indicating its effectiveness for the given task.
Table 4 lists studies that solve a task similar to that proposed in our study, and it offers a broader perspective on our proposal and some related works found in the literature. Most of these studies use some kind of machine learning (ML) algorithm for classification, with CNNs being among the most popular approaches and the ones that report better accuracy values. As for the feature extraction process, the methods differ significantly according to the various targets of the studies. The accuracy value for the listed works ranges from 88 to 98%.
Table 4.: Comparison of the works found in the literature
In comparison with an autoencoder built upon a well- established architecture such as VGG16, our method demonstrates a slightly better performance despite being trained entirely from scratch, while the VGG16 autoencoder utilized a pre-trained version. Although the precision values are comparable, the key differences lie in training times and computational efficiency. Our autoencoder required approximately 45 minutes for training, whereas the VGG16 model took nearly 120 minutes. Furthermore, despite the shallower depth of our autoencoder's architecture compared to VGG16, it achieved comparable results, highlighting that effective performance can be obtained by training a new model from scratch. Nevertheless, one advantage of using pre-trained models is the ability to leverage pre-existing weights, which significantly aids in feature extraction and the identification of relevant information.
The anomalous dataset reveals similarities with the training images in terms of color, shape, and texture. Nonetheless, certain anomalies were mistakenly classified as healthy by the model. This misclassification could be attributed to outliers within the anomalous set, indicating more severe damage or advanced stages of disease. The RE values for the anomalous set range from 0.2 to 0.9, suggesting that the autoencoder models reconstructions are generally reliable. However, a significant limitation of this semi-supervised approach is its reliance on determining thresholds for the KDE density function and RE values in the two-dimensional space. These thresholds are based on the source data, which may introduce inherent biases. Furthermore, the choice of autoencoder architecture and data pre-processing methods can impact the RE and the KDE density function values, potentially contributing to biases in the classification system.
Additionally, most of the works found in the literature use their own datasets, which were created for their specific purposes. As a result, it is not possible to make direct comparisons between works, and there is no common benchmark to compare the results. This is important because it limits the solutions to local and specific contexts. The solutions proposed so far work with regional varieties of lime fruit. Using these varieties to build datasets can introduce biases that hinder the construction of a general solution for this type of precision agriculture application. It should also be considered that the types of defects change depending on the harvest location. This phenomenon is multi-factorial due to the different soil types, climatic conditions, and harvest times present. Although some of the studies found show interesting solutions, they are applied in local contexts, either due to a lack of data or to solve a particular need. However, there is a trend to develop more general solutions that can be applied and scaled to broader and more general contexts (Verma and Verma, 2022; Bhardwaj et al., 2022; Shahi et al., 2022).
The experimental results confirm that the proposed classification model is sufficiently robust, as it accurately classifies new lime images, even when they differ significantly from the training set in key features such as color, hue, shape, size, and lighting conditions.
Another advantage of the classification model is that it uses an innovative and robust approach to solve a problem that has been present for many years. The anomaly detection method, along with the proposed architecture, showed that it is possible to achieve similar results without large amounts of data and long training times. Additionally, this method can detect unknown anomalies that are not present in the training data, whereas a balanced classification approach assumes that all classes are known and equally present in the training set.
Although the limes used for validation have at least one kind of visual defect, the model misclassified some of them as healthy. This phenomenon is understandable since some of the defects are not as evident as in the training images or have not reached a critical state. For example, color change is a known defect in citrus fruit, but the transition from green to yellow is so subtle that is difficult to identify. Another example is when limes have tiny black spots on their peel. According to the experts, the lime is defective (since it implies the presence of a plague or disease), but, for the classification model, it is interpreted as healthy. However, including images with this kind of characteristic may significantly improve the performance.
The proposed classification model uses color as a critical feature for lime classification. This behavior can be noticed in the training and validation data distribution. The images used for this purpose have a similar green hue. Meanwhile, the test images have a brighter green hue, and, in some cases, the fruit color is yellow instead of green.
Another factor that could compromise the results is the type of defect: if the defect is more evident, i.e., brown spots or peel injuries, the model will more easily identify the fruit as defective. On the other hand, less obvious defects such as plagues or diseases could produce FNs during classification. This behavior could suggest that the human factor is still needed. Looking at the scatter plot is useful and can serve as a quick way to decide, but looking at the lime image can ensure that the decision is correct.
The study most similar to ours is the one by (Yılmaz et al., 2023), as their methodology, fruit studied, and network design are based on a variant of autoencoders: stacked autoencoders (SAE). Their SAE used different color and morphological features as input to the network. These features were extracted using techniques involving the gray-level co-occurrence matrix (GLCM), color space, and morphological methods. The authors used labeled data with two classes (healthy and defective limes) from a public database. This model achieved an accuracy of 98.96% while using only 32 of the previously mentioned features. Furthermore, the authors mention that their metrics are appropriate due to the size and quality of the database images, which allowed them to discard redundant features during training. This study presents interesting advancements in lime classification. However, one of its constraints lies in the methodology for extracting features from the images; as the number of features increases, the computational cost also does, which may be problematic for real-time applications or in situ implementations. However, the utilization of hybrid models suggests a new way to approach classification tasks.
Conclusions
The method proposed in this paper used a semi-supervised anomaly detection approach for lime fruit classification, and it achieved an accuracy of 94% for the anomalous data. This means that the model is competitive with other approaches found in the literature in terms of performance.
As future work, we will test our model with a larger dataset and redesign it for a more robust classification. Although our dataset was large enough for our specific purpose, the color of the limes in the Fruits360 dataset is darker than that of the subspecies in Mexico. Recognizing this issue, we found that having a dataset with Mexican limes is necessary; in this way, the predictions will enrich model performance, benefiting local producers.
We will explore some variants of the autoencoders, such as variational autoencoders, or even other deep learning approaches like reinforcement learning. Recent advances in these artificial intelligence paradigms show promising results and could tackle the problem in different ways, leading to a more efficient or accurate classification method.
Acknowledgements
The authors would like to thank the lime producers from Tecolapa, Colima, Mexico, for the fruit provided, their insightful point of view, and for their knowledge. In addition, the authors would like to thank José J. Rico-Jiménez, who reviewed the overall grammar and style of the manuscript. This work was supported by Secretaría de Investigación y Posgrado of the Instituto Politécnico Nacional, under grants 20241653 and 20240650.
References
References
Aparicio Pico, L. E., Devia Lozano, P., and Amaya Marroquin, O. J. (2022). Aplicación de deep learning para la identificación de defectos superficiales utilizados en control de calidad de manufactura y producción industrial: Una revisión de la literatura. Ingeniería, 28(1), e18934. https://dx.doi.org/10.14483/23448393.18934.
Arnal Barbedo, J. G. (2019). Plant disease identification from individual lesions and spots using deep learning. Biosystems Engineering, 180, 96-107. https://dx.doi.org/10.1016/j.biosystemseng.2019.02.002.
Ayoub Shaikh, T., Rasool, T., and Rasheed Lone, F. (2022). Towards leveraging the role of machine learning and artificial intelligence in precision agriculture and smart farming. Computers and Electronics in Agriculture, 198, 107119. https://dx.doi.org/10.1016/j.compag.2022.107119.
Bank, D., Koenigstein, N., and Giryes, R. (2021). Autoencoders. arXiv preprint. https://doi.org/10.48550/arXiv.2003.05991.
Bao, M., Zheng, Z., Chen, J., and Deng, X. (2021). Investigation of citrus hlb symptom variations associated with candidatus liberibacter asiaticus strains harboring different phages in southern china. Agronomy, 11(11), 2262. https://dx.doi.org/10.3390/agronomy11112262.
Beggel, L., Pfeiffer, M., and Bischl, B. (2020). Robust anomaly detection in images using adversarial autoencoders. In U. Brefeld, E. Fromont, A. Hotho, A. Knobbe, M. Maathuis, and C. Robardet (Eds.), Machine Learning and Knowledge Discovery in Databases. Springer International Publishing. https://doi.org/10.1007/978-3-030-46150-8_13",pages="206--222.
Bhardwaj, A., Hasteer, N., Kumar, Y., and Yogesh. (2022). Deep learning based fruit defect detection system. In S. Mekhilef, R. N. Shaw, and P. Siano (Eds.), Innovations in Electrical and Electronic Engineering (pp. 306–313. https://doi.org/10.1007/978-981-19-1677-9_28). Springer Singapore.
Bhole, A., Varsha Kumar. (2021). A transfer learning-based approach to predict the shelf life of fruit. Inteligencia Artificial, 24(67), 102120. https://doi.org/10.4114/intartif.vol24iss67pp102-120.
Bird, J. J., Barnes, C. M., Manso, L. J., Ekárt, A., and Faria, D. R. (2022). Fruit quality and defect image classification with conditional gan data augmentation. Scientia Horticulturae, 293, 110684. https://doi.org/10.1016/j.scienta.2021.110684.
Blasco, J., Cubero, S., and Moltó, E. (2016, 4). Quality evaluation of citrus fruits. In Computer Vision Technology for Food Quality Evaluation: Second Edition (pp. 305–325). Elsevier. https://dx.doi.org/10.1016/B978-0-12-802232-0.00012-8.
Cabrera Ardila, C. E., Alberto Ramirez, L., and Prieto Ortiz, F. A. (2020a). Spectral analysis for the early detection of anthracnose in fruits of sugar mango (mangifera indica). Computers and Electronics in Agriculture, 173, 105357. https://doi.org/10.1016/j.compag.2020.105357.
Cabrera Ardila, C. E., Alberto Ramirez, L., and Prieto Ortiz, F. A. (2020b). Spectral analysis for the early detection of anthracnose in fruits of sugar mango (Mangifera indica). Computers and Electronics in Agriculture, 173, 105357. https://doi.org/10.1016/j.compag.2020.105357.
Cao, V. L., Nicolau, M., and McDermott, J. (2016). A hybrid autoencoder and density estimation model for anomaly detection. In J. Handl, E. Hart, P. R. Lewis, M. López-Ibáñez, G. Ochoa, and B. Paechter (Eds.), Parallel problem solving from nature – ppsn xiv (pp. 717–726). Springer International Publishing. https://doi.org/10.1007/978-3-319-45823-6_67.
Cazzonelli, L., and Kulbach, C. (2023). Detecting anomalies with autoencoders on data streams. In M.-R. Amini, S. Canu, A. Fischer, T. Guns, P. Kralj Novak, and G. Tsoumakas (Eds.), Machine learning and knowledge discovery in databases (pp. 258–274). Springer International Publishing https://doi.org/10.1007/978-3-031-26387-3_16.
Chaturvedi, A., Sharma, S., and Janghel, R. R. (2023). Detection of external defects in tomatoes using deep learning. Journal of Ambient Intelligence and Humanized Computing, 14(3), 2709–2721. https://doi.org/10.1007/s12652-023-04514-y.
Chen, Y., Wu, J., and Cui, M. (2018). Automatic classification and detection of oranges based on computer vision. In 2018 ieee 4th international conference on computer and communications (iccc) (p. 1551-1556. https://doi.org/10.1109/CompComm.2018.8780680).
Cubero, S., Aleixos, N., Albert, F., Torregrosa, A., Ortiz, C., García-Navarrete, O., and Blasco, J. (2014). Optimised computer vision system for automatic pre-grading of citrus fruit in the field using a mobile platform. Precision Agriculture, 15(1), 80–94. https://doi.org/10.1007/s11119-013-9324-7.
Cándido-Mireles, M., Hernández-Gama, R., and Salas, J. (2023). Detecting vineyard plants stress in situ using deep learning. Computers and Electronics in Agriculture, 210, 107837. https://doi.org/10.1016/j.compag.2023.107837.
Dandekar, M., Punn, N. S., Sonbhadra, S. K., and Agarwal, S. (2020). Fruit classification using deep feature maps in the presence of deceptive similar classes. CoRR. https://arxiv.org/abs/2007.05942. DOI: https://doi.org/10.1109/IJCNN52387.2021.9533678
Dhiman, P., Kukreja, V., Manoharan, P., Kaur, A., Kamruzzaman, M. M., Dhaou, I. B., and Iwendi, C. (2022). A novel deep learning model for detection of severity level of the disease in citrus fruits. Electronics, 11(3), 495. https://doi.org/10.3390/electronics11030495.
dos Santos Tanaka, F. H. K., and Aranha, C. (2019). Data augmentation using gans. arXiv preprint. https://doi.org/10.48550/ARXIV.1904.09135.
Fan, S., Li, J., Zhang, Y., Tian, X., Wang, Q., He, X., Huang, W. (2020). On line detection of defective apples using computer vision system combined with deep learning methods. Journal of Food Engineering, 286, 110102. https://doi.org/10.1016/j.jfoodeng.2020.110102.
Food and Agriculture Organization. (2022). World food and agriculture statistical yearbook 2022 (Tech.Rep.).
Food and Agriculture Organization of the United Nations. https://openknowledge.fao.org/handle/20.500.14283/cc2211en.
Futerman, S. I., Laor, Y., Eshel, G., and Cohen, Y. (2023). The potential of remote sensing of cover crops to benefit sustainable and precision fertilization. Science of The Total Environment, 891, 164630. https://dx.doi.org/10.1016/j.scitotenv.2023.164630.
Gao, X., Huang, C., Teng, S., and Chen, G. (2022). A deep-convolutional-neural-network-based semi-supervised learning method for anomaly crack detection. Applied Sciences, 12(18), 9244. https://dx.doi.org/10.3390/app12189244.
George, A., Rao, C. N., and Mani, M. (2022). Pests of citrus and their management. In M. Mani (Ed.), Trends in Horticultural Entomology (pp. 551–575). Springer Nature Singapore. https://doi.org/10.1007/978-981-19-0343-4_17.
Ghazal, S., Qureshi, W. S., Khan, U. S., Iqbal, J., Rashid, N., and Tiwana, M. I. (2021). Analysis of visual features and classifiers for fruit classification problem. Computers and Electronics in Agriculture, 187, 106267. https://doi.org/10.1016/j.compag.2021.106267.
Gokulnath, B. V., and Usha Devi, G. (2021). Identifying and classifying plant disease using resilient LF-CNN. Ecological Informatics, 63, 101283. https://doi.org/10.1016/j.ecoinf.2021.101283.
González-Barbosa, J.-J., Ramírez-Pedraza, A., Ornelas-Rodríguez, F.-J., Cordova-Esparza, D.-M., and González-Barbosa, E.-A. (2022). Dynamic measurement of portos tomato seedling growth using the kinect 2.0 sensor. Agriculture, 12(4), 449. https://doi.org/10.3390/agriculture12040449.
Goodfellow, I., Bengio, Y., and Courville, A. (2016). Deep learning. MIT Press. http://www.deeplearningbook.org.
Gron, A. (2017). Hands-on machine learning with scikit-learn and tensorflow: Concepts, tools, and techniques to build intelligent systems (1st ed.). O’Reilly Media.
Hanh, L. D., and Bao, D. N. T. (2022, May 29). Autonomous lemon grading system by using machine learning and traditional image processing. International Journal on Interactive Design and Manufacturing (IJIDeM), 17, 445-452. https://doi.org/10.1007/s12008-022-00926-w.
Hasan, M. M., Salehin, I., Moon, N. N., Kamruzzaman, T. M., Baki-Ul-Islam, and Hasan, M. (2021). A computer vision system for the categorization of citrus fruits using convolutional neural network. In IEEE (Ed.), 2021 International Symposium on Electronics and Smart Devices (ISESD) (p. 1-6. https://doi.org/10.1109/ISESD53023.2021.9501790). IEEE.
Hernández, A., Ornelas-Rodrı́guez, F. J., Hurtado-Ramos, J. B., and González-Barbosa, J. J. (2021). Accuracy comparison between deep learning models for mexican lemon classification. In M. F. Mata-Rivera and R. Zagal-Flores (Eds.), Telematics and Computing (pp. 62–73). Springer International Publishing. DOI: https://doi.org/10.1007/978-3-030-89586-0_5
Hu, W., Gao, J., Li, B., Wu, O., Du, J., and Maybank, S. (2020). Anomaly detection using local kernel density estimation and context-based regression. IEEE Transactions on Knowledge and Data Engineering, 32(2), 218-233. https://doi.org/10.1109/TKDE.2018.2882404.
Ibrahim, M., and Kuban, K. (2023). Key generation method from fingerprint image based on deep convolutional neural network model. Nexo Revista Científica, 36, 906-925. https://dx.doi.org/10.5377/nexo.v36i06.17447.
Istiak, M. A., Syeed, M. M., Hossain, M. S., Uddin, M. F., Hasan, M., Khan, R. H., and Azad, N. S. (2023). Adoption of Unmanned Aerial Vehicle (UAV) imagery in agricultural management: A systematic literature review. Ecological Informatics, 78, 102305. https://doi.org/10.1016/j.ecoinf.2023.102305.
Khanramaki, M., Askari Asli-Ardeh, E., and Kozegar, E. (2021). Citrus pests classification using an ensemble of deep learning models. Computers and Electronics in Agriculture, 186, 106192. https://doi.org/10.1016/j.compag.2021.106192.
Lang, C. I., Sun, F.-K., Lawler, B., Dillon, J., Dujaili, A. A., Ruth, J., . . . Boning, D. S. (2022). One class process anomaly detection using kernel density estimation methods. IEEE Transactions on Semiconductor Manufacturing, 35(3), 457-469. https://doi.org/10.1109/TSM.2022.3181468.
Latif, G., Mohammad, N., and Alghazo, J. (2023). Deepfruit: A dataset of fruit images for fruit classification and calories calculation. Data in Brief, 50, 109524. https://doi.org/10.1016/j.dib.2023.109524.
Li, D., Song, Z., Quan, C., Xu, X., and Liu, C. (2021). Recent advances in image fusion technology in agriculture. Computers and Electronics in Agriculture, 191, 106491. https://doi.org/10.1016/j.compag.2021.106491.
Li, E., Wang, L., Xie, Q., Gao, R., Su, Z., and Li, Y. (2023). A novel deep learning method for maize disease identification based on small sample-size and complex background datasets. Ecological Informatics, 75, 102011. https://doi.org/10.1016/j.ecoinf.2023.102011.
Lozano, E., and Archibald, D. (2022). Citrus annual. United States Department of Agriculture. https://www.fas.usda.gov/data/mexico-citrus-annual-7.
Lu, Y., and Young, S. (2020). A survey of public datasets for computer vision tasks in precision agriculture. Computers and Electronics in Agriculture, 178, 105760. https://doi.org/10.1016/j.compag.2020.105760.
Maheshwari, A., Mitra, P., and Sharma, B. (2022). Autoencoder: Issues, challenges and future prospect. In M. Vashista, G. Manik, O. P. Verma, and B. Bhardwaj (Eds.), Recent Innovations in Mechanical Engineering (pp. 257–266. https://doi.org/10.1007/978-981-16-9236-9_24). Springer Singapore.
Memarzadeh, M., Akbari Asanjan, A., and Matthews, B. (2022). Robust and explainable semi-supervised deep learning model for anomaly detection in aviation. Aerospace, 9(8), 437. https://doi.org/10.3390/aerospace9080437.
Michelucci, U. (2022). An introduction to autoencoders. CoRR. https://arxiv.org/abs/2201.03898 .
Momeny, M., Jahanbakhshi, A., Neshat, A. A., Hadipour-Rokni, R., Zhang, Y.-D., and Ampatzidis, Y. (2022). Detection of citrus black spot disease and ripeness level in orange fruit using learning-to-augment incorporated deep networks. Ecological Informatics, 71, 101829 https://doi.org/10.1016/j.ecoinf.2022.101829.
Murean, H., and Oltean, M. (2018, 06). Fruit recognition from images using deep learning. Acta Universitatis Sapientiae, Informatica, 10, 26-42. https://doi.org/10.2478/ausi-2018-0002.
Mzoughi, O., and Yahiaoui, I. (2023). Deep learning-based segmentation for disease identification. Ecological Informatics, 75, 102000. https://doi.org/10.1016/j.ecoinf.2023.102000.
Naranjo-Torres, J., Mora, M., Fredes, C., and Valenzuela, A. (2021). Disease and defect detection system for raspberries based on convolutional neural networks. Applied Sciences, 11(24), 11868. https://doi.org/10.3390/app112411868.
Nowak, B. (2021). Precision agriculture: Where do we stand? a review of the adoption of precision agriculture technologies on field crops farms in developed countries. Agricultural Research, 10(4), 515–522. https://doi.org/10.1007/s40003-021-00539-x.
Palei, S., Behera, S. K., and Sethy, P. K. (2023). A systematic review of citrus disease perceptions and fruit grading using machine vision. Procedia Computer Science, 218, 2504-2519. https://doi.org/10.1016/j.procs.2023.01.225.
Pedregosa, F., Varoquaux, G., Gramfort, A., Michel, V., Thirion, B., Grisel, O., . . . Duchesnay, E. (2011). Scikit-learn: Machine learning in Python. Journal of Machine Learning Research, 12, 2825–2830. https://dl.acm.org/doi/10.5555/1953048.2078195.
Peng, K., Ma, W., Lu, J., Tian, Z., and Yang, Z. (2023). Application of machine vision technology in citrus production. Applied Sciences, 13(16), 9334. https://doi.org/10.3390/app13169334.
Puerto Cuadros, E. G. (2024, Nov.). Advanced neural model for spanish spell-checking. Ingeniería, 29(3), e21135. https://dx.doi.org/10.14483/23448393.21135.
Rathnayake, N., Rathnayake, U., Dang, T. L., and Hoshino, Y. (2022). An efficient automatic fruit-360 image identification and recognition using a novel modified cascaded-anfis algorithm. Sensors, 22(12), 4401. https://doi.org/10.3390/s22124401.
Rong, D., Rao, X., and Ying, Y. (2017). Computer vision detection of surface defect on oranges by means of a sliding comparison window local segmentation algorithm. Computers and Electronics in Agriculture, 137, 59-68. https://doi.org/10.1016/j.compag.2017.02.027.
Roy, K., Chaudhuri, S. S., and Pramanik, S. (2021, September). Deep learning based real-time industrial framework for rotten and fresh fruit detection using semantic segmentation. Microsystem Technologies, 27(9), 3365–3375. https://doi.org/10.1007/s00542-020-05123-x.
Schor, N., Bechar, A., Ignat, T., Dombrovsky, A., Elad, Y., and Berman, S. (2016). Robotic disease detection in greenhouses: Combined detection of powdery mildew and tomato spotted wilt virus. IEEE Robotics and Automation Letters, 1(1), 354-360. https://doi.org/10.1109/LRA.2016.2518214.
Shahi, T. B., Sitaula, C., Neupane, A., and Guo, W. (2022). Fruit classification using attention-based mobilenetv2 for industrial applications. PLOS ONE, 17(2), 1-21. https://doi.org/10.1371/journal.pone.0264586.
Shijie, J., Ping, W., Peiyi, J., and Siping, H. (2017). Research on data augmentation for image classification based on convolution neural networks. 2017 Chinese Automation Congress (CAC) [Conference paper]. https://doi.org/10.1109/CAC.2017.8243510.
Siddiqi, R. (2020). Comparative performance of various deep learning based models in fruit image classification. In ACM (Ed.), 11th International Conference on Advances in Information Technology (p. 14). Association for Computing Machinery. https://doi.org/10.1145/3406601.3406619.
Soltani Firouz, H., Mahmoud Sardari. (2022). Defect detection in fruit and vegetables by using machine vision systems and image processing. Food Engineering Reviews, 14(3), 353–379. https://doi.org/10.1007/s12393-022-09307-1.
Tan, A., Zhou, G., and He, M. (2021). Surface defect identification of citrus based on kf-2d-renyi and abc-svm. Multimedia Tools and Applications, 80(6), 9109–9136. https://doi.org/10.1007/s11042-020-10036-y.
Thoidis, I., Giouvanakis, M., and Papanikolaou, G. (2021). Semi-supervised machine condition monitoring by learning deep discriminative audio features. Electronics, 10(20), 2471. https://doi.org/10.3390/electronics10202471.
Toosi, A., Javan, F. D., Samadzadegan, F., Mehravar, S., Kurban, A., and Azadi, H. (2022). Citrus orchard mapping in juybar, iran: Analysis of ndvi time series and feature fusion of multi-source satellite imageries. Ecological Informatics, 70, 101733. https://doi.org/10.1016/j.ecoinf.2022.101733.
Verma, R., and Verma, A. K. (2022). Fruit classification using deep convolutional neural network and transfer learning. In V. E. Balas, G. R. Sinha, B. Agarwal, T. K. Sharma, P. Dadheech, and M. Mahrishi (Eds.), Emerging Technologies in Computer Engineering: Cognitive Computing and Intelligent IoT (pp. 290–301). Springer International Publishing. DOI: https://doi.org/10.1007/978-3-031-07012-9_26
Wang, T., Zhao, L., Li, B., Liu, X., Xu, W., and Li, J. (2022). Recognition and counting of typical apple pests based on deep learning. Ecological Informatics, 68, 101556. https://doi.org/10.1016/j.ecoinf.2022.101556.
Yılmaz, E. K., Adem, K., Kılıçarslan, S., and Aydın, H. A. (2023, June). Classification of lemon quality using hybrid model based on stacked AutoEncoder and convolutional neural network. European Food Research and Technology, 249(6), 1655–1667. https://doi.org/10.1007/s00217-023-04245-6.
Zhang, H., Chen, Y., Liu, X., Huang, Y., Zhan, B., and Luo, W. (2021). Identification of common skin defects and classification of early decayed citrus using hyperspectral imaging technique. Food Analytical Methods, 14(6), 1176–1193. https://doi.org/10.1007/s12161-020-01960-8.
Ümit Atila, Uçar, M., Akyol, K., and Uçar, E. (2021). Plant leaf disease classification using efficientnet deep learning model. Ecological Informatics, 61, 101182. https://doi.org/10.1016/j.ecoinf.2020.101182.
How to Cite
APA
ACM
ACS
ABNT
Chicago
Harvard
IEEE
MLA
Turabian
Vancouver
Download Citation
CrossRef Cited-by
1. Israel Cruz Rangel, José-Ángel Arroyo-Romero, Isabel Bárcenas-Reyes, José-Joel González-Barbosa, Juan Bautista Hurtado-Ramos, Francisco-Javier Ornelas-Rodríguez, Alfonso Ramírez-Pedraza. (2025). Explorando las Profundidades. Memoria Investigaciones en Ingeniería, (28), p.110. https://doi.org/10.36561/ING.28.9.
Dimensions
PlumX
Article abstract page views
Downloads
License
Copyright (c) 2024 Angel-Moisés Hernández-Ponce, Francisco-Javier Ornelas-Rodríguez, Juan-Bautista Hurtado-Ramos, Pedro-Alfonso Ramírez-Pedraza, José-Joel González-Barbosa

This work is licensed under a Creative Commons Attribution 4.0 International License.
The authors or holders of the copyright for each article hereby confer exclusive, limited and free authorization on the Universidad Nacional de Colombia's journal Ingeniería e Investigación concerning the aforementioned article which, once it has been evaluated and approved, will be submitted for publication, in line with the following items:
1. The version which has been corrected according to the evaluators' suggestions will be remitted and it will be made clear whether the aforementioned article is an unedited document regarding which the rights to be authorized are held and total responsibility will be assumed by the authors for the content of the work being submitted to Ingeniería e Investigación, the Universidad Nacional de Colombia and third-parties;
2. The authorization conferred on the journal will come into force from the date on which it is included in the respective volume and issue of Ingeniería e Investigación in the Open Journal Systems and on the journal's main page (https://revistas.unal.edu.co/index.php/ingeinv), as well as in different databases and indices in which the publication is indexed;
3. The authors authorize the Universidad Nacional de Colombia's journal Ingeniería e Investigación to publish the document in whatever required format (printed, digital, electronic or whatsoever known or yet to be discovered form) and authorize Ingeniería e Investigación to include the work in any indices and/or search engines deemed necessary for promoting its diffusion;
4. The authors accept that such authorization is given free of charge and they, therefore, waive any right to receive remuneration from the publication, distribution, public communication and any use whatsoever referred to in the terms of this authorization.