Impact of quality improvement tools on the performance of firms using different quality management systems
Palabras clave:
herramientas de la calidad, modelos y sistemas de gestión de la calidad, ISO 9001, 2000, EFQM. (es)
gestión de la calidad en el desempeño de organizaciones que utilizan el
estándar ISO 9001:2000 como referencia para implantar un sistema de
gestión de la calidad, de los que utilizan el modelo EFQM para tal fin. Se
llevó a cabo un estudio empírico en el que participaron 107 evaluadores de
gestión de la calidad independientes y experimentados. El estudio concluye
que las organizaciones con un sistema de gestión de la calidad basado
en el estándar ISO 9001:2000 tienden a utilizar herramientas cualitativas
de carácter genérico y que dichas herramientas tienen un impacto relativo
positivo en el desempeño. Por el contrario, las organizaciones que adoptan
el modelo EFQM tienden a utilizar herramientas cuantitativas más especializadas
que producen una mejora significativa en el desempeño de dichas
organizaciones. Los resultados del estudio posibilitarán a las organizaciones
elegir las herramientas para la mejora de la calidad más efectivas para
su estrategia de calidad particular.
Iñaki Heras*, Frederic Marimon** & Martí Casadesús***
*Associated Professor Department of Management University of the Basque Country E-mail: iheras@ehu.es
** Associated Professor Department of Management Faculty of Economics and Social Sciences Universitat Internacional de Catalunya E-mail: fmarimon@cir.uic.es
*** Professor Department of Management & Product Design Polytechnic School University of Girona E-mail: marti.casadesus@udg.es
Submitted: March 2009 Accepted: November 2010
Abstract:
This study compares the impact of quality management tools on the performance of organisations utilising the ISO 9001:2000 standard as a basis for a quality-management system and those utilising the EFQM model for this purpose. A survey is conducted among 107 experienced and independent quality-management assessors. The study finds that organisations with qualitymanagement systems based on the ISO 9001:2000 standard tend to use general-purpose qualitative tools, and that these do have a relatively positive impact on their general performance. In contrast, organisations adopting the EFQM model tend to use more specialised quantitative tools, which produce significant improvements in specific aspects of their performance. The findings of the study will enable organisations to choose the most effective quality-improvement tools for their particular quality strategy.
Keywords:
Quality improvement tools, quality management models and systems, ISO 9001:2000, EFQM.
Resumen:
Este estudio compara el impacto de las herramientas para la gestión de la calidad en el desempeño de organizaciones que utilizan el estándar ISO 9001:2000 como referencia para implantar un sistema de gestión de la calidad, de los que utilizan el modelo EFQM para tal fin. Se llevó a cabo un estudio empírico en el que participaron 107 evaluadores de gestión de la calidad independientes y experimentados. El estudio concluye que las organizaciones con un sistema de gestión de la calidad basado en el estándar ISO 9001:2000 tienden a utilizar herramientas cualitativas de carácter genérico y que dichas herramientas tienen un impacto relativo positivo en el desempeño. Por el contrario, las organizaciones que adoptan el modelo EFQM tienden a utilizar herramientas cuantitativas más especializadas que producen una mejora significativa en el desempeño de dichas organizaciones. Los resultados del estudio posibilitarán a las organizaciones elegir las herramientas para la mejora de la calidad más efectivas para su estrategia de calidad particular.
Palabras clave:
herramientas de la calidad, modelos y sistemas de gestión de la calidad, ISO 9001:2000, EFQM.
Résumé :
Cette étude compare l'impact des instruments pour la gestion de la qualité dans le développement d'organisations qui utilisent le standard ISO 9001:2000 comme référence pour implanter un système de gestion de la qualité, avec les entreprises qui utilisent le modèle EFQM à cet effet. Une étude empirique a été réalisée avec la participation de 107 évaluateurs de gestion de la qualité, indépendants et expérimentés. En conclusion, les organisations qui utilisent un système de gestion de la qualité basé sur le standard ISO 9001:2000 ont tendance à utiliser des instruments qualitatifs génériques et ces instruments ont un impact positif relatif sur le développement. Par contre, les organisations qui adoptent le modèle EFQM ont tendance à utiliser des instruments quantitatifs plus spécialisés produisant des améliorations significatives dans le développement de ces entreprises. Les résultats de l'étude permettront aux organisations de choisir les instruments plus effectifs pour améliorer la qualité pour leur stratégie de qualité particulière.
Mots-clefs :
instruments de la qualité, modèles et systèmes de gestion de la qualité, ISO 9001:2000, EFQM.
Resumo:
Este estudo compara o impacto das ferramentas para a gestão da qualidade no desempenho de organizações que utilizam o padrão ISO 9001:2000 como referência para implantar um sistema de gestão da qualidade, dos que utilizam o modelo EFQM para tal fim. Realizou-se um estudo empírico em que participaram 107 avaliadores de gestão da qualidade independentes e experientes. O estudo conclui que as organizações com um sistema de gestão da qualidade baseado no padrão ISO 9001:2000 tendem a utilizar ferramentas qualitativas de caráter genérico e que tais ferramentas têm um impacto relativo positivo no desempenho. Pelo contrário, as organizações que adotam o modelo EFQM tendem a utilizar ferramentas quantitativas mais especializadas que produzem uma melhora significativa no desempenho de tais organizações. Os resultados do estudo possibilitarão às organizações escolher as ferramentas para a melhora da qualidade mais efetivas para sua estratégia de qualidade particular.
Palavras chave:
ferramentas da qualidade, modelos e sistemas de gestão da qualidade, ISO 9001:2000, EFQM.
This article has been written within the framework of the research project entitled "Improving customer satisfaction through standardization in Spanish companies" (ECO2009-12754-C02-01) financed by the Ministry for Education and Science under the system of aid grants for R+D projects. The fieldwork was carried out as part of a more extensive study conducted for the Basque Institute of Competitiveness, a member of the world network of centres for competitiveness of the Harvard Business School Institute for Strategy and Competitiveness. Quality management assessors from Euskalit, the Basque Foundation for Quality, took part in the field study. The authors thank all of these organisations for their collaboration and participation.
The historical and conceptual development of quality management has been traditionally divided into four progressive stages, which are usually characterised as: (i) quality inspection (QI); (ii) quality control (QC); (iii) quality assurance (QA); and (iv) total quality management (TQM) (James, 1996; Dale et al., 2007). In addition to these four 'traditional' stages, several authors have identified a fifth phase in quality management. Kaye and Dyason, 1999) referred to this fifth stage as being "beyond the strategic direction of quality", and attempted to define its essential criteria. Devadasan et al. (2003) subsequently analysed the literature on this 'fifth era' and reported that the term 'strategic quality management' (SQM) had been generally accepted as the name for this phase, in which the principles of TQM and strategic management have been merged.
Within individual organisations, this sequence of stages has been associated with the use of increasingly complex quality-management tools as a given company advances through the sequence of stages towards 'total quality' (Bunney and Dale, 1997). For example, during the earlier stages the emphasis is on diagnosis and data collection; typical tools in these earlier stages include benchmarking, stakeholder surveys, suggestion systems, and improvement groups (Casadesús et al., 2005). As 'higher' stages of quality management are reached and the emphasis moves to management commitment and continuous improvement, more elaborate and complex tools are required -such as statistical process control (SPC), failure mode effects and criticality analysis (FMECA), six sigma, and so on. In this regard, Perry (1995) distinguished three phases in any organisation's implementation of a quality system (the 'survival phase', the 'prevention phase', and the 'continuous improvement phase') and identified a set of specific tools corresponding to each phase.
It is thus generally accepted that it is possible to identify increasingly sophisticated levels of quality management and that these appear to be associated with the use of increasingly complex quality-management tools by individual organisations. However, there is some uncertainty regarding the impact of these developments on the performance of the companies that implement them. Handfield et al. (1999) did conduct an extensive bibliographical review of studies that had analysed the results of the use of various quality techniques, but there does not appear to have been any attempt to analyse the implementation of these tools as part of a specific quality strategy. Nor has any attempt been made to study the impact of these tools on the performance of the firms that implement them as part of such a strategy.
The overall aim of this study is, therefore, to ascertain whether the way in which quality-improvement tools are implemented has an influence on the improvement of the performance of a company. In particular, the study analyses whether the use of quality-management tools influences the performance of organisations that have deployed a quality system based on: (i) the International Organisation for Standardisation (ISO) 9001:2000 quality standard; and (ii) the European Foundation for Quality Management (EFQM) model.
The remainder of this paper is arranged as follows. Following this introduction, the paper presents a brief overview of the relevant literature on the classification of quality-management tools and systems. This concludes with the formulation of two proposed hypotheses for examination in the study. The methodology of an empirical study of the use of quality-improvement tools in a sample of Spanish firms is then described. The results are presented in the subsequent section. The paper then proposes and tests two conceptual models (one for firms utilising the ISO 9001:2000 standard and one for firms following the EFQM model). The paper concludes with a summary of the main findings and suggestions for future research.
The many tools and methods related to quality management have been categorised in various ways according to different criteria. The so-called 'seven quality-control tools' of Ishikawa (1985) represented one of the earliest attempts at classification, but many other classifications have been proposed in the literature (Juran and Gryna, 1988; Besterfield et al., 1999; Dale et al., 2007). The huge number of tools and methods that can be considered in such classifications was reflected in the work of Greene (1993), who grouped no fewer than 98 tools according to the objectives set by companies.
Apart from attempts to classify such tools, there have also been numerous studies of the implementation of these tools in a wide variety of sectors and situations. Most of these studies have adopted qualitative research methodologies, and many have been based on the analysis of a single case. Noteworthy studies have included: (i) Adams and Dale (2001), who studied the implementation of qualityimprovement tools in manufacturing companies; (ii) Cleary (1997), who studied the educational sector; and (iii) Jackson (2001) and Murray (2003) in the healthcare sector. The use of these tools has even been assessed in 'everyday situations' by Bamford and Greatbanks (2005). Among the most commons tools suggested by these academic literature (Cleary, 1997; Jackson, 2001; Adams and Dale, 2001; Murray, 2003; Bamford and Greatbanks, 2005) that could be completed by more practitioner-oriented literature (Casadesús et al., 2005; Dale et al., 2007), we could mention the following quality improvement tools: 'poka-yoke' mechanisms; failure mode effects and criticality analysis; Pareto diagrams; quality cost control; cause-effect diagrams; statistical process control; six sigma; improvement groups; process management; benchmarking; employee satisfaction survey; suggestion system; 5S methodology; in-house auditing; customer satisfaction survey; control sheets and graphs; and flow diagrams.
In contrast to the large number of studies that have examined the classification and the implementation of quality-improvement tools, the impact of these tools on the performance of organisations has not been as extensively analysed. Nevertheless, some quantitative studies of specific cases and sectors can be found in the literature, such as those conducted by He et al. (1996), Ahmed and Hassan (2003), and Tarí and Sabater (2004). In particular, Ahmed and Hassan (2003) analysed the use of some quality-improvement tools in a quantitative study (complemented by some qualitative case studies) of 63 small and medium-sized enterprises. The authors concluded that use of these tools was associated with 'better' results, irrespective of the size of the company. Tarí and Sabater (2004) undertook an empirical study of the impact of these tools in 106 Spanish companies to analyse the relationship between the use of these tools and TQM itself. They concluded that, in general, firms with a higher TQM level and the best TQM results had a greater interest in the use of these tools (although it is noteworthy that a significant number of organisations had not improved their TQM performance through the use of these tools). The authors also suspected, without providing empirical data to corroborate it, that organisations taking their first steps towards in quality management (such as implementation of ISO 9000) used few fools, whereas those at higher levels of quality management tended to use quality-improvement tools to a greater extent.
Although they have provided some interesting and useful findings regarding the impact of the use of quality-improvement tools, neither of these two studies (Ahmed and Hassan, 2003; Tarí and Sabater, 2004) specifically examined the extent to which these impacts differed between organisations implementing the ISO standard 9001:2000 and those adopting the EFQM model, which is the focus of the present study. However, Tarí and Sabater (2004) did suggest that future studies might pursue the line of research adopted in the present study.
In pursuit of this objective, the study proposes two working hypotheses for examination:
Hypothesis H1: The use of quality-improvement tools improves the global performance of organisations using the reference standard ISO 9001:2000.
Hypothesis H2: The use of quality-improvement tools improves the global performance of organisations using the EFQM quality model.
Sample and data collection
To test the proposed hypotheses, a quantitative empirical study was carried out in the Basque Autonomous Community, which has one of the highest proportions of ISO 9001-certified firms in Spain and the European Union (Heras et al., 2008), and which has accumulated many international prizes from the EFQM foundation: 19 of the 27 Excellence Awards that EFQM had conceded to Spanish organisations were given to Basque ones (Heras et al., 2008).
In a departure from common practice in studies of this type, the survey was not sent to the managers of the surveyed firms; rather, it was sent to assessors from the Basque Foundation for Quality ('Euskalit'), which is a private, not-for-profit organisation that exists to promote a culture of TQM and Business Excellence (Euskalit, 2008). The Euskalit assessors are independent professionals (academics, consultants, and managers) who offer support to Basque Country organizations that seek to improve their management and achieve standards of excellence. In view of their specialised training in quality-management standards and assessment, these assessors thus represent a reliable source of independent information, as opposed to the potential bias that is entailed if managers are asked about the implementation of quality-management standards in their own organisations that several authors have already pointed out (Vloeberghs and Bellens, 1996; Heras et al., 2002; Wayhan et al., 2002 and 2007).
The specifications for the study are shown in Table 1. Data for the study were collected between February 2007 and April 2007. The survey was sent to a total of 264 assessors, all of whom had completed at least one external assessment in the manufacturing and service sectors in 2006. Of the 264 assessors, 115 (44%) worked in the manufacturing sector, 93 (35%) in the consultancy sector, and 56 (21%) in the generic services sector (including assessors of non-profit companies).

A total of 107 valid responses were received, which corresponded to a good response rate of 40.53%. Of the 107 responses received, 46 (43%) came from industrial companies, 32 (30%) from service companies, and 29 (27%) from the consultancy sector.
Measures
The survey collected data on: (i) the degree of use of quality- improvement tools; and (ii) their impact on the performance of the organisations.
The quality-improvement tools to be assessed were chosen on the basis of relevant studies in the literature mentioned in the literature review section. The quantitative tools that were taken into consideration included: SPC, six sigma, Pareto analysis, quality costs, and FMECA, among others. The qualitative tools included benchmarking, qualitative surveys, suggestion systems, and improvement groups, among others.
The full list of tools that were examined was as follows:
- 'poka-yoke' mechanisms;
- failure mode effects and criticality analysis (FMECA);
- Pareto diagrams;
- quality cost control (QCC);
- cause-effect diagrams;
- statistical process control (SPC);
- six sigma;
- improvement groups;
- process management;
- benchmarking;
- employee satisfaction survey;
- suggestion system;
- 5S methodology
- in-house auditing;
- customer satisfaction survey;
- control sheets and graphs; and
- flow diagrams
The extent of use of each tool was measured on a scale of 1 to 3, in which 1 indicated 'non-use', 2 indicated 'specific use', and 3 indicated 'systematic use'.
To measure the performance of the organisations, the academic literature was again consulted for commonly used indicators of the impact of quality management on company performance (Powell, 1995; Hendricks and Singhal, 1997; Anderson et al., 1999; Simmons and White, 1999; Rahman, 2001; Singels et al., 2001; Chow-Chua et al., 2003; Sila and Ebrahimpour, 2005; Heras, 2006).
Twelve commonly used indicators were chosen for use in the present study.
- improvement in quality of its products/services;
- cost-effectiveness of the company;
- productivity;
- price/cost ratio of the product;
- sales growth;
- improvement in commercial margins;
- growth in market share;
- growth in exporting capacity;
- external image improvement;
- improvement in personnel training;
- greater use of external consultants; and
- incorporation of new qualified staff.
Assessors were asked to indicate the values of these items on a scale of 1 to 5, in which 1 indicated 'very little impact' (of the management system on the indicator), and 5 indicated 'very great impact'.
Use of quality-improvement tools
The extent of use of the quality-management tools and methods in the organisations with which the assessors were associated is shown in Figure 1.
It is apparent that the tools that required a greater level of knowledge and/or experience (especially the quantitative techniques, such as SPC or six sigma) were used much less frequently than other tools. In contrast, the qualitative techniques of 'opinion-gathering' (such as surveys and improvement groups) were obviously used more frequently.
Exploratory factor analysis was utilised to ascertain how the use of these various techniques varied among the different organisations in the sample. The principal component method with varimax rotation was used for this purpose, with extraction of factors with eigenvalues greater than one. Both the Kaiser-Meyen-Olkin (KMO) measure (0.847) and the Bartlett test of sphericity forecast good results. The analysis captured 60.89% of variance with four factors.
Variables were then loaded onto several factors, and the criteria for scale purification of John and Reve (1982) were subsequently applied. The results of a second factor analysis, made up of only three factors, are shown in Table 2.
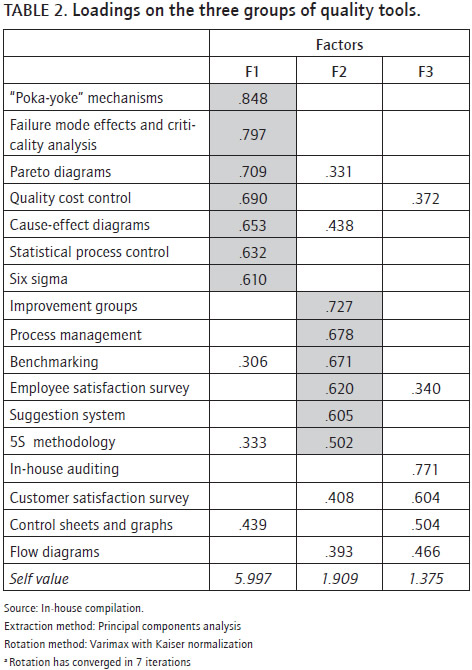
The first two factors, labelled 'quantitative tools' (F1) and 'group tools' (F2), coincided with the descriptive analysis noted above, which had clearly identified at least two groups of techniques. The first factor (F1) thus consisted of such quantitative (or 'hard') tools as: (i) cause-effect diagrams; (ii) Pareto diagrams; (iii) six sigma; (iv) quality control costs; (v) 'Poka-yoke' mechanisms; (vi) FMECA; and (vii) SPC. The second factor (F2) consisted of such qualitative (or 'soft') tools as: (i) improvement groups; (ii) suggestion systems; (iii) employee satisfaction surveys; (iv) process management; (v) Benchmarking; and (vi) 5S methodology. However, the factor analysis also detected a third group, albeit less clearly than the first two. This group, which was labelled 'control tools' (F3), consisted of such tools as: (i) internal auditing; (ii) customer satisfaction surveys; (iii) control sheets and graphs; and (iv) flow diagrams.
The psychometric properties of the three groups are presented in Table 3. An acceptable level of reliability for F1 and F2 was revealed by the values of Cronbach's alpha, which exceeded 0.7 in both cases (Nunnally and Bernstein, 1994; Hair et al., 1998). Two exploratory analyses were also carried out, one for each of these two factors; in both cases, a single factor was extracted, which confirmed the internal convergent validity of these two constructs. In contrast, Cronbach's alpha for the third factor (0.419) did not exceed the minimum criterion of 0.7. The reliability of this factor was not guarantied and it led us to decide to remove this factor in our analysis.
In accordance with the descriptive statistics shown in Figure 1, it was confirmed that quantitative tools (F1) were used to a lesser degree than those used to obtain group information (F2). On a scale of 1 to 3, the average degree of use of the 'quantitative tools' was 1.76, whereas that of the 'group tools' was 2.41.
An alternative nomenclature for these two groups of tools might be 'hard' and 'soft', according to their difficulty of implementation. Adopting this nomenclature, 'soft' tools would be largely those included in the second group -that is, tools that do not require infrastructure, significant initial investment, or education and training for their implementation; results from these tools can emerge relatively quickly. In contrast, 'hard' tools would include those grouped in the first factor -that is, quantitative tools that require greater knowledge and expense to implement.
The performance of the firms
Table 4 shows the values of the items used to assess performance on a scale of 1 to 5 (1 = 'very little impact'; 5 = 'very great impact') in the context of ISO 9001 or EFQM. The table also includes a difference of means test of all the indicators.
As can be observed, significant differences existed in all cases except the first. Thus, according to the assessors, the impact on performance differed according to whether the quality system of the organisation was based on the ISO 9001:2000 standard or on the EFQM model.
However, it is noteworthy that the average assessment of the twelve indicators in the context of the ISO 9001:2000 standard was 2.76, which is less than the neutral value (3.0) of the measurement scale. Moreover, the average value of the indicators in the context of the EFQM model was only 3.19, which is slightly above the neutral value. Based on these results, it would seem that the contribution of these tools to the improvement of the performance was not great (albeit 'better' in the case of the EFQM model).
An exploratory factor analysis was then made of the elements related to performance in the ISO 9001:2000 setting. The KMO measure of sampling adequacy was 0.792, which promised good analytical results. The Bartlett indicator was also positive. Three factors with an eigenvalue greater than one captured 65.31% of the sampling variance (see Table 5).

The analysis identified three factors. The first (F4), labelled 'commercial improvement', included indicators that were associated with an improvement in performance from a commercial perspective. Applying the same scale-purification criteria as was described in the analysis of the qualityimprovement tools, the items of 'productivity' and 'growth in exporting capacity' were eliminated. This left the following items on F4: (i) sales growth; (ii) growth in market share; (iii) improvement in commercial margins; (iv) price/cost ratio of the product; and (v) cost-effectiveness of the company.
The second factor (F5), labelled 'external image improvement', was not as conceptually distinct. It consisted of the following items: (i) improvement in quality of products/ services; (ii) external image improvement; and (iii) improvement in staff training.
The third factor (F6), labelled 'incorporation of external knowledge', was quite distinct. It consisted of the following items: (i) greater use of external consultants; and (ii) incorporation of new qualified staff.
Table 6 shows the analysis for the same items, but with the EFQM model (rather than the ISO 9001 standard) as the basis for implementing the quality system. In this case, the KMO index was 0.855, and the three identified factors captured 77.93% of the variability.
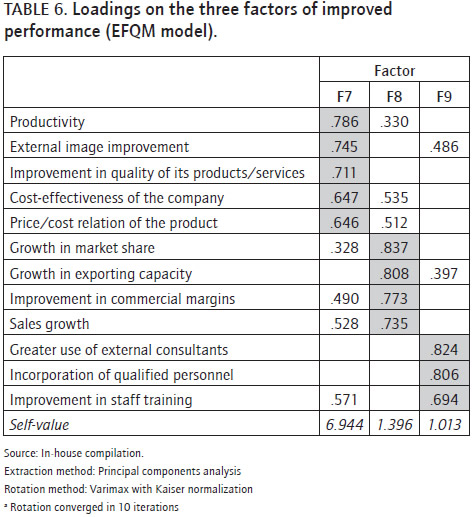
In this case, the first factor (F7) was labelled 'global efficiency'. It consisted of the following items: (i) improvement in quality of products/services; (ii) cost-effectiveness of the company; (iii) productivity; (iv) price/cost ratio of the product; and (v) external image improvement.
The second factor (F8), which was labelled 'commercial improvement', was similar to the first factor (F4) of the same name in the previous analysis; indeed, of the four items that constituted F8, four had also appeared in F4: (i) sales growth; (ii) improvement in commercial margins; (iii) growth in market share; and (iv) growth in exporting capacity.
As in the previous analysis, the third factor (F9) was labelled 'incorporation of external knowledge'. This referred to the organisation's capacity to attract external talent and know-how by employing qualified personnel, training staff, or taking on consultancy services. It consisted of the following items: (i) improvement in staff training; (ii) greater use of external consultants; and (iii) incorporation of new qualified staff.
A subsequent reliability analysis of the six sub-scales related to improved performance (F4-F9) is shown in Table 7. It is apparent that the criterion for reliability (Cronbach's alpha of 0.7) was exceeded by all of the factors, except F6.
As summary of this subsection, the significant differences on performance among the organisations based on the ISO 9001 and the EFQM model have to be pointed out. In our opinion, this is a very interesting finding that might need further research.
Impact of quality tools on ISO 9001:2000 firms
On the basis of the results described above, an explanatory model can be proposed to conceptualise and test the first of the hypotheses -which proposed that the use of quality-improvement tools improves the global performance of organisations using the ISO standard 9001:2000. The model is presented in Figure 2.
As can be seen in the diagram the second-order construct 'use of tools' (F10) is derived from two first-order latent variables: (i) the use of 'hard' quantitative tools (F1); and (ii) the use of 'soft' qualitative tools (F2). Another second- order construct, which reflects the level of global performance of the company (F11), is also related to two first-order latent variables: (i) 'commercial performance' (F4); and (ii) 'image improvement' (F5).
Structural equation modelling (SEM) was used to confirm the model. The fit statistics were adequate. A Satorra- Bentler chi-squared statistic of 219.9 (with 182 degrees of freedom and an associated p-value of 0.02877) was obtained. The comparative fit index (CFI) was 0.927, which was compatible with the level recommended by Byrne (1994). The RMSEA of 0.055 and the confidence limits (of 90% of the limits of the RMSEA) of 0.019 and 0.079 were all within acceptable limits in accordance with Hu and Bentler's (1999) proposed cut-off value of 0.06 for the RMSEA. All the loadings of the measurement model (external model) were high, with only one variable loading below 0.5 on its factor. The internal model coefficients with their corresponding statistics are shown in Table 8.
}
Although all the second-order steps were significant, no significant relationship was definitively identified between the use of quality tools and an increase in a company's performance when it based its quality system on the ISO 9001:2000 standard. The first hypothesis (which proposed that the use of quality-improvement tools improves the global performance of organisations using the reference standard ISO 9001:2000) must therefore be rejected.
To ascertain whether specific groups of quality tools had a direct impact on particular factors of performance, analysis by partial least squares (PLS) was undertaken using a so-called 'bootstrap routine' (which involved taking 1000 samples of 100 cases each). The results are presented in Table 9. In this modelling, the goodness-of-fit index (Tenenhaus et al., 2004) was 0.4880.
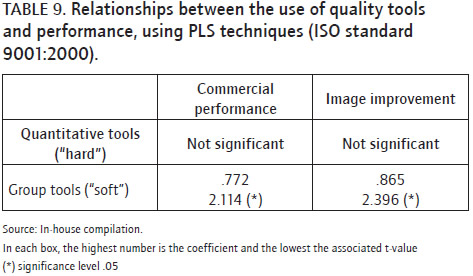
It is apparent from these results that the use of 'soft' quality tools did improve performance -from both a commercial perspective and from the perspective of image enhancement.
Impact of quality tools on EFQM firms
The model shown in Figure 3 for EFQM firms was of a similar structure to that of Figure 2 for ISO 9001 firms, with the exception that the EFQM model had three (rather than two) dependent variables. In this case, the dependent variables were: (i) efficiency (F7); (ii) commercial improvement (F8); and (iii) incorporation of external knowledge (F9). This model conceptualises the second proposed hypothesis -which proposed that the use of quality-improvement tools improves the global performance of organisations using the EFQM management model.
The confirmatory analysis of this model was again conducted with the robust maximum likelihood (RML) method. Due to the size of the sample, the fit statistics were not expected to be completely satisfactory; the results were: Satorra-Bentler chi-square = 367.72 (with 267 degrees of freedom and an associated p-value of.00001); CFI = 0.791; and a confidence interval of 90% of RMSEA between 0.073 and 0.118. Nevertheless, all the loadings of the measurement model (external model) were high, with only one variable loading below 0.5 on its factor. Taking into account the fit limitations noted above, the model's coefficients with its corresponding statistics are shown in Table 10.
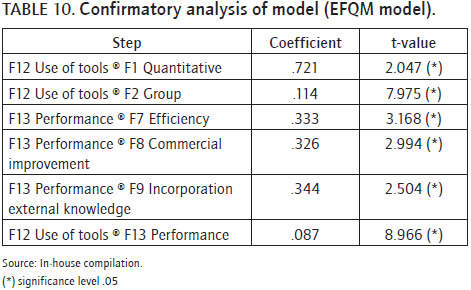
The significance of the coefficient relating the 'use of tools' construct (F12) with 'performance' (F13) was significant, although the coefficient value itself was quite low. This indicates that the implementation of quality tools increased the level of performance, although the influence was weak.
This finding is different from that in the preceding model, in which the analogous t-value was far from significant. Therefore, allowing for the reservations regarding the fit of the model, it can be concluded that Hypothesis 2 (which proposed that the use of quality-improvement tools improves the global performance of organisations using the EFQM quality model) is confirmed.
To ascertain whether specific groups of quality tools had a direct impact on particular factors of performance, analysis by PLS was again undertaken. The goodness-of-fit index was quite low (0.1908); indeed, the r2 of the three performance factors were all low (between 0.04 and 0.08).
The results show that, although the model does not explain the variability of the three constructs of performance, quantitative tools do help to improve the performance of firms that adopt the EFQM model -considered from both the perspective of efficiency and the perspective of commercial performance (Table 11). It is noteworthy that these are precisely the tools that had no influence on the ISO 9001:2000-certified companies.

Common factors in both models
To analyse the impact of the common factors in both models, two new constructs were introduced:
F14: shared commercial improvement in an ISO 9001:2000 setting; and
F15: shared commercial improvement in an EFQM setting.
These factors were made up of the same items, which included: (i) sales growth; (ii) improvement in commercial margins; (iii) growth in market share; and (iv) growth in exporting capacity. The reliability of both constructs was positive, and the models were confirmed as having a sufficient fit.
The aim was to ascertain whether 'quantitative tools' and 'group tools' had an influence on 'commercial improvement' for organisations implementing either the ISO 9001:2000 standard or the EFQM model. The main finding was confirmation of the existence of a significant relationship between the use of quality tools and commercial improvement in performance for companies that had implemented the EFQM model.
In summary, all of these results indicated that 'soft' tools (those that extract group information) were associated with ISO 9001:2000 and did not have a significant impact on performance, whereas a substantial improvement in performance was apparent in firms implementing the EFQM model using quantitative 'hard' tools.
This study of the implementation of quality-improvement tools in firms utilising the ISO 9001:2000 standard or the EFQM model has identified two groups of quality tools: (i) those of a quantitative kind, characterised as 'hard' in the present study, which focus on specific tasks and objectives and which typically require knowledge and experience of the tools to be implemented effectively; and (ii) tools of a generally qualitative nature, characterised as 'soft' in the present study, which focus on general knowledge-sharing to generate ideas for improvement.
The specific contribution of the paper can be summarized as follows: In the empirical work that has been carried out 'hard' quality tools are used much less frequently than 'soft' tools, which probably reflects the greater degree of knowledge and experience required within the organisation to utilise the former compared with the latter. However, the study has also shown that these 'hard' tools are precisely the instruments that enable organisations to improve their performance. In particular, the study has confirmed that the use of such tools and methodologies as six sigma, SPC, and FMECA has a significant impact on commercial performance. These results confirm the findings of Bunney and Dale (1997) in their study of one empirical case.
The effect of quality-improvement tools on performance was especially noted in firms that used the EFQM model. In the case of ISO 9001:2000, the use of quality tools barely improved performance. However, ISO 9001:2000 is associated with a more intensive use of the tools that were characterised as 'soft' in the present study, and the analysis has provided enough evidence to conclude that extensive use of these 'soft' tools has an influence on improving performance from a commercial perspective.
The study has thus concluded that the approach used for quality management (ISO 90009001:2000 or EFQM in this study) determines the type of tools used. These findings are in general accordance with those of Greene (1993) and Tarí and Sabater (2004) in noting that the specific circumstances of a given company require the use of particular quality-improvement tools. When a given organisation begins to implement total quality management, it will use 'soft' general-purpose tools that do not require great knowledge or experience. At a later ('higher') level of quality management, this organisation will utilise more sophisticated tools for specific purposes, thus gaining a greater impact in terms of improved performance.
For managers, this article has some clear implications. On the one hand, the significant differences on performance among the organisations based on the ISO 9001 and EFQM model have to be pointed out. Furthermore, in our opinion this is a very interesting finding that might need further research in order to explain the nature of those differences. In short, we'll put forward that the differences could be related to the varied motivations (internal or external) that drive the organisations to adopt both ISO 9001 and EFQM models, something that could impact on their outcomes and performance, an effect that has been recently evidenced for the ISO 9001 context (e.g. Boiral and Roy, 2007). On the other hand, the study has shown which are the specific quality management tools that enable organisations to improve their performance.
It is acknowledged that the present study is of an exploratory nature and that it used a relatively small sample size. Nevertheless, it is contended that the study has been robust enough to indicate clear tendencies in the production and service sectors. Future studies could investigate these trends in other sectors of importance, such as education and healthcare, in which significant progress in quality management has occurred in recent years.
Adams, A. B. J. & Dale, B. G. (2001). The use of quality management tools and techniques: A study in plastic injection moulding manufacture, Proceedings of the Institution of Mechanical Engineers Part B. Journal of Engineering Manufacture, 215(6), 847-855.
Ahmed, S. & Hassan, M. (2003). Survey and case investigations on application of quality management tools and techniques in SMIs. International Journal of Quality & Reliability Management, 20(7), 795-826.
Anderson, S. W., Daly, J. D. & Johnson, M. F. (1999). Why firms seek ISO 9000 certification: Regulatory compliance or competitive advantage? Production & Operations Management, 8(1), 28-43.
Bamford, D. R. & Greatbanks, R. W. (2005). The use of quality management tools and techniques: A study of application in everyday situations. International Journal of Quality & Reliability Management, 22(4), 376-392.
Besterfield, D., Besterfield-Michna, C., Besterfield, G. & Besterfield- Sacre, M. (1999). Total quality management. New Jersey: Prentice-Hall.
Boiral, O. & Roy, M. J. (2007). ISO 9000: Integration rationales and organizational impacts. International Journal of Operations & Production Management, 27(2), 226-247.
Bunney, H. & Dale, B. (1997). The implementation of quality management tools and techniques: A study. The TQM Magazine, 9(3), 183-189.
Byrne, B. M. (1994). Structural equation modeling with EQS and EQS/Windows. Basic concepts. Applications and programming. Thousand Oaks: Sage Publications.
Casadesús, M., Heras, I. & Merino, J. (2005). Calidad práctica. Una guía para no perderse en el mundo de la calidad. Madrid: Prentice Hall.
Chow-Chua, C., Goh, M. & Wan, T. B. (2003). Does ISO 9000 certification improve business performance? International Journal of Quality & Reliability Management, 20(8), 936-953.
Cleary, B. (1997). Promoting the use of quality management tools in the classroom. Quality Progress, 30(5), 8.
Dale, B. G., van der Wiele, T. & van Iwaarden, J. (2007). Managing quality, 5th edition. Oxford: Blackwell Publishing.
Devadasan, S., Muthu, S., Samson, R. & Sankaran, R. (2003). Design of total failure mode and effects analysis programme. International Journal of Quality & Reliability Management, 20(5), 551-568.
Euskalit. (2008). Basque Foundation for Quality ('Euskalit'). <www.euskalit.net>, acccessed 2008.
Greene, R. (1993). Global quality. A synthesis of the world's best management methods. Milwaukee: AS QC Quality Press.
Hair, J. F., Anderson, R. E., Tatham, R. L. & Black, W. C. (1998). Multivariate data analysis, 5th ed. Upper Saddle River, New Jersey: Ed. Prentice Hall International. Inc.
Handfield, R., Jayaram, J. & Ghosh, S. (1999). An empirical examination of quality tool deployment patterns and their impact on performance. International Journal of Production Research, 37(6), 1043-1426.
He, Z., Staples, G., Ross, M. & Court, I. (1996). Fourteen Japanese quality tools in software process improvement. The TQM Magazine, 8(4), 40-44.
Hendricks, K. B. & Singhal, V. R. (1997). Does implementing an effective TQM-Program actually improve operating performance? Empirical evidence from firms that have won quality awards. Management Science, 43(9), 1258-1274.
Heras, I. (2006). How quality management models influence company results. Total Quality Management & Business Excellence, 17(6), 775-794.
Heras, I. (dir.), Arana, G., Camisón, C., Casadesús, M. & Martiarena, A. (2008). Gestión de la calidad y competitividad de las empresas de la CAPV. Bilbao: Publicaciones de la Universidad de Deusto.
Heras, I., Dick, G. P. M. & Casadesus, M. (2002). ISO 9000 registration's impact on sales and profitability. A longitudinal analysis of performance before and after accreditation. International Journal of Quality and Reliability Management, 19(6), 774-791.
Hu, L. & Bentler, P. (1999). Cutoff criteria for fit indexes in covariance structure analysis: Conventional criteria versus new alternatives. Structural Equation Modeling, 6(1), 1-55.
Ishikawa, K. (1985). What is total quality control? The Japanese way. New Jersey, Prentice Hall.
Jackson, S. (2001). Successfully implementing total quality management tools within healthcare: What are the key actions? International Journal of Health Care Quality Assurance, 14(4), 157-163.
James, P. (1996). Total quality management. An introductory text. Madrid: Prentice Hall.
John, G. & Reve, T. (1982). The reliability and validity of key informant data from dyadic relationship in marketing channels. Journal of Marketing Research, 19, 517-524.
Juran, J. & Gryna, F. (1988). Quality control handbook. New York: McGraw-Hill.
Kaye, M. & Anderson, R. (1999). Continuous improvement: The ten essential criteria. International Journal of Quality & Reliability Management, 16(5), 485-506.
Kaye, M. & Dyason, M. (1995). The fifth era. The TQM Magazine, 7(1), 33-37.
Murray, P. (2003). Applying quality management tools to medical photography services: A pilot project. Journal of Audiovisual Media Med, 26(1), 23-26.
Nunnally, J. C. & Bernstein, I. H. (1994). Psychometric theory. New York: McGraw-Hill.
Perry, L. (1995). Effective facilitators. A key element in successful continuous improvement process. Training for Quality, 3(4), 9-14.
Powell, T. C. (1995). Total quality management as competitive advantage: A review and empirical study. Strategic Management Journal, 16(1), 15-37.
Rahman, S. (2001). A comparative study of TQM practice and organizational performance of SME s with and without ISO 9000 certification. International Journal of Quality & Reliability Management, 18(1), 35-49.
Sila, I. & Ebrahimpour, M. (2005). Critical linkages among TQM factors and business results. International Journal of Operations & Production Management, 25(11), 1123-1155.
Simmons, B. L. & White, M. A. (1999). The relationship between ISO 9000 and business performance: Does registration really matter? Journal of Managerial Issues, 11, 330-343.
Singels, J., Ruël, G. & van de Water, H. (2001). ISO 9000 series certification and performance. International Journal of Quality & Reliability Management, 18, 62-75.
Tarí, J. & Sabater, V. (2004). Quality tools and techniques: Are they necessary for quality management? International Journal of Production Economics, 92, 267-280.
Tenenhaus, M., Amato, S. & Esposito, V. (2004). A global goodness-offit index for PLS structural equation modeling. Proceedings of the Italian Statistical Society meeting in 2004 (Bari on June 9-11, 2004).
Vloeberghs, D. & Bellens, J. (1996). Implementing the ISO 9000 standards. Quality Progress, 29(6), 43-48.
Wayhan, V. B. & Balderson, E. L. (2007). TQM and financial performance: A research standard. Total Quality Management and Business Excellence, 18(4), 393-401.
Wayhan, V. B., Kirche, E. T. & Khumawala, B. M. (2002). ISO 9000 certification: The financial performance implications. Total Quality Management and Business Excellence, 13, 217-231.
Cómo citar
APA
ACM
ACS
ABNT
Chicago
Harvard
IEEE
MLA
Turabian
Vancouver
Descargar cita
Visitas a la página del resumen del artículo
Descargas
Licencia
Derechos de autor 2011 Innovar

Esta obra está bajo una licencia internacional Creative Commons Reconocimiento-NoComercial-CompartirIgual 3.0.
Todos los artículos publicados por Innovar se encuentran disponibles globalmente con acceso abierto y licenciados bajo los términos de Creative Commons Atribución-No_Comercial-Sin_Derivadas 4.0 Internacional (CC BY-NC-ND 4.0).
Una vez seleccionados los artículos para un número, y antes de iniciar la etapa de cuidado y producción editorial, los autores deben firmar una cesión de derechos patrimoniales de su obra. Innovar se ciñe a las normas colombianas en materia de derechos de autor.
El material de esta revista puede ser reproducido o citado con carácter académico, citando la fuente.
Esta obra está bajo una Licencia Creative Commons:


